Financial Analysis of Glaxo Smith and Reckitt Benckiser
VerifiedAdded on  2023/01/16
|24
|3883
|42
Report
AI Summary
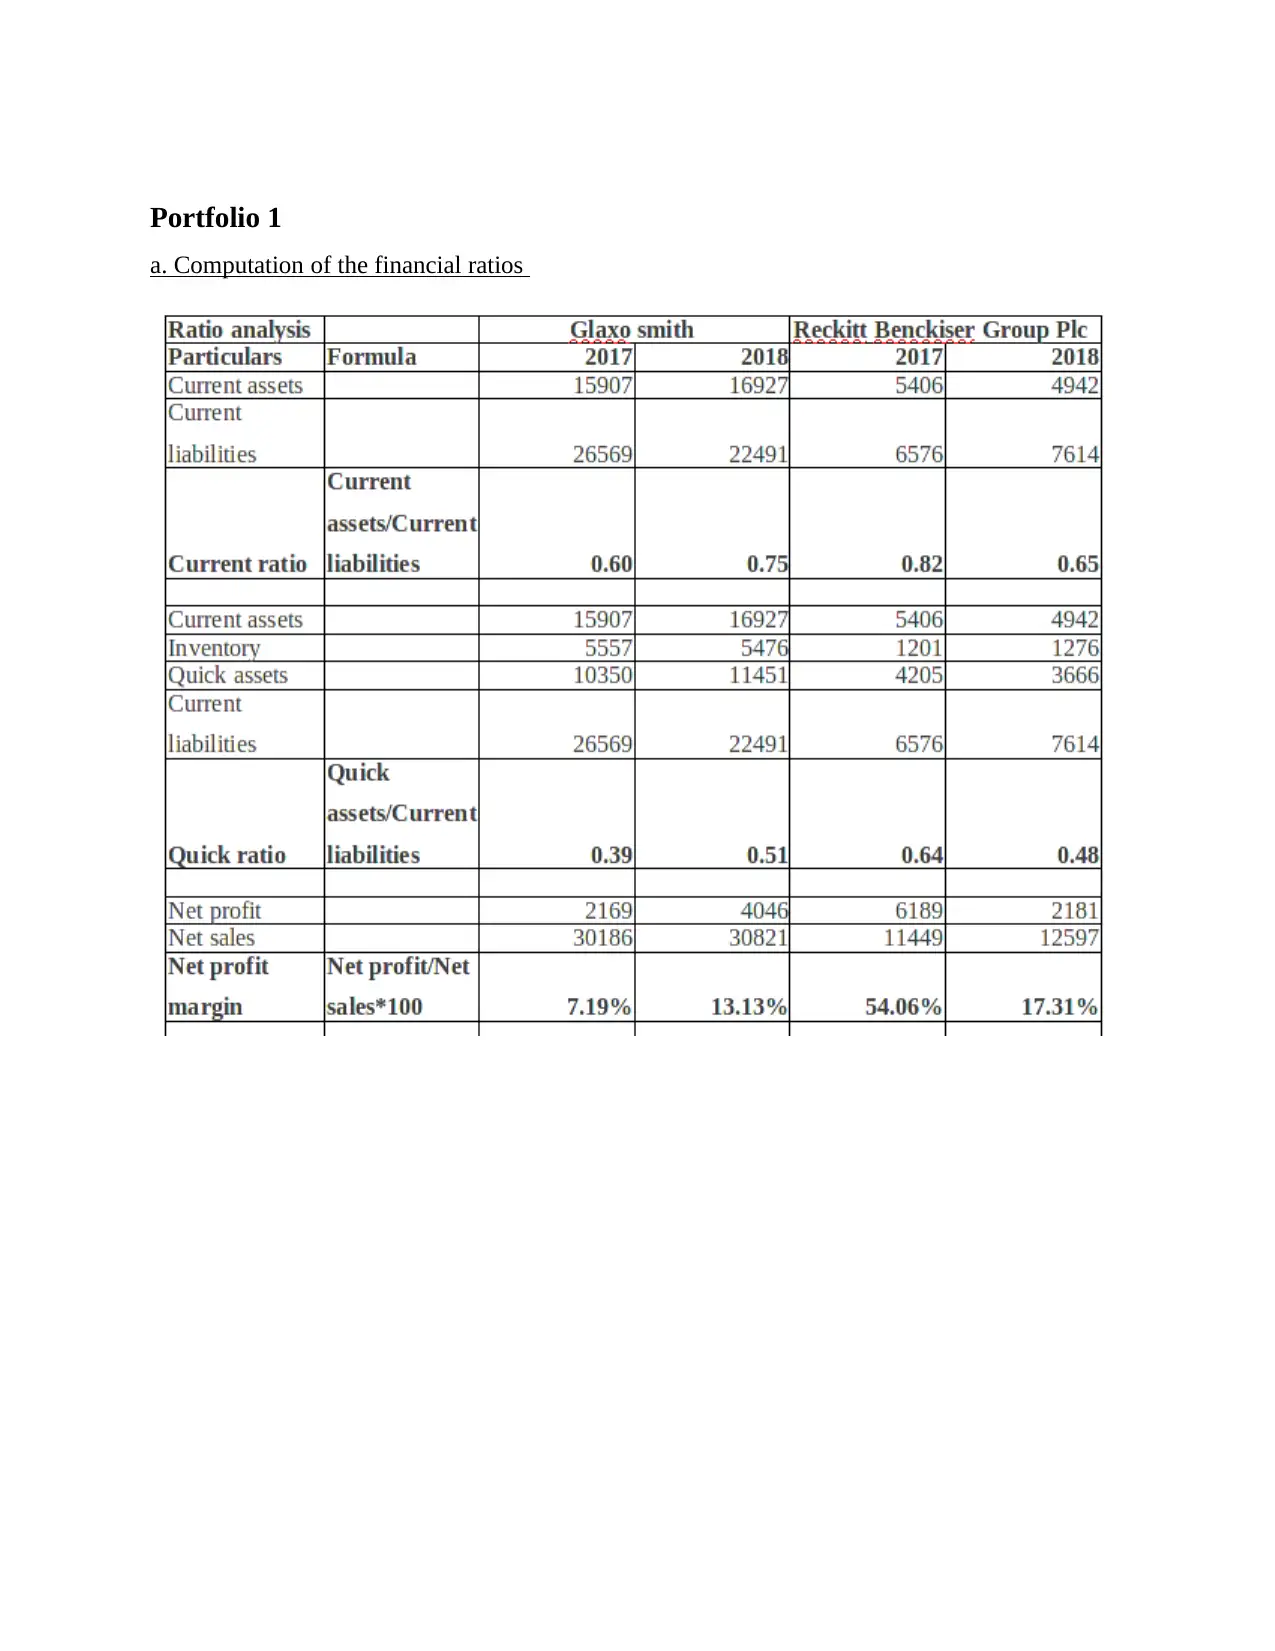
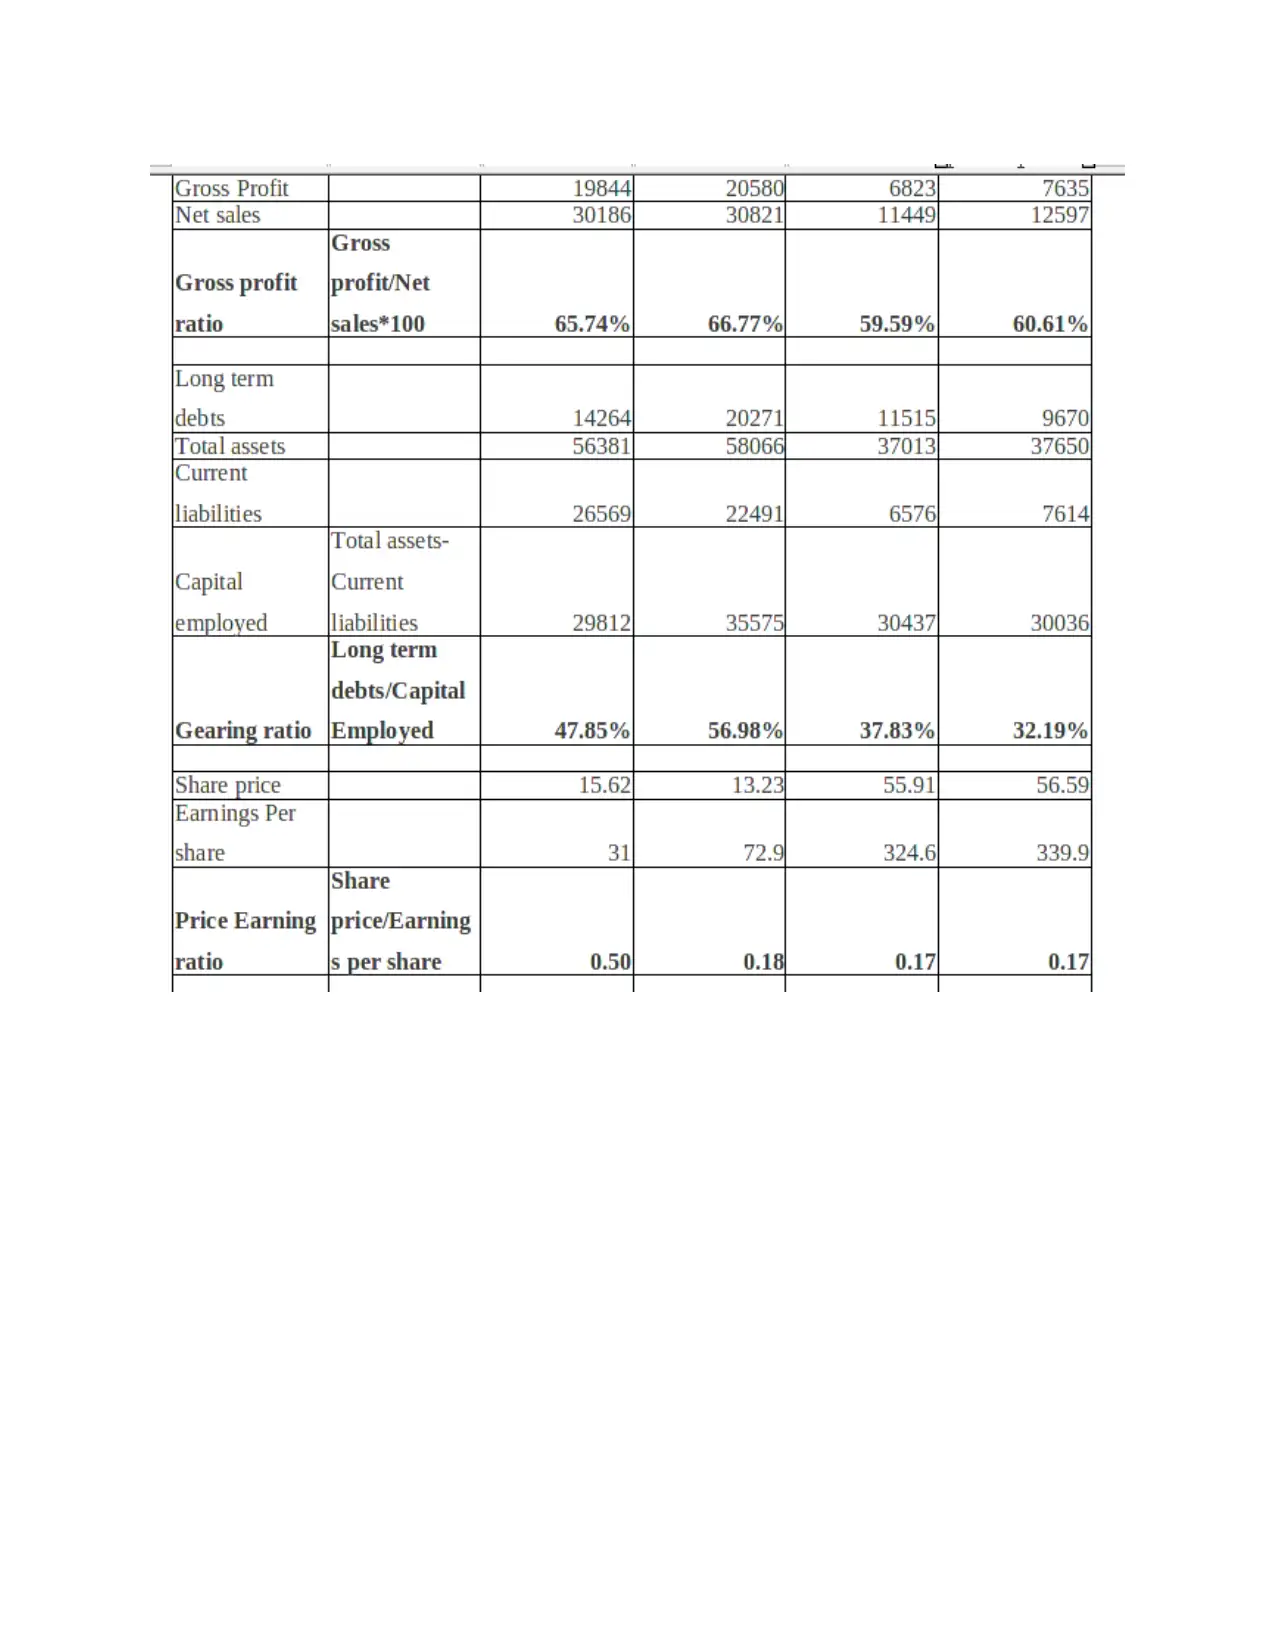
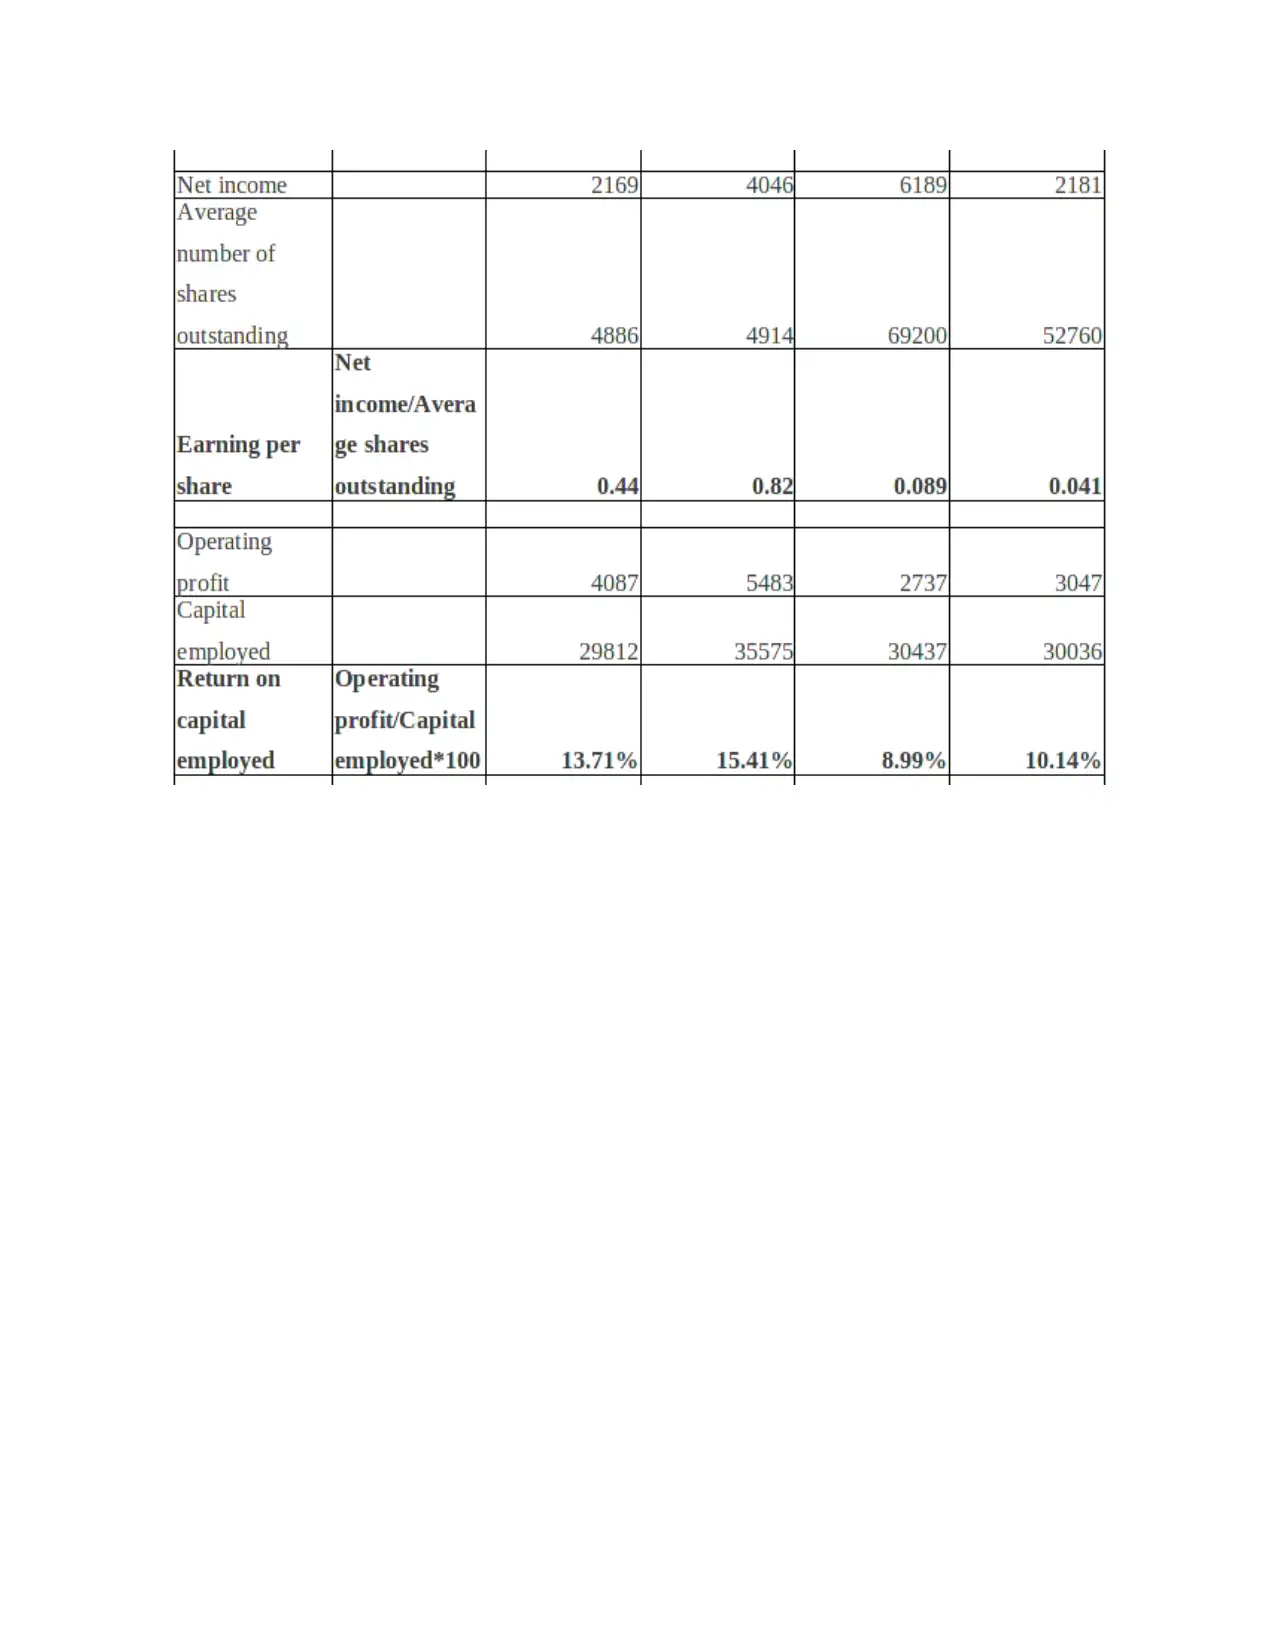
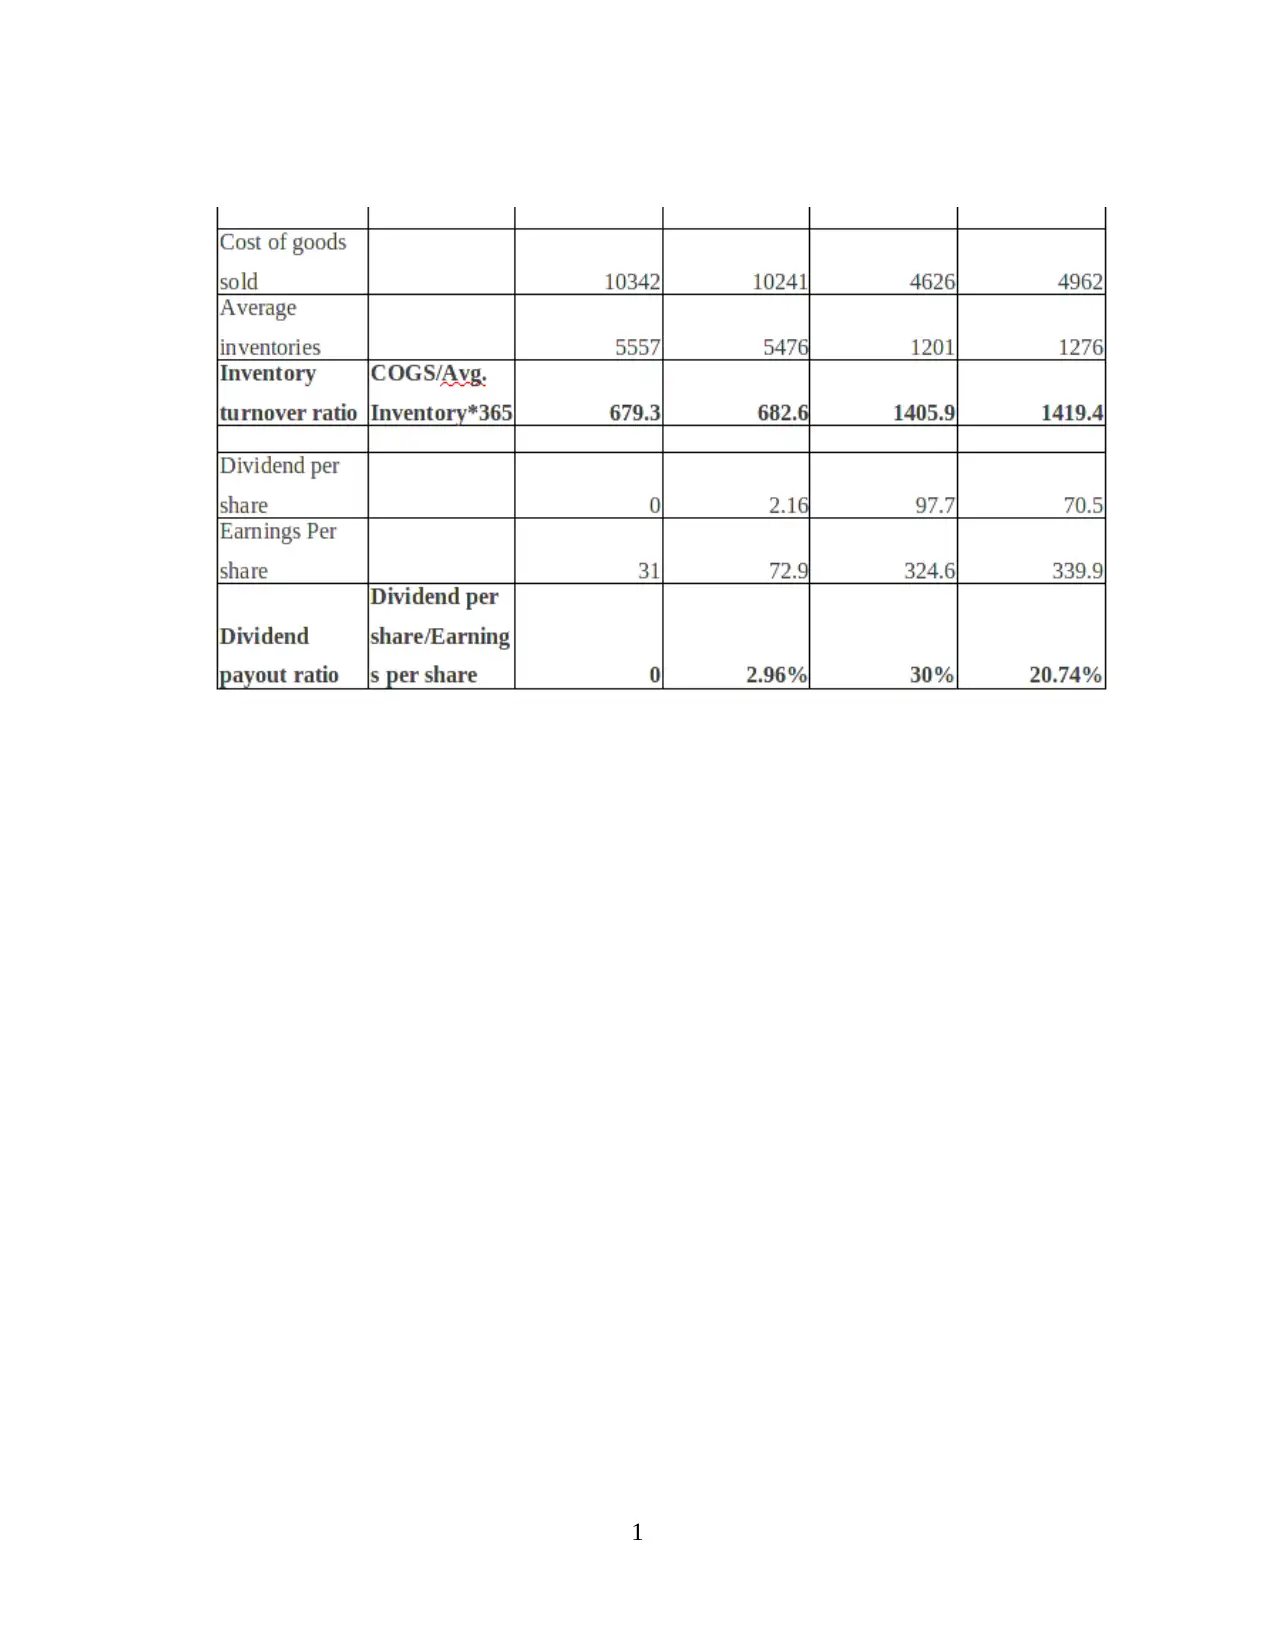
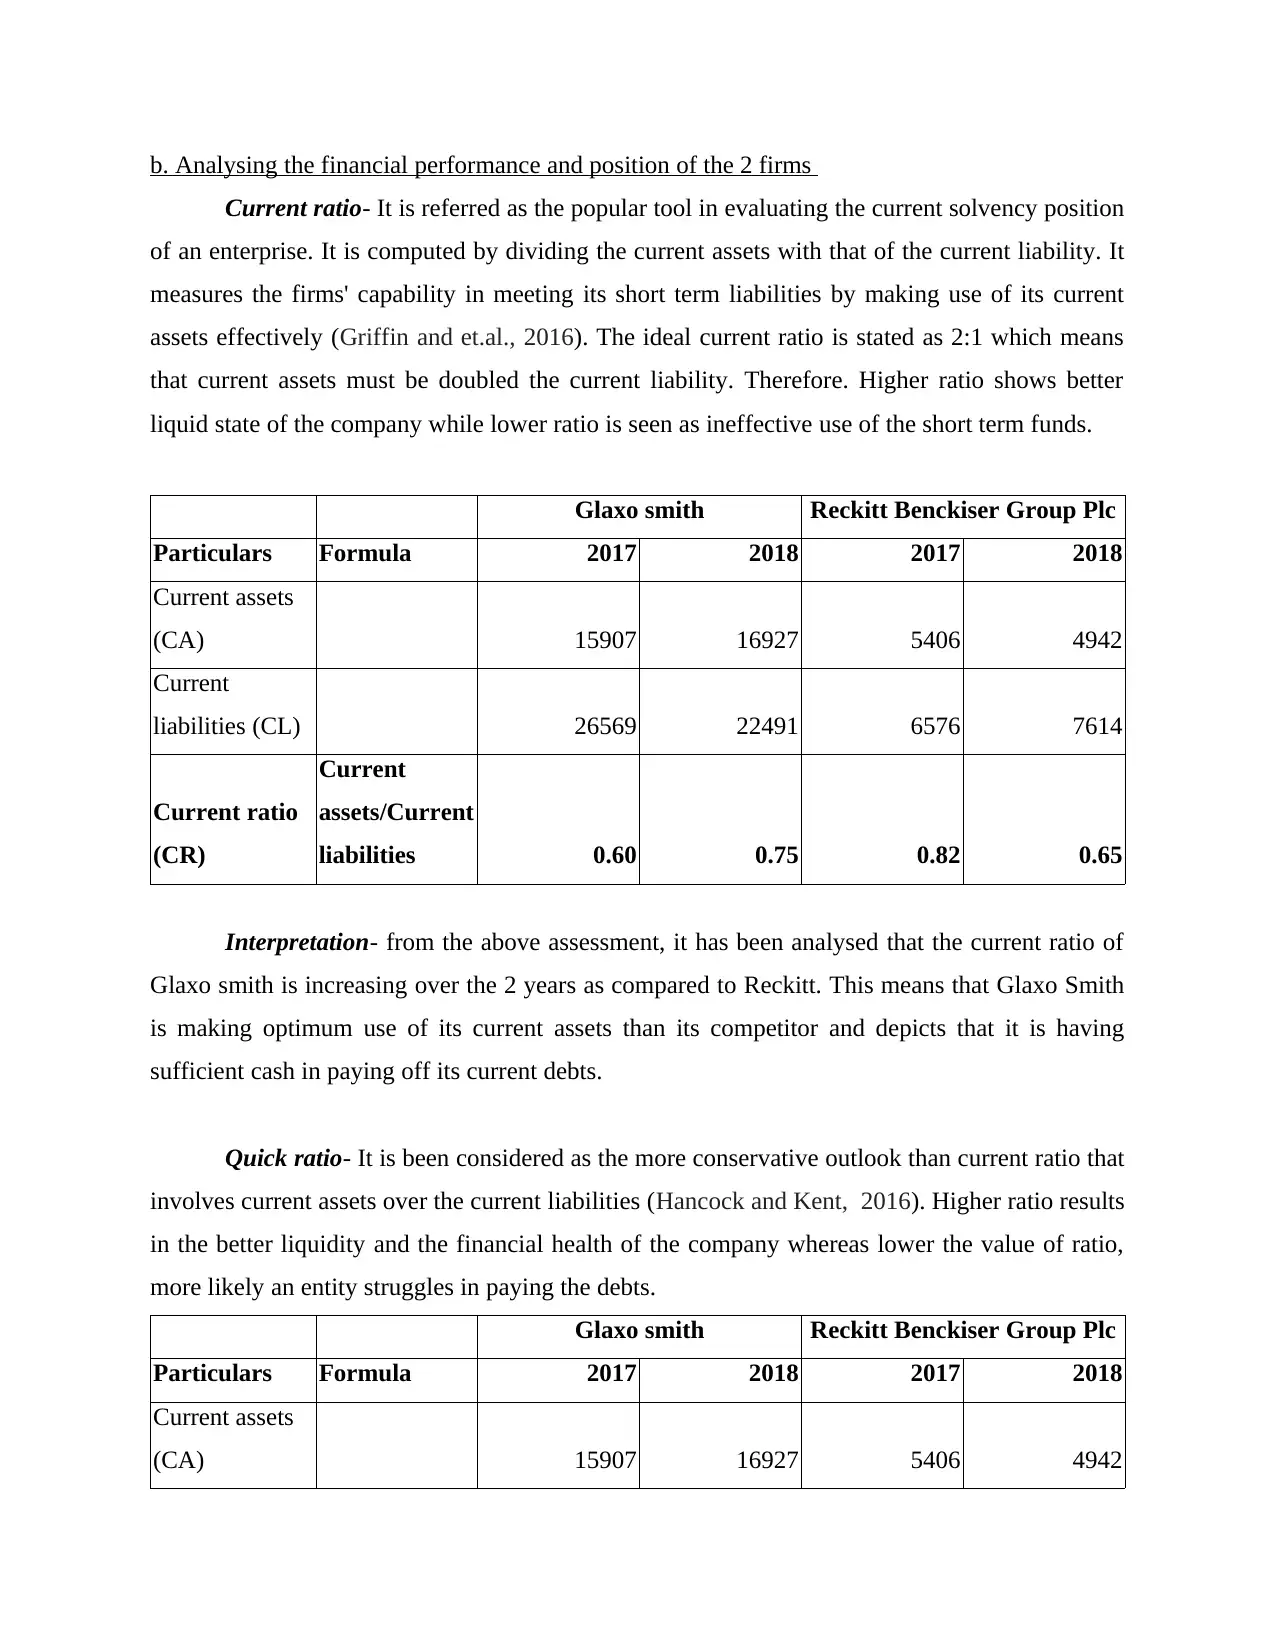
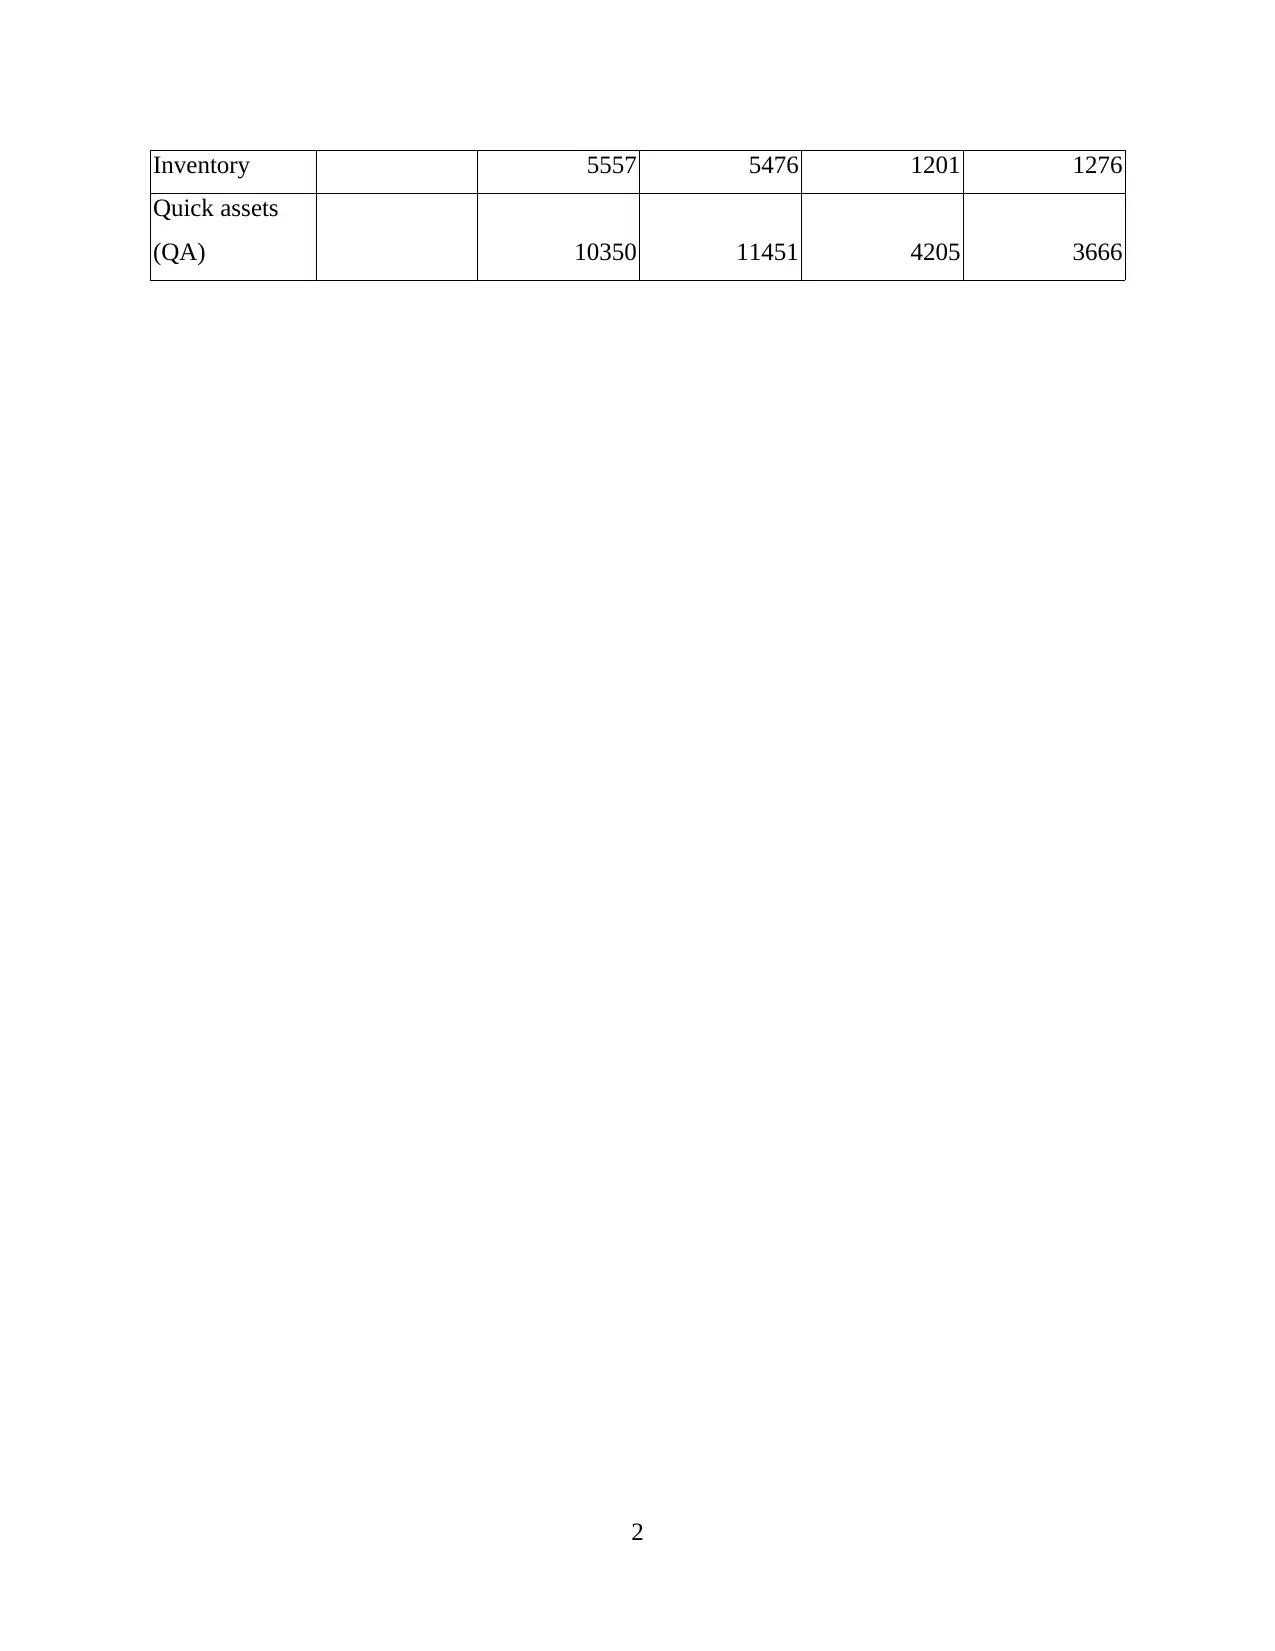
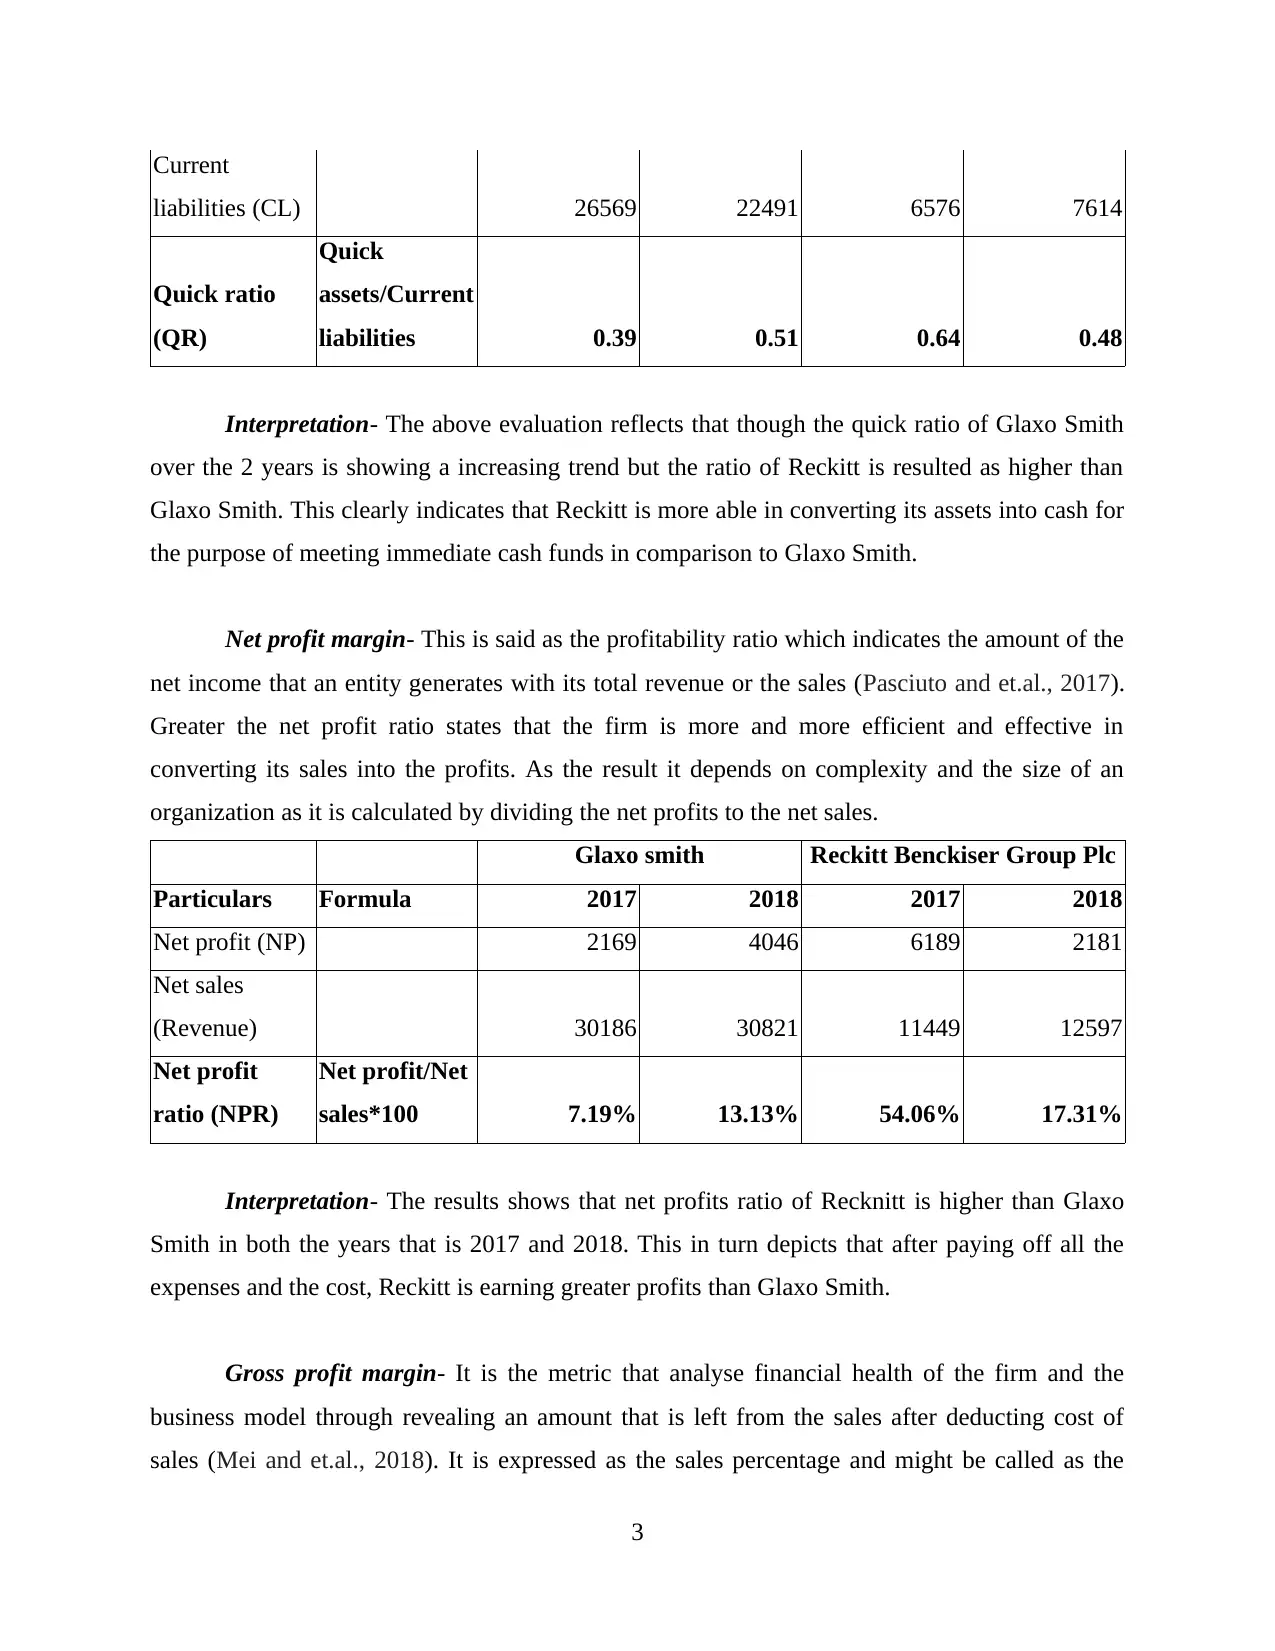
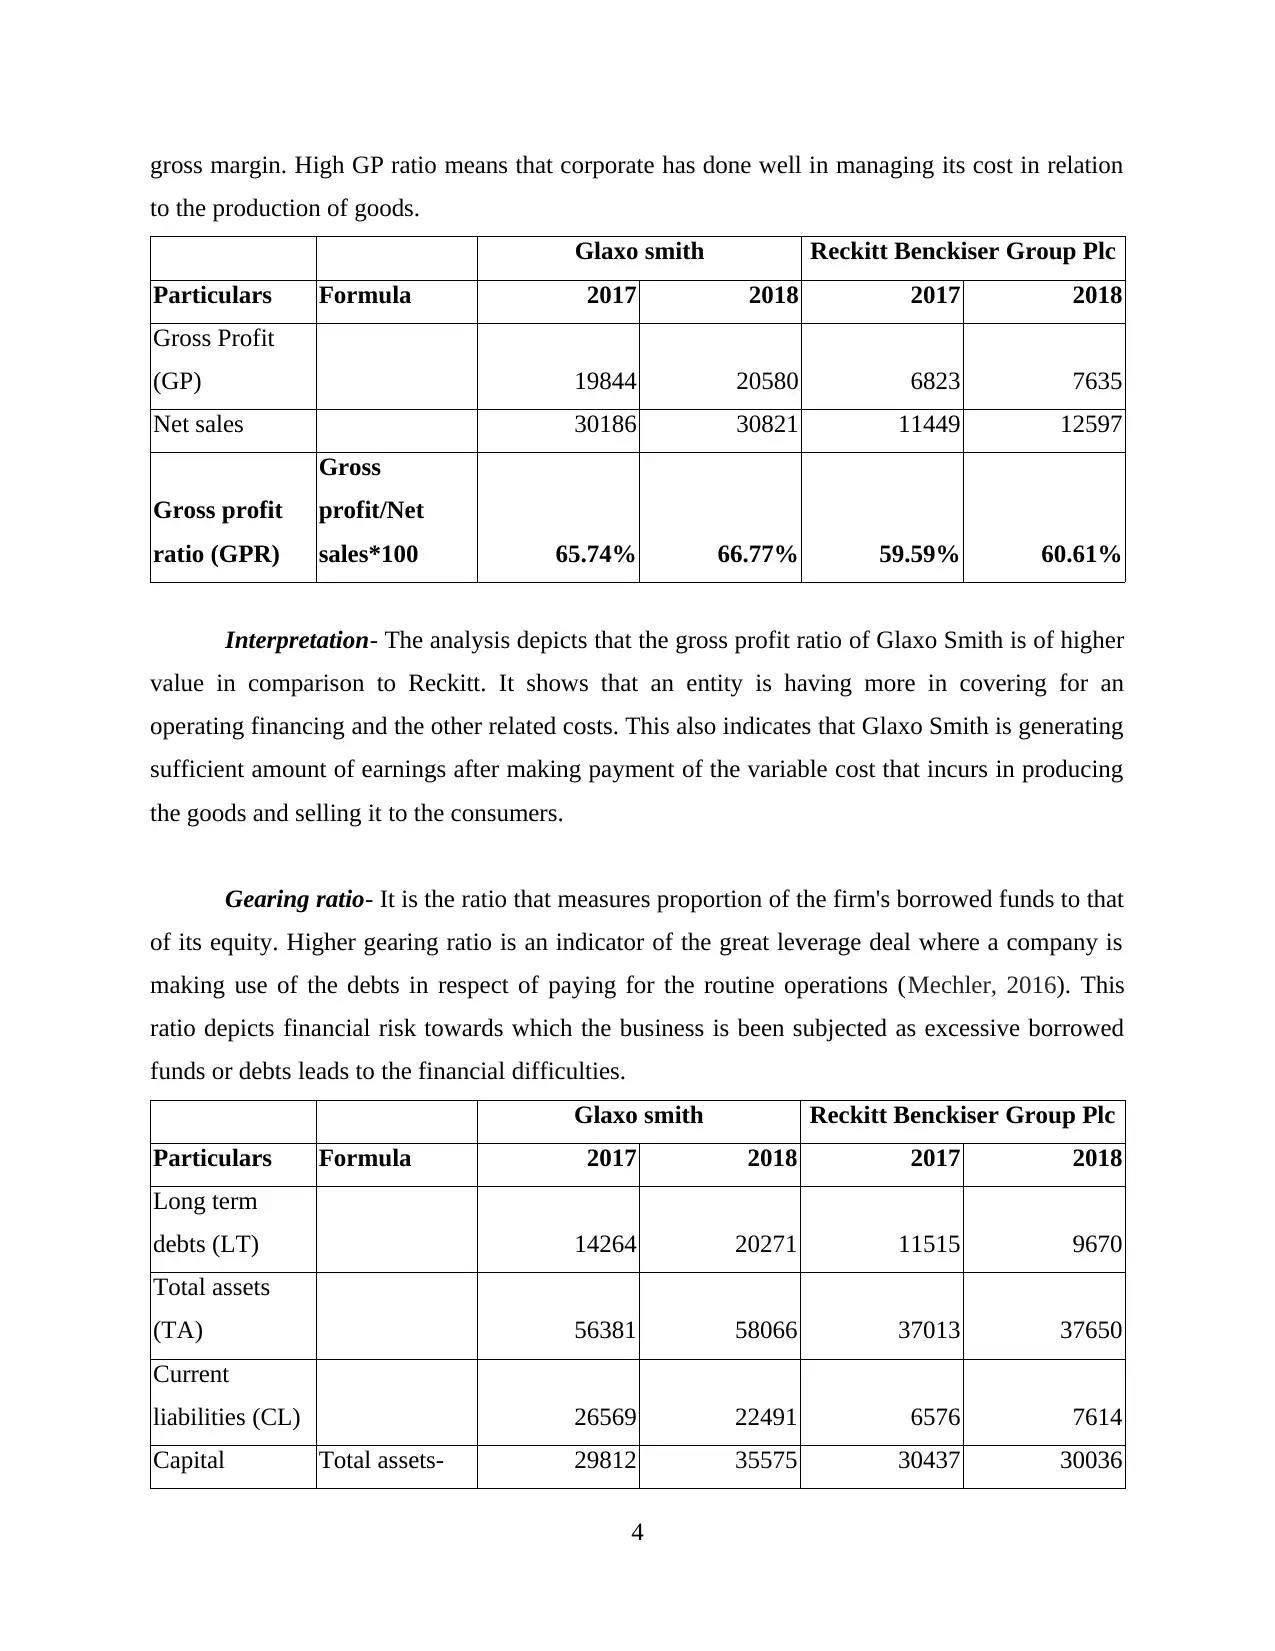
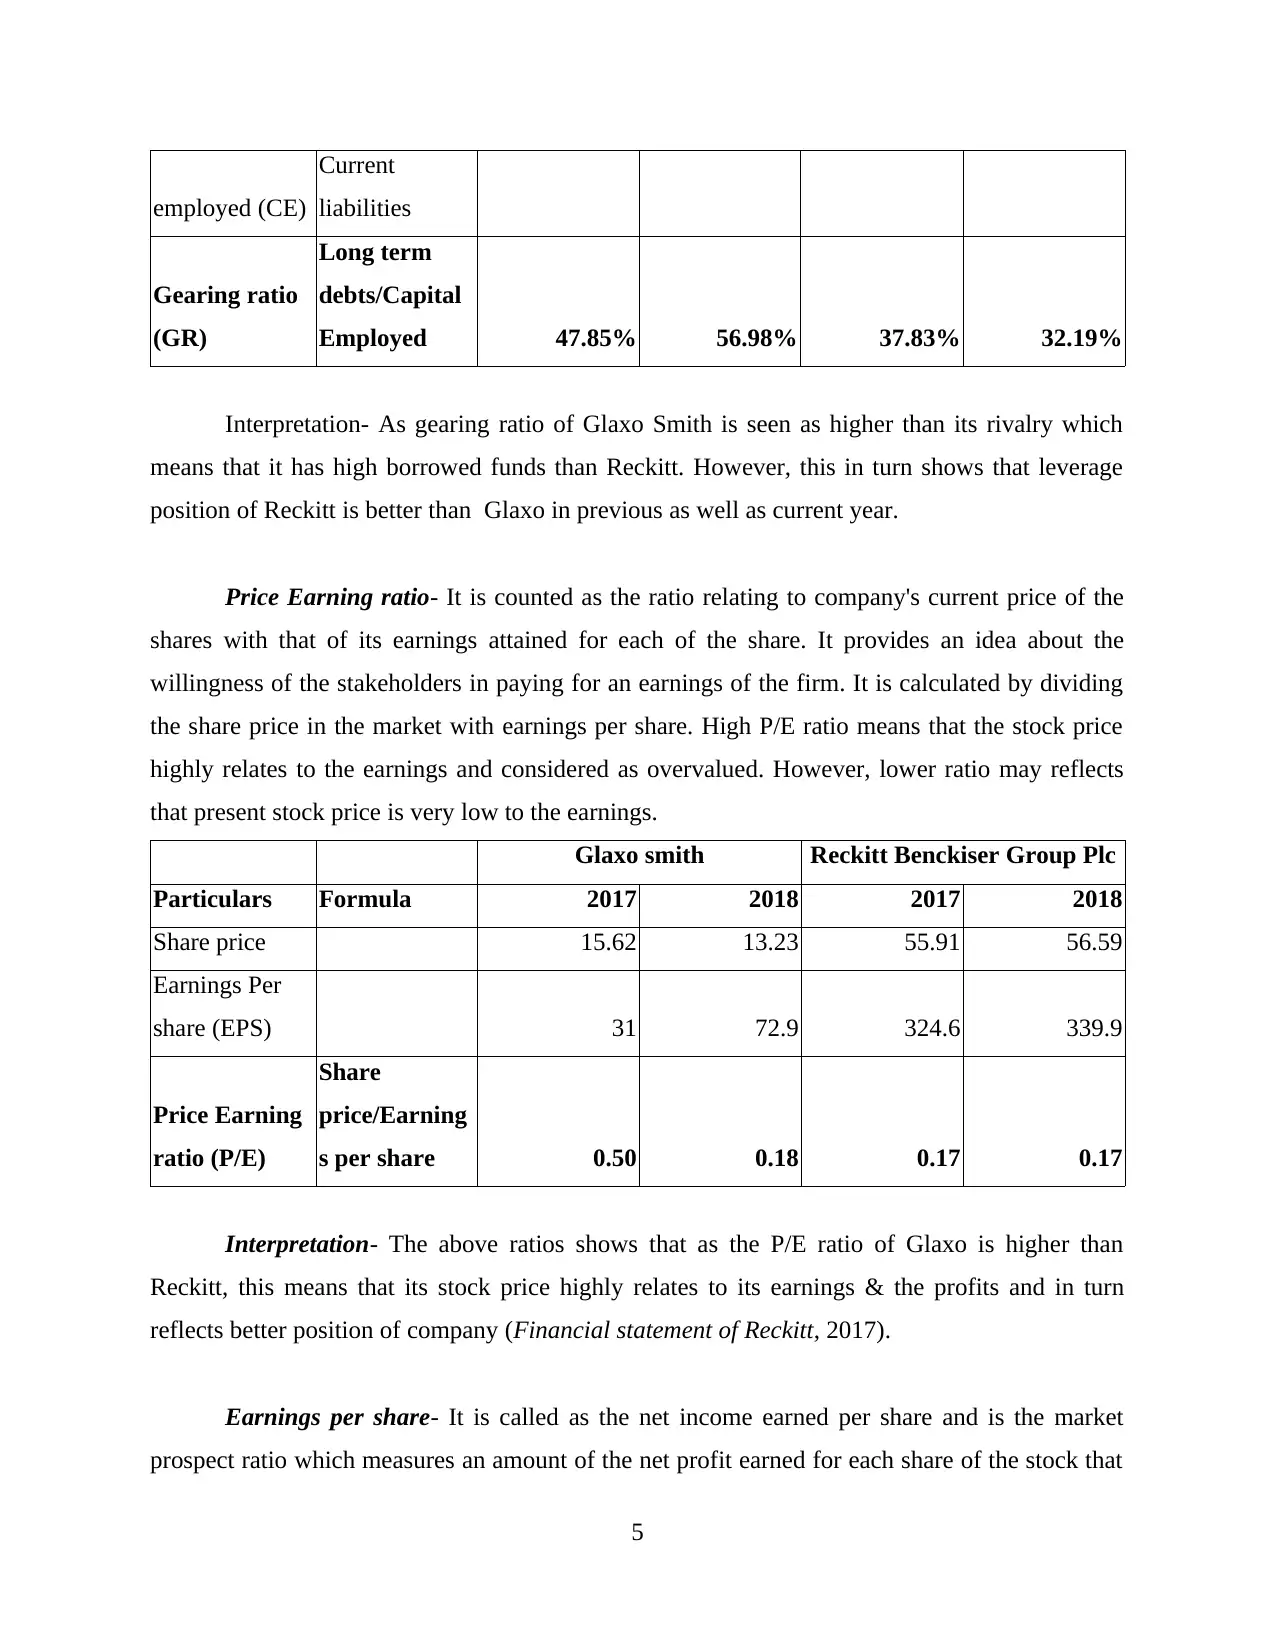
This report presents a detailed financial analysis of Glaxo Smith and Reckitt Benckiser, focusing on the computation and interpretation of various financial ratios. The analysis includes the calculation of current ratio, quick ratio, net profit margin, gross profit margin, gearing ratio, price earning ratio, earnings per share, ROCE, inventory days, and dividend payout ratio for both companies across the years 2017 and 2018. The report compares the financial performance and position of the two firms based on these ratios, highlighting trends and differences in their financial health and efficiency. Furthermore, the report offers suggestions on how each firm could improve its financial performance, addressing areas such as liquidity, profitability, leverage, and efficiency. Finally, the report acknowledges the limitations of using financial ratios for comprehensive financial analysis.

Financial Marketing
Paraphrase This Document
Need a fresh take? Get an instant paraphrase of this document with our AI Paraphraser

Table of Contents
Portfolio 1........................................................................................................................................3
a. Computation of the financial ratios .........................................................................................3
b. Analysing the financial performance and position of the 2 firms ...........................................1
c. Suggestion regarding the ways that the firm should adopt to improve its performance .........7
d. Limitation of financial ratios ..................................................................................................7
Portfolio 2........................................................................................................................................8
a. Recommending the profitable project for the company ..........................................................8
b. Limitations of an investment appraisal tool ..........................................................................12
REFERENCES..............................................................................................................................14

Portfolio 1
a. Computation of the financial ratios
⊘ This is a preview!⊘
Do you want full access?
Subscribe today to unlock all pages.

Trusted by 1+ million students worldwide

Paraphrase This Document
Need a fresh take? Get an instant paraphrase of this document with our AI Paraphraser


⊘ This is a preview!⊘
Do you want full access?
Subscribe today to unlock all pages.

Trusted by 1+ million students worldwide

1
Paraphrase This Document
Need a fresh take? Get an instant paraphrase of this document with our AI Paraphraser

b. Analysing the financial performance and position of the 2 firms
Current ratio- It is referred as the popular tool in evaluating the current solvency position
of an enterprise. It is computed by dividing the current assets with that of the current liability. It
measures the firms' capability in meeting its short term liabilities by making use of its current
assets effectively (Griffin and et.al., 2016). The ideal current ratio is stated as 2:1 which means
that current assets must be doubled the current liability. Therefore. Higher ratio shows better
liquid state of the company while lower ratio is seen as ineffective use of the short term funds.
Glaxo smith Reckitt Benckiser Group Plc
Particulars Formula 2017 2018 2017 2018
Current assets
(CA) 15907 16927 5406 4942
Current
liabilities (CL) 26569 22491 6576 7614
Current ratio
(CR)
Current
assets/Current
liabilities 0.60 0.75 0.82 0.65
Interpretation- from the above assessment, it has been analysed that the current ratio of
Glaxo smith is increasing over the 2 years as compared to Reckitt. This means that Glaxo Smith
is making optimum use of its current assets than its competitor and depicts that it is having
sufficient cash in paying off its current debts.
Quick ratio- It is been considered as the more conservative outlook than current ratio that
involves current assets over the current liabilities (Hancock and Kent, 2016). Higher ratio results
in the better liquidity and the financial health of the company whereas lower the value of ratio,
more likely an entity struggles in paying the debts.
Glaxo smith Reckitt Benckiser Group Plc
Particulars Formula 2017 2018 2017 2018
Current assets
(CA) 15907 16927 5406 4942

Inventory 5557 5476 1201 1276
Quick assets
(QA) 10350 11451 4205 3666
2
Quick assets
(QA) 10350 11451 4205 3666
2
⊘ This is a preview!⊘
Do you want full access?
Subscribe today to unlock all pages.

Trusted by 1+ million students worldwide

Current
liabilities (CL) 26569 22491 6576 7614
Quick ratio
(QR)
Quick
assets/Current
liabilities 0.39 0.51 0.64 0.48
Interpretation- The above evaluation reflects that though the quick ratio of Glaxo Smith
over the 2 years is showing a increasing trend but the ratio of Reckitt is resulted as higher than
Glaxo Smith. This clearly indicates that Reckitt is more able in converting its assets into cash for
the purpose of meeting immediate cash funds in comparison to Glaxo Smith.
Net profit margin- This is said as the profitability ratio which indicates the amount of the
net income that an entity generates with its total revenue or the sales (Pasciuto and et.al., 2017).
Greater the net profit ratio states that the firm is more and more efficient and effective in
converting its sales into the profits. As the result it depends on complexity and the size of an
organization as it is calculated by dividing the net profits to the net sales.
Glaxo smith Reckitt Benckiser Group Plc
Particulars Formula 2017 2018 2017 2018
Net profit (NP) 2169 4046 6189 2181
Net sales
(Revenue) 30186 30821 11449 12597
Net profit
ratio (NPR)
Net profit/Net
sales*100 7.19% 13.13% 54.06% 17.31%
Interpretation- The results shows that net profits ratio of Recknitt is higher than Glaxo
Smith in both the years that is 2017 and 2018. This in turn depicts that after paying off all the
expenses and the cost, Reckitt is earning greater profits than Glaxo Smith.
Gross profit margin- It is the metric that analyse financial health of the firm and the
business model through revealing an amount that is left from the sales after deducting cost of
sales (Mei and et.al., 2018). It is expressed as the sales percentage and might be called as the
3
Paraphrase This Document
Need a fresh take? Get an instant paraphrase of this document with our AI Paraphraser

gross margin. High GP ratio means that corporate has done well in managing its cost in relation
to the production of goods.
Glaxo smith Reckitt Benckiser Group Plc
Particulars Formula 2017 2018 2017 2018
Gross Profit
(GP) 19844 20580 6823 7635
Net sales 30186 30821 11449 12597
Gross profit
ratio (GPR)
Gross
profit/Net
sales*100 65.74% 66.77% 59.59% 60.61%
Interpretation- The analysis depicts that the gross profit ratio of Glaxo Smith is of higher
value in comparison to Reckitt. It shows that an entity is having more in covering for an
operating financing and the other related costs. This also indicates that Glaxo Smith is generating
sufficient amount of earnings after making payment of the variable cost that incurs in producing
the goods and selling it to the consumers.
Gearing ratio- It is the ratio that measures proportion of the firm's borrowed funds to that
of its equity. Higher gearing ratio is an indicator of the great leverage deal where a company is
making use of the debts in respect of paying for the routine operations (Mechler, 2016). This
ratio depicts financial risk towards which the business is been subjected as excessive borrowed
funds or debts leads to the financial difficulties.
Glaxo smith Reckitt Benckiser Group Plc
Particulars Formula 2017 2018 2017 2018
Long term
debts (LT) 14264 20271 11515 9670
Total assets
(TA) 56381 58066 37013 37650
Current
liabilities (CL) 26569 22491 6576 7614
Capital Total assets- 29812 35575 30437 30036
4

employed (CE)
Current
liabilities
Gearing ratio
(GR)
Long term
debts/Capital
Employed 47.85% 56.98% 37.83% 32.19%
Interpretation- As gearing ratio of Glaxo Smith is seen as higher than its rivalry which
means that it has high borrowed funds than Reckitt. However, this in turn shows that leverage
position of Reckitt is better than Glaxo in previous as well as current year.
Price Earning ratio- It is counted as the ratio relating to company's current price of the
shares with that of its earnings attained for each of the share. It provides an idea about the
willingness of the stakeholders in paying for an earnings of the firm. It is calculated by dividing
the share price in the market with earnings per share. High P/E ratio means that the stock price
highly relates to the earnings and considered as overvalued. However, lower ratio may reflects
that present stock price is very low to the earnings.
Glaxo smith Reckitt Benckiser Group Plc
Particulars Formula 2017 2018 2017 2018
Share price 15.62 13.23 55.91 56.59
Earnings Per
share (EPS) 31 72.9 324.6 339.9
Price Earning
ratio (P/E)
Share
price/Earning
s per share 0.50 0.18 0.17 0.17
Interpretation- The above ratios shows that as the P/E ratio of Glaxo is higher than
Reckitt, this means that its stock price highly relates to its earnings & the profits and in turn
reflects better position of company (Financial statement of Reckitt, 2017).
Earnings per share- It is called as the net income earned per share and is the market
prospect ratio which measures an amount of the net profit earned for each share of the stock that
5
⊘ This is a preview!⊘
Do you want full access?
Subscribe today to unlock all pages.

Trusted by 1+ million students worldwide
1 out of 24
Related Documents

Your All-in-One AI-Powered Toolkit for Academic Success.
 +13062052269
info@desklib.com
Available 24*7 on WhatsApp / Email
Unlock your academic potential
© 2024  |  Zucol Services PVT LTD  |  All rights reserved.