Finance for Business: Company Financial Performance Analysis Report
VerifiedAdded on 2022/10/16
|5
|877
|4
Report
AI Summary
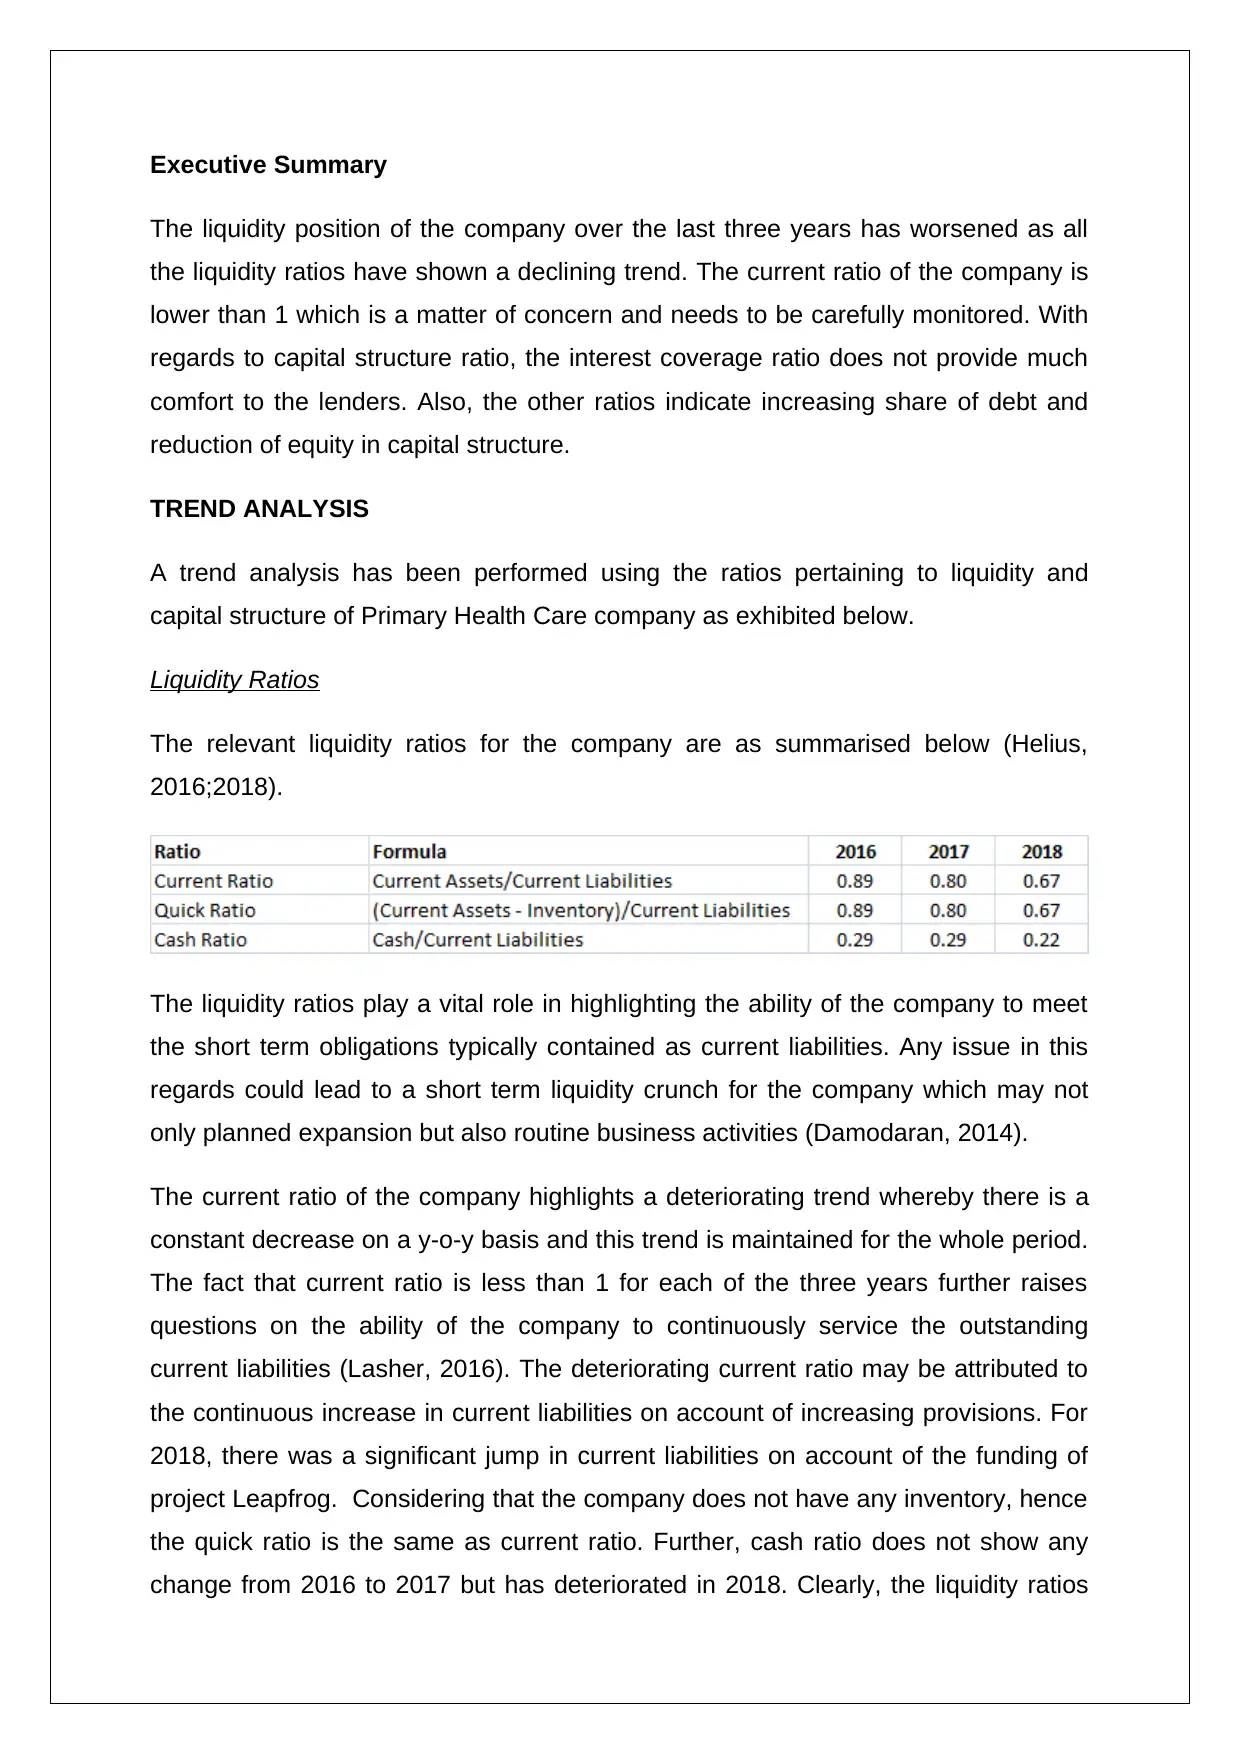
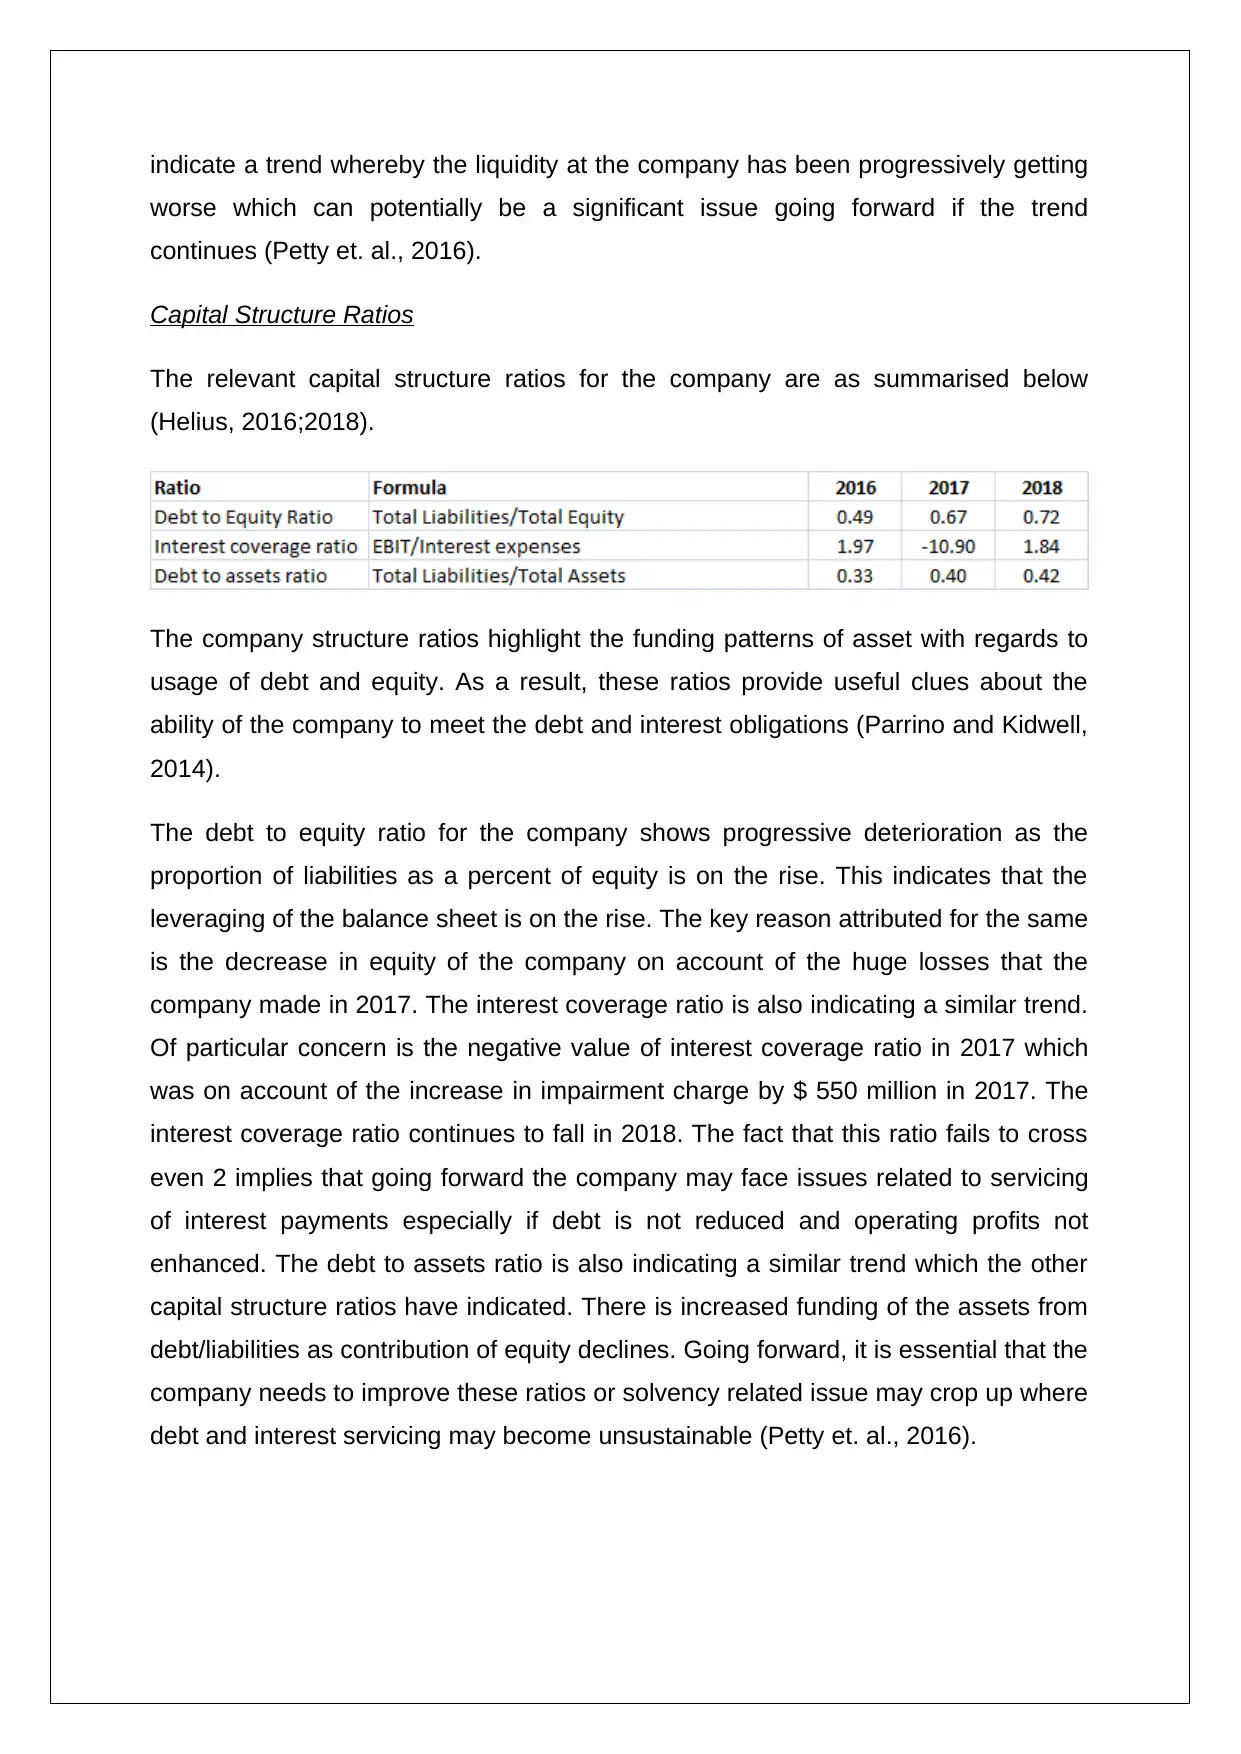
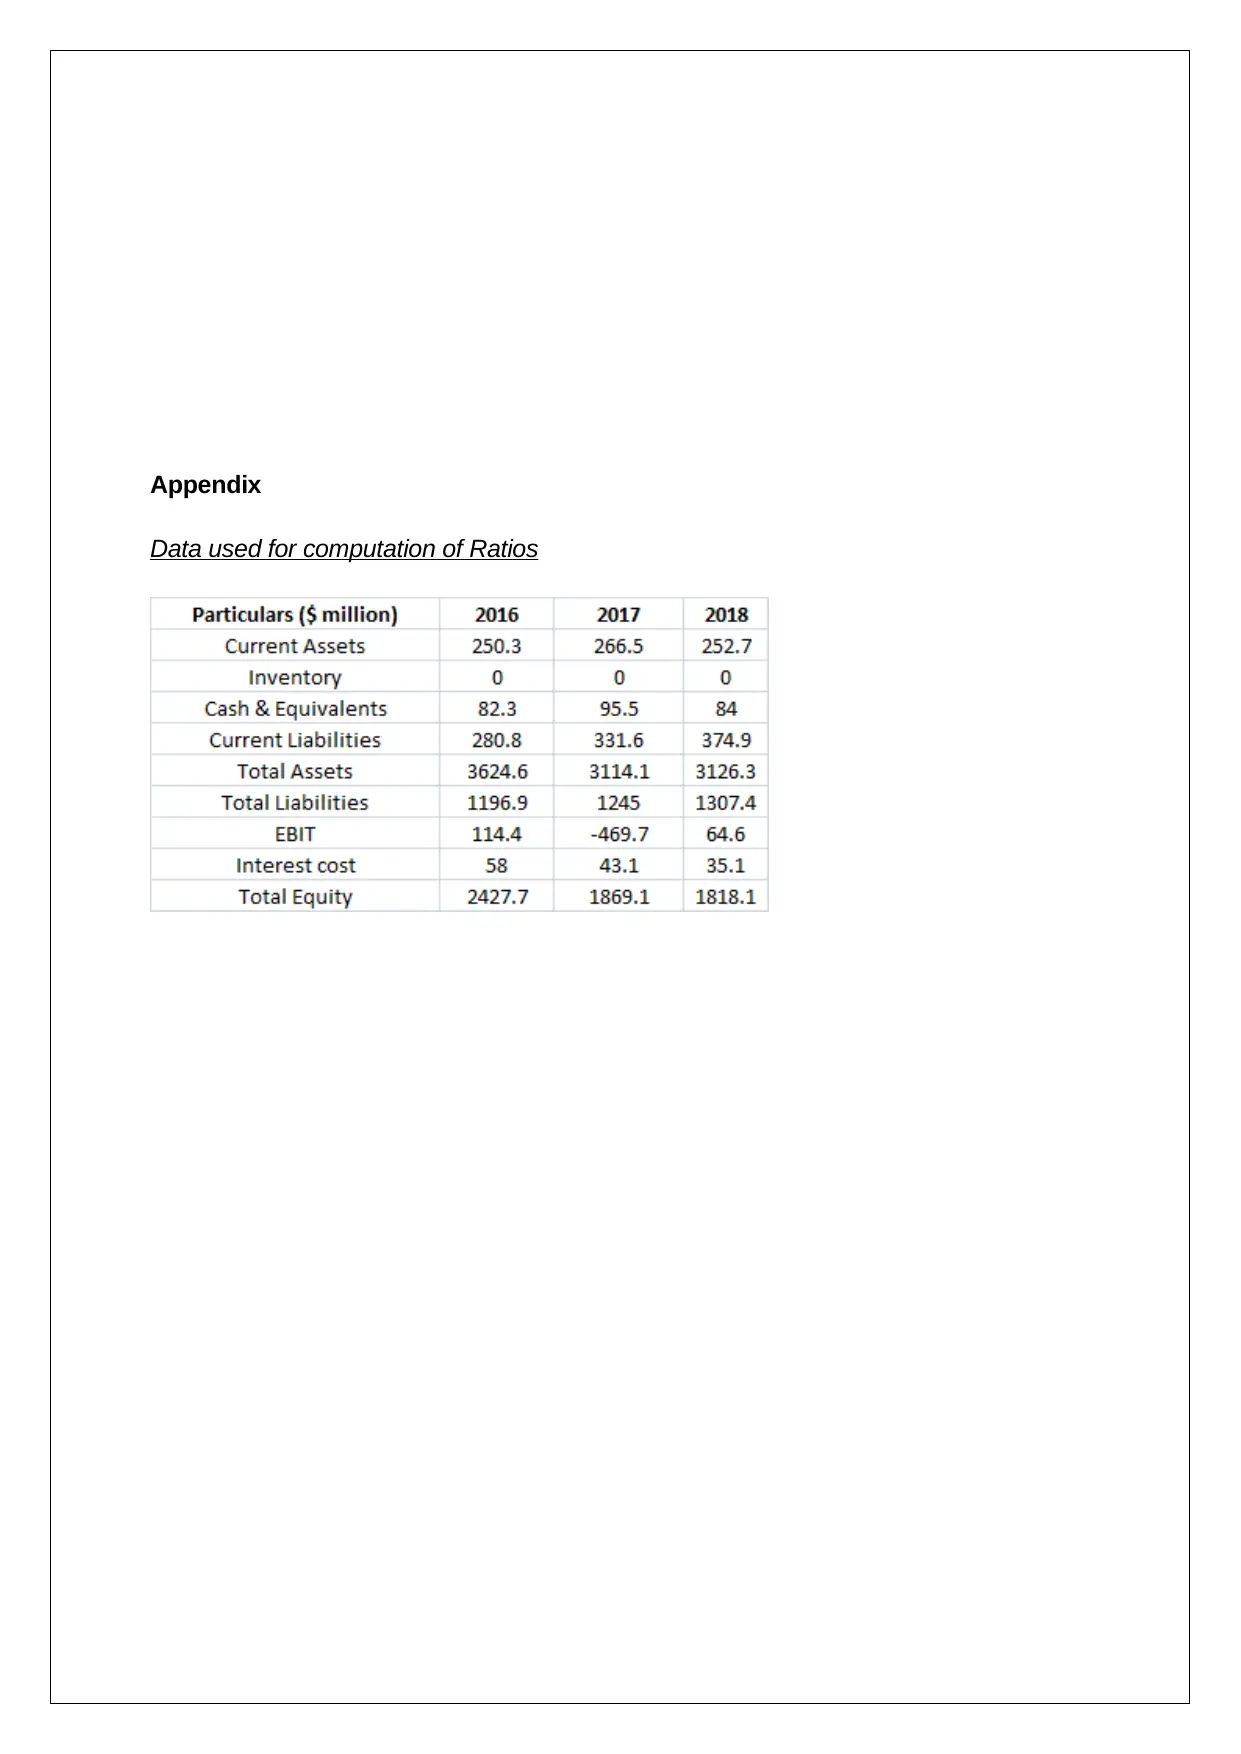
This finance report provides an in-depth analysis of a company's financial performance over a three-year period, focusing on liquidity and capital structure. The executive summary highlights a worsening liquidity position, with declining current and quick ratios, indicating potential short-term financia...
Read More
Contribute Materials
Your contribution can guide someone’s learning journey. Share your
documents today.

FINANCE FOR BUSINESS
STUDENT ID:
[Pick the date]
STUDENT ID:
[Pick the date]
Secure Best Marks with AI Grader
Need help grading? Try our AI Grader for instant feedback on your assignments.

Executive Summary
The liquidity position of the company over the last three years has worsened as all
the liquidity ratios have shown a declining trend. The current ratio of the company is
lower than 1 which is a matter of concern and needs to be carefully monitored. With
regards to capital structure ratio, the interest coverage ratio does not provide much
comfort to the lenders. Also, the other ratios indicate increasing share of debt and
reduction of equity in capital structure.
TREND ANALYSIS
A trend analysis has been performed using the ratios pertaining to liquidity and
capital structure of Primary Health Care company as exhibited below.
Liquidity Ratios
The relevant liquidity ratios for the company are as summarised below (Helius,
2016;2018).
The liquidity ratios play a vital role in highlighting the ability of the company to meet
the short term obligations typically contained as current liabilities. Any issue in this
regards could lead to a short term liquidity crunch for the company which may not
only planned expansion but also routine business activities (Damodaran, 2014).
The current ratio of the company highlights a deteriorating trend whereby there is a
constant decrease on a y-o-y basis and this trend is maintained for the whole period.
The fact that current ratio is less than 1 for each of the three years further raises
questions on the ability of the company to continuously service the outstanding
current liabilities (Lasher, 2016). The deteriorating current ratio may be attributed to
the continuous increase in current liabilities on account of increasing provisions. For
2018, there was a significant jump in current liabilities on account of the funding of
project Leapfrog. Considering that the company does not have any inventory, hence
the quick ratio is the same as current ratio. Further, cash ratio does not show any
change from 2016 to 2017 but has deteriorated in 2018. Clearly, the liquidity ratios

indicate a trend whereby the liquidity at the company has been progressively getting
worse which can potentially be a significant issue going forward if the trend
continues (Petty et. al., 2016).
Capital Structure Ratios
The relevant capital structure ratios for the company are as summarised below
(Helius, 2016;2018).
The company structure ratios highlight the funding patterns of asset with regards to
usage of debt and equity. As a result, these ratios provide useful clues about the
ability of the company to meet the debt and interest obligations (Parrino and Kidwell,
2014).
The debt to equity ratio for the company shows progressive deterioration as the
proportion of liabilities as a percent of equity is on the rise. This indicates that the
leveraging of the balance sheet is on the rise. The key reason attributed for the same
is the decrease in equity of the company on account of the huge losses that the
company made in 2017. The interest coverage ratio is also indicating a similar trend.
Of particular concern is the negative value of interest coverage ratio in 2017 which
was on account of the increase in impairment charge by $ 550 million in 2017. The
interest coverage ratio continues to fall in 2018. The fact that this ratio fails to cross
even 2 implies that going forward the company may face issues related to servicing
of interest payments especially if debt is not reduced and operating profits not
enhanced. The debt to assets ratio is also indicating a similar trend which the other
capital structure ratios have indicated. There is increased funding of the assets from
debt/liabilities as contribution of equity declines. Going forward, it is essential that the
company needs to improve these ratios or solvency related issue may crop up where
debt and interest servicing may become unsustainable (Petty et. al., 2016).

References
Damodaran, A. (2014) Applied corporate finance: A user’s manual, (3rd ed.) New
York: Wiley, John & Sons.
Healius (2016), Annual Report 2016, [online] Available at
https://www.healius.com.au/globalassets/corporate/pdfs/annual-reports/2016/phc-asx-
20160916-annual-report-2016.pdf [Accessed September 24 2019]
Healius (2018), Annual Report 2018, [online] Available at
https://www.healius.com.au/globalassets/corporate/pdfs/annual-reports/2018/final-2018-ar-
8545_phc_ar18_all_lr.pdf [Accessed September 24 2019]
Lasher, W. R., (2016) Practical Financial Management (5thed.). London: South-
Western College Publisher.
Parrino, R. & Kidwell, D. (2014) ,Fundamentals of Corporate Finance, (4th ed.),
London: Wiley Publications
Petty, J.W., Titman, S., Keown, A., Martin, J.D., Martin, P., Burrow, M., & Nguyen, H.
(2016). Financial Management, Principles and Applications (6thed.). NSW: Pearson
Education, French Forest Australia.
Secure Best Marks with AI Grader
Need help grading? Try our AI Grader for instant feedback on your assignments.

Appendix
Data used for computation of Ratios
1 out of 5
Related Documents

Your All-in-One AI-Powered Toolkit for Academic Success.
+13062052269
info@desklib.com
Available 24*7 on WhatsApp / Email
Unlock your academic potential
© 2024 | Zucol Services PVT LTD | All rights reserved.