Financial Performance Evaluation: Wesfarmers and Woolworths Comparison
VerifiedAdded on 2021/06/17
|20
|3688
|99
Report
AI Summary
This report presents a detailed financial analysis of Wesfarmers Limited and Woolworths Group Limited, two prominent companies in the Australian food and staples retailing industry, using financial data from the 2017 financial year. The analysis evaluates and compares the companies' performance across five key financial ratio categories: short-term solvency, long-term solvency, asset utilization, profitability, and market value. The report calculates and interprets various ratios within each category, such as current ratio, quick ratio, debt ratio, interest coverage ratio, asset turnover ratio, inventory turnover ratio, and net profit ratio, to assess their financial health and efficiency. The findings reveal a comparative performance analysis, highlighting the strengths and weaknesses of each company based on the calculated ratios, providing insights into their financial standing and operational effectiveness. The report concludes with recommendations based on the comparative analysis.
RUNNING HEAD: BUSINESS FINANCE
[Document title]
[Document title]
Paraphrase This Document
Need a fresh take? Get an instant paraphrase of this document with our AI Paraphraser
Contents
INTRODUCTION......................................................................................................................2
Company Profile....................................................................................................................2
RATIO ANALYSIS...................................................................................................................3
Short-term solvency ratios (Liquidity Ratios)........................................................................3
Long-term solvency ratios (Financial leverage ratios)...........................................................6
Asset utilisation ratios (efficiency or turnover ratios)............................................................8
Profitability ratios.................................................................................................................10
Market value ratios...............................................................................................................13
CONCLUSION and RECOMMENDATION..........................................................................15
REFERENCES.........................................................................................................................16
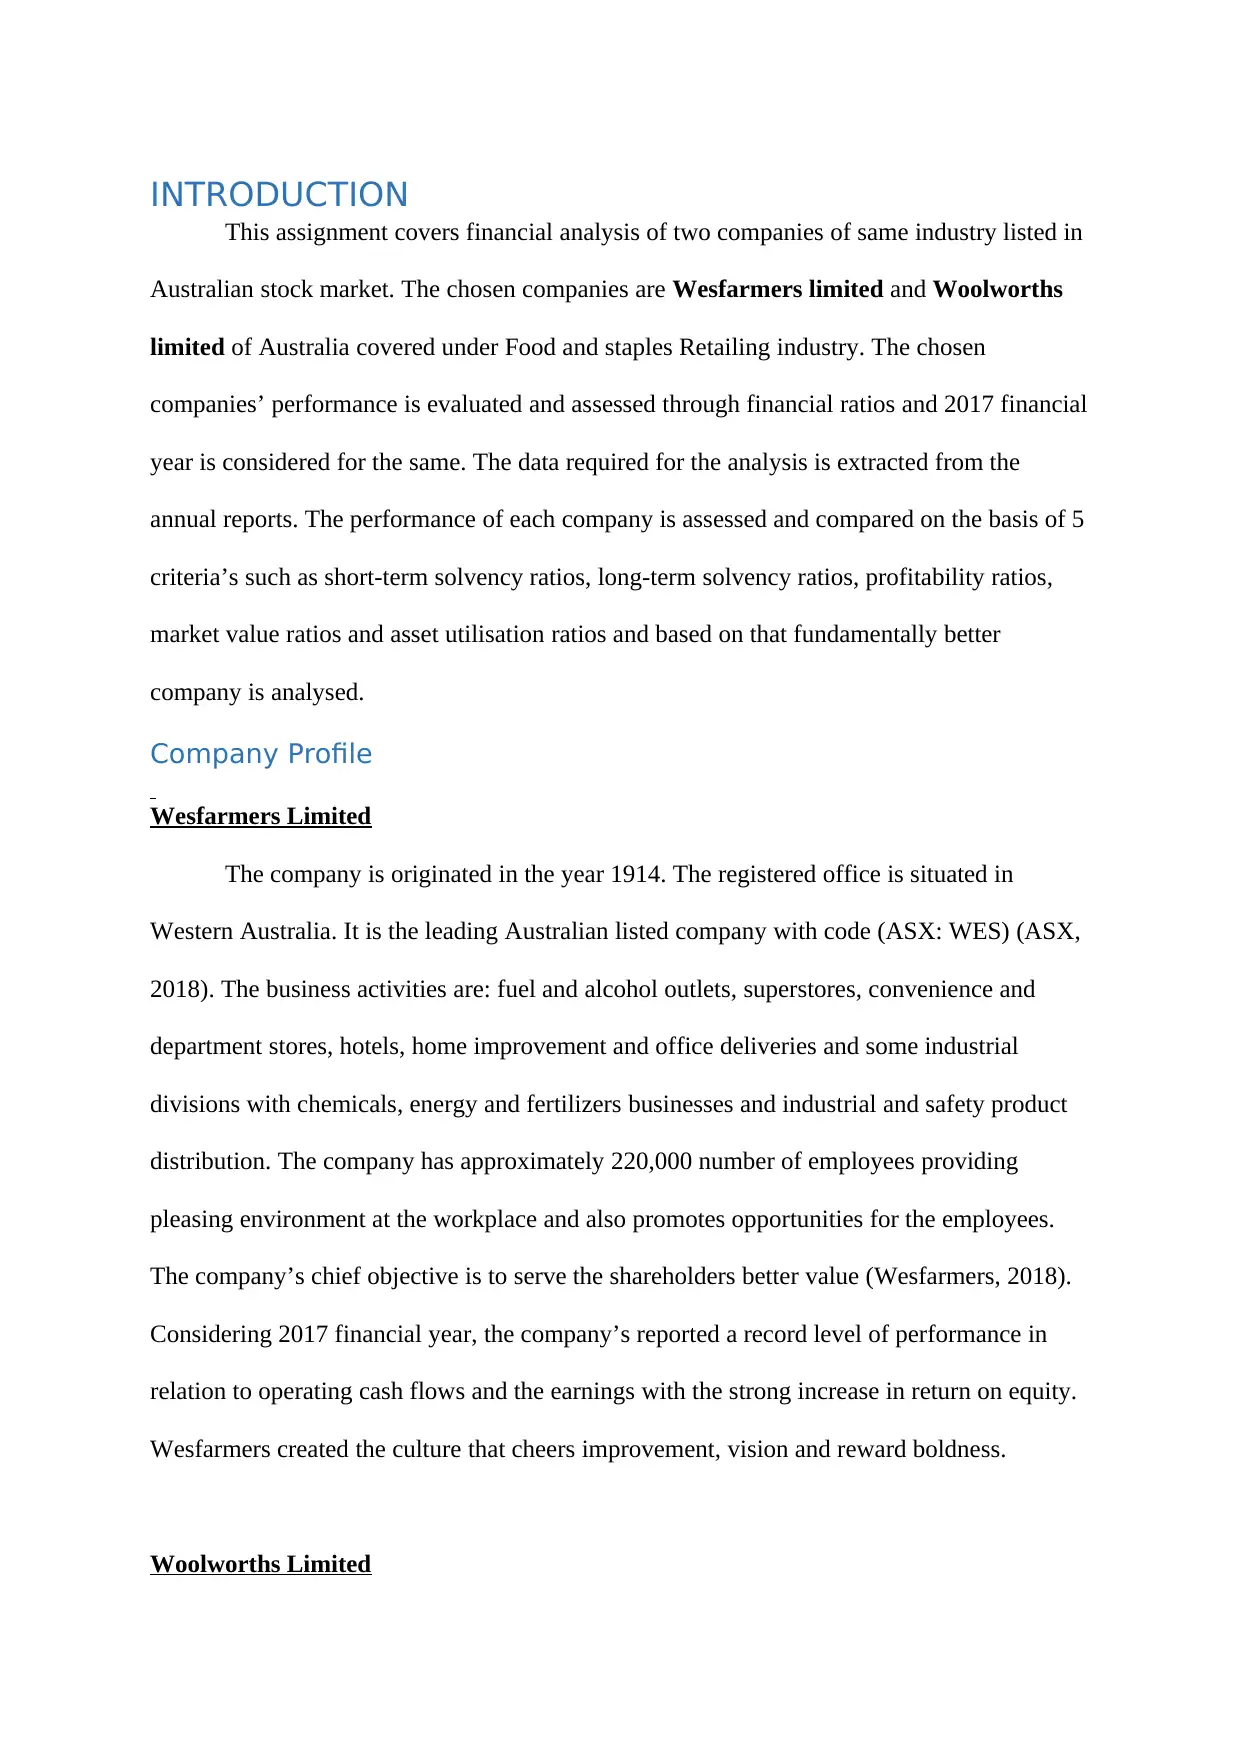
INTRODUCTION
This assignment covers financial analysis of two companies of same industry listed in
Australian stock market. The chosen companies are Wesfarmers limited and Woolworths
limited of Australia covered under Food and staples Retailing industry. The chosen
companies’ performance is evaluated and assessed through financial ratios and 2017 financial
year is considered for the same. The data required for the analysis is extracted from the
annual reports. The performance of each company is assessed and compared on the basis of 5
criteria’s such as short-term solvency ratios, long-term solvency ratios, profitability ratios,
market value ratios and asset utilisation ratios and based on that fundamentally better
company is analysed.
Company Profile
Wesfarmers Limited
The company is originated in the year 1914. The registered office is situated in
Western Australia. It is the leading Australian listed company with code (ASX: WES) (ASX,
2018). The business activities are: fuel and alcohol outlets, superstores, convenience and
department stores, hotels, home improvement and office deliveries and some industrial
divisions with chemicals, energy and fertilizers businesses and industrial and safety product
distribution. The company has approximately 220,000 number of employees providing
pleasing environment at the workplace and also promotes opportunities for the employees.
The company’s chief objective is to serve the shareholders better value (Wesfarmers, 2018).
Considering 2017 financial year, the company’s reported a record level of performance in
relation to operating cash flows and the earnings with the strong increase in return on equity.
Wesfarmers created the culture that cheers improvement, vision and reward boldness.
Woolworths Limited
⊘ This is a preview!⊘
Do you want full access?
Subscribe today to unlock all pages.
Trusted by 1+ million students worldwide
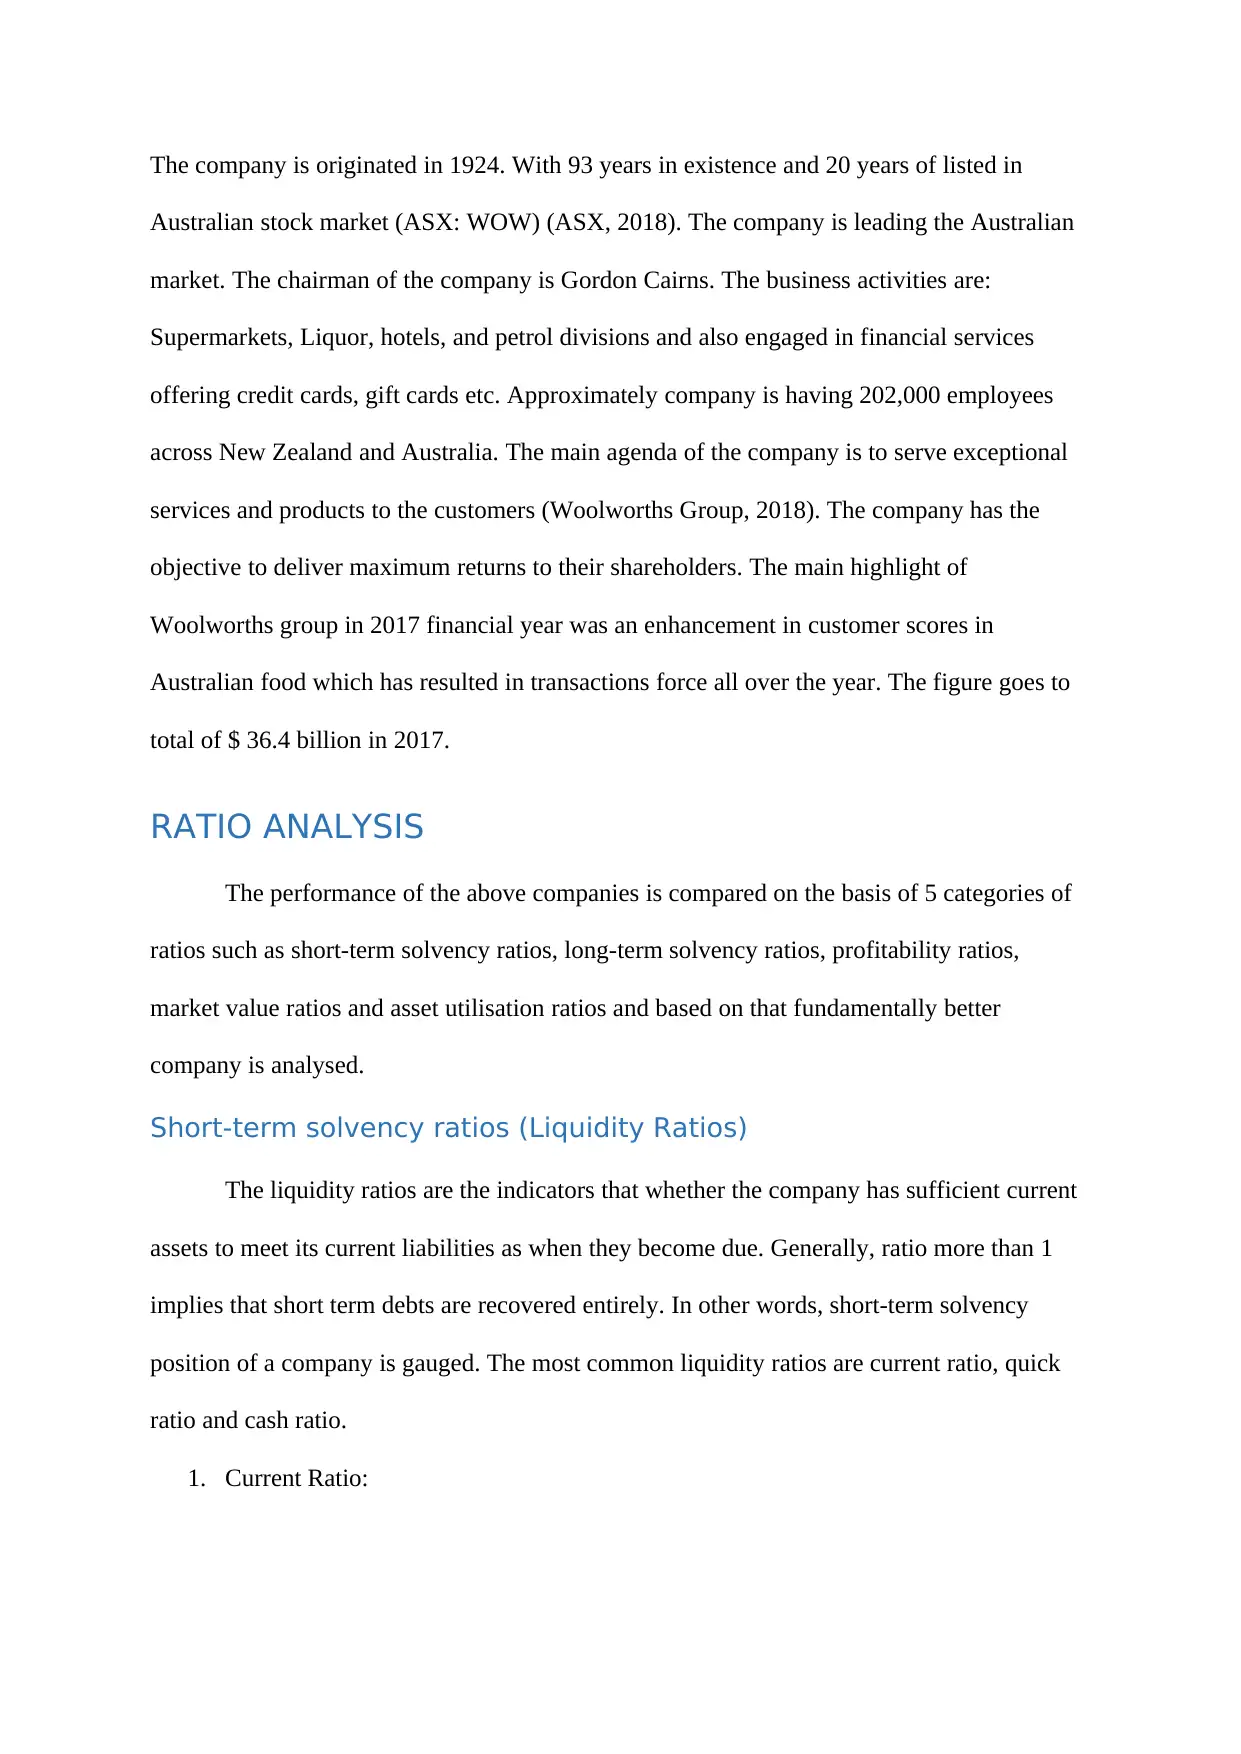
The company is originated in 1924. With 93 years in existence and 20 years of listed in
Australian stock market (ASX: WOW) (ASX, 2018). The company is leading the Australian
market. The chairman of the company is Gordon Cairns. The business activities are:
Supermarkets, Liquor, hotels, and petrol divisions and also engaged in financial services
offering credit cards, gift cards etc. Approximately company is having 202,000 employees
across New Zealand and Australia. The main agenda of the company is to serve exceptional
services and products to the customers (Woolworths Group, 2018). The company has the
objective to deliver maximum returns to their shareholders. The main highlight of
Woolworths group in 2017 financial year was an enhancement in customer scores in
Australian food which has resulted in transactions force all over the year. The figure goes to
total of $ 36.4 billion in 2017.
RATIO ANALYSIS
The performance of the above companies is compared on the basis of 5 categories of
ratios such as short-term solvency ratios, long-term solvency ratios, profitability ratios,
market value ratios and asset utilisation ratios and based on that fundamentally better
company is analysed.
Short-term solvency ratios (Liquidity Ratios)
The liquidity ratios are the indicators that whether the company has sufficient current
assets to meet its current liabilities as when they become due. Generally, ratio more than 1
implies that short term debts are recovered entirely. In other words, short-term solvency
position of a company is gauged. The most common liquidity ratios are current ratio, quick
ratio and cash ratio.
1. Current Ratio:
Paraphrase This Document
Need a fresh take? Get an instant paraphrase of this document with our AI Paraphraser
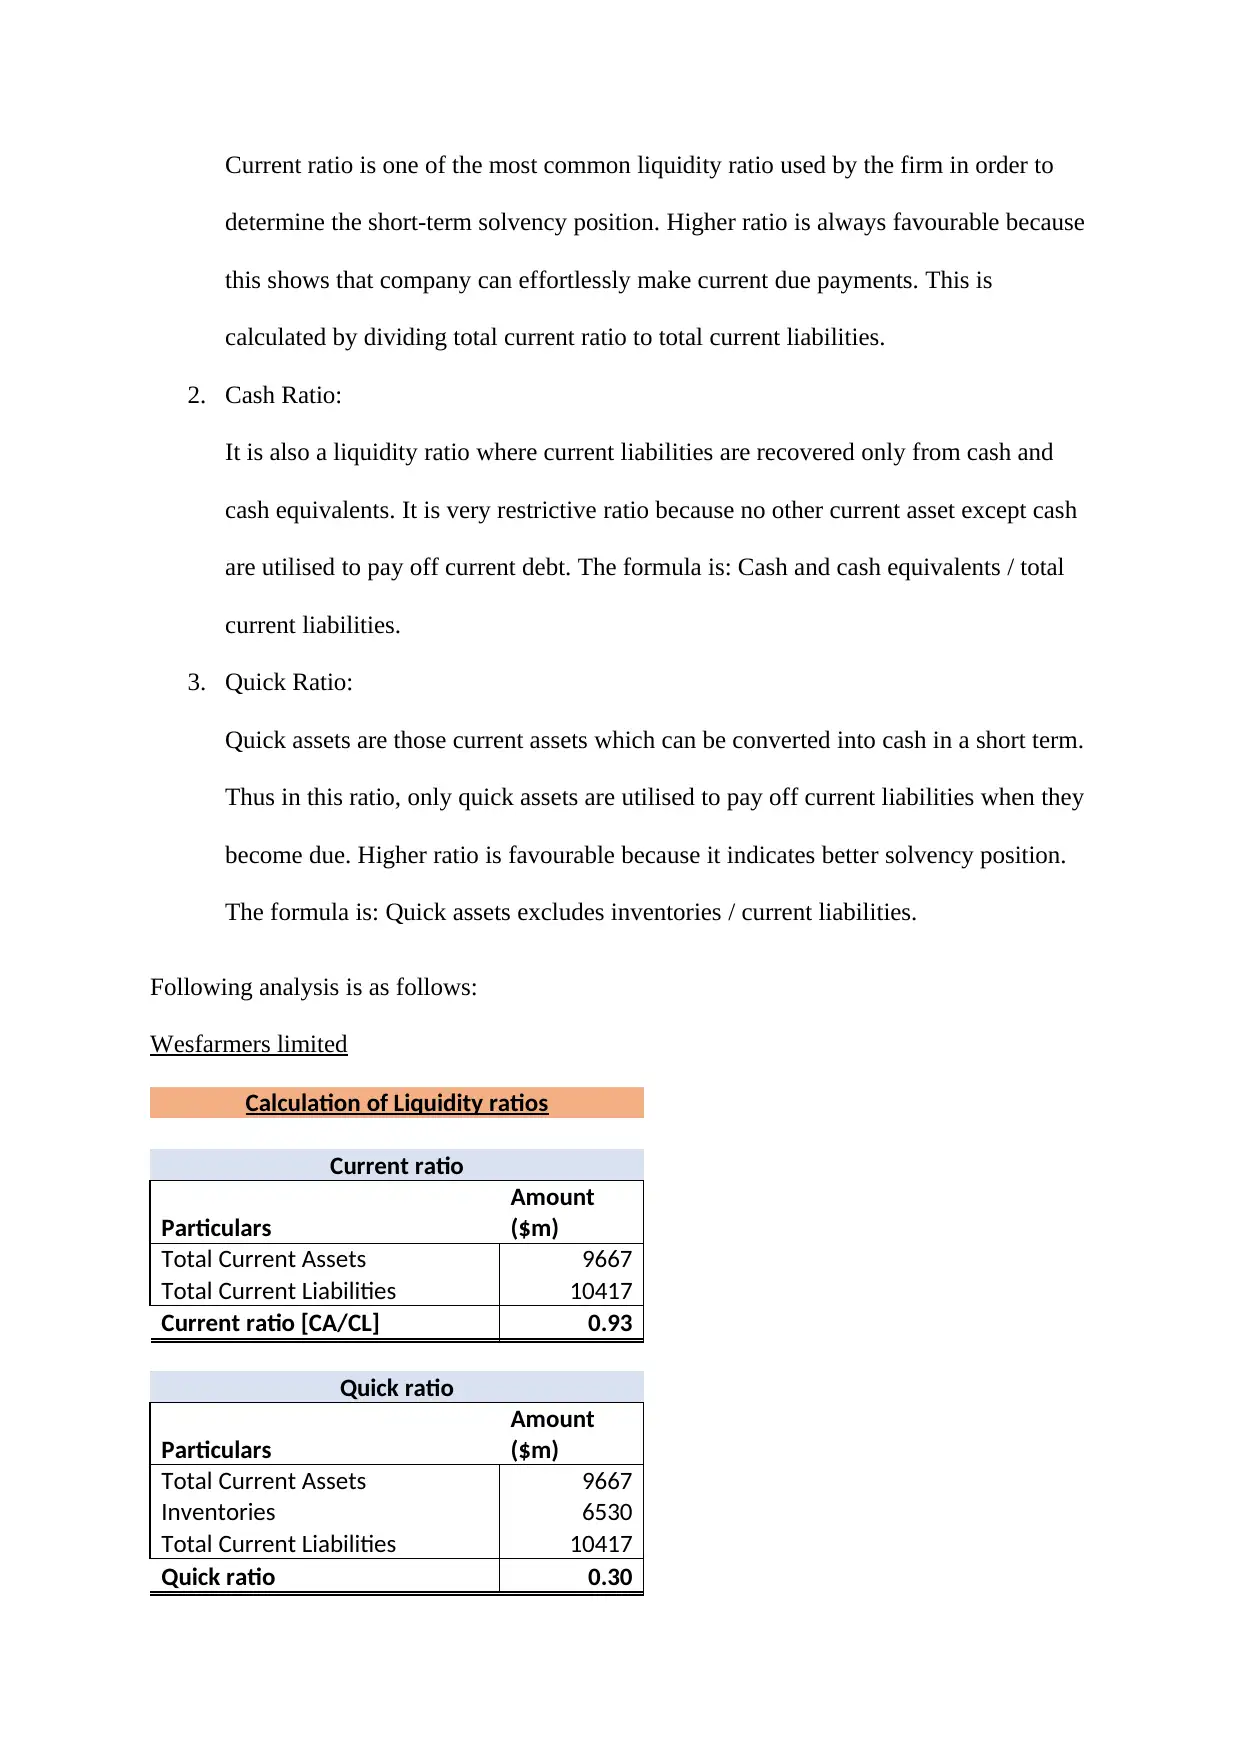
Current ratio is one of the most common liquidity ratio used by the firm in order to
determine the short-term solvency position. Higher ratio is always favourable because
this shows that company can effortlessly make current due payments. This is
calculated by dividing total current ratio to total current liabilities.
2. Cash Ratio:
It is also a liquidity ratio where current liabilities are recovered only from cash and
cash equivalents. It is very restrictive ratio because no other current asset except cash
are utilised to pay off current debt. The formula is: Cash and cash equivalents / total
current liabilities.
3. Quick Ratio:
Quick assets are those current assets which can be converted into cash in a short term.
Thus in this ratio, only quick assets are utilised to pay off current liabilities when they
become due. Higher ratio is favourable because it indicates better solvency position.
The formula is: Quick assets excludes inventories / current liabilities.
Following analysis is as follows:
Wesfarmers limited
Calculation of Liquidity ratios
Current ratio
Particulars
Amount
($m)
Total Current Assets 9667
Total Current Liabilities 10417
Current ratio [CA/CL] 0.93
Quick ratio
Particulars
Amount
($m)
Total Current Assets 9667
Inventories 6530
Total Current Liabilities 10417
Quick ratio 0.30
[(CA-inventories)/CL]
Cash ratio
Particulars
Amount
($m)
Cash and cash equivalents 1013
Total Current Liabilities 10417
Quick ratio
[(CA-inventories)/CL] 0.10
(Annual Report, 2017).
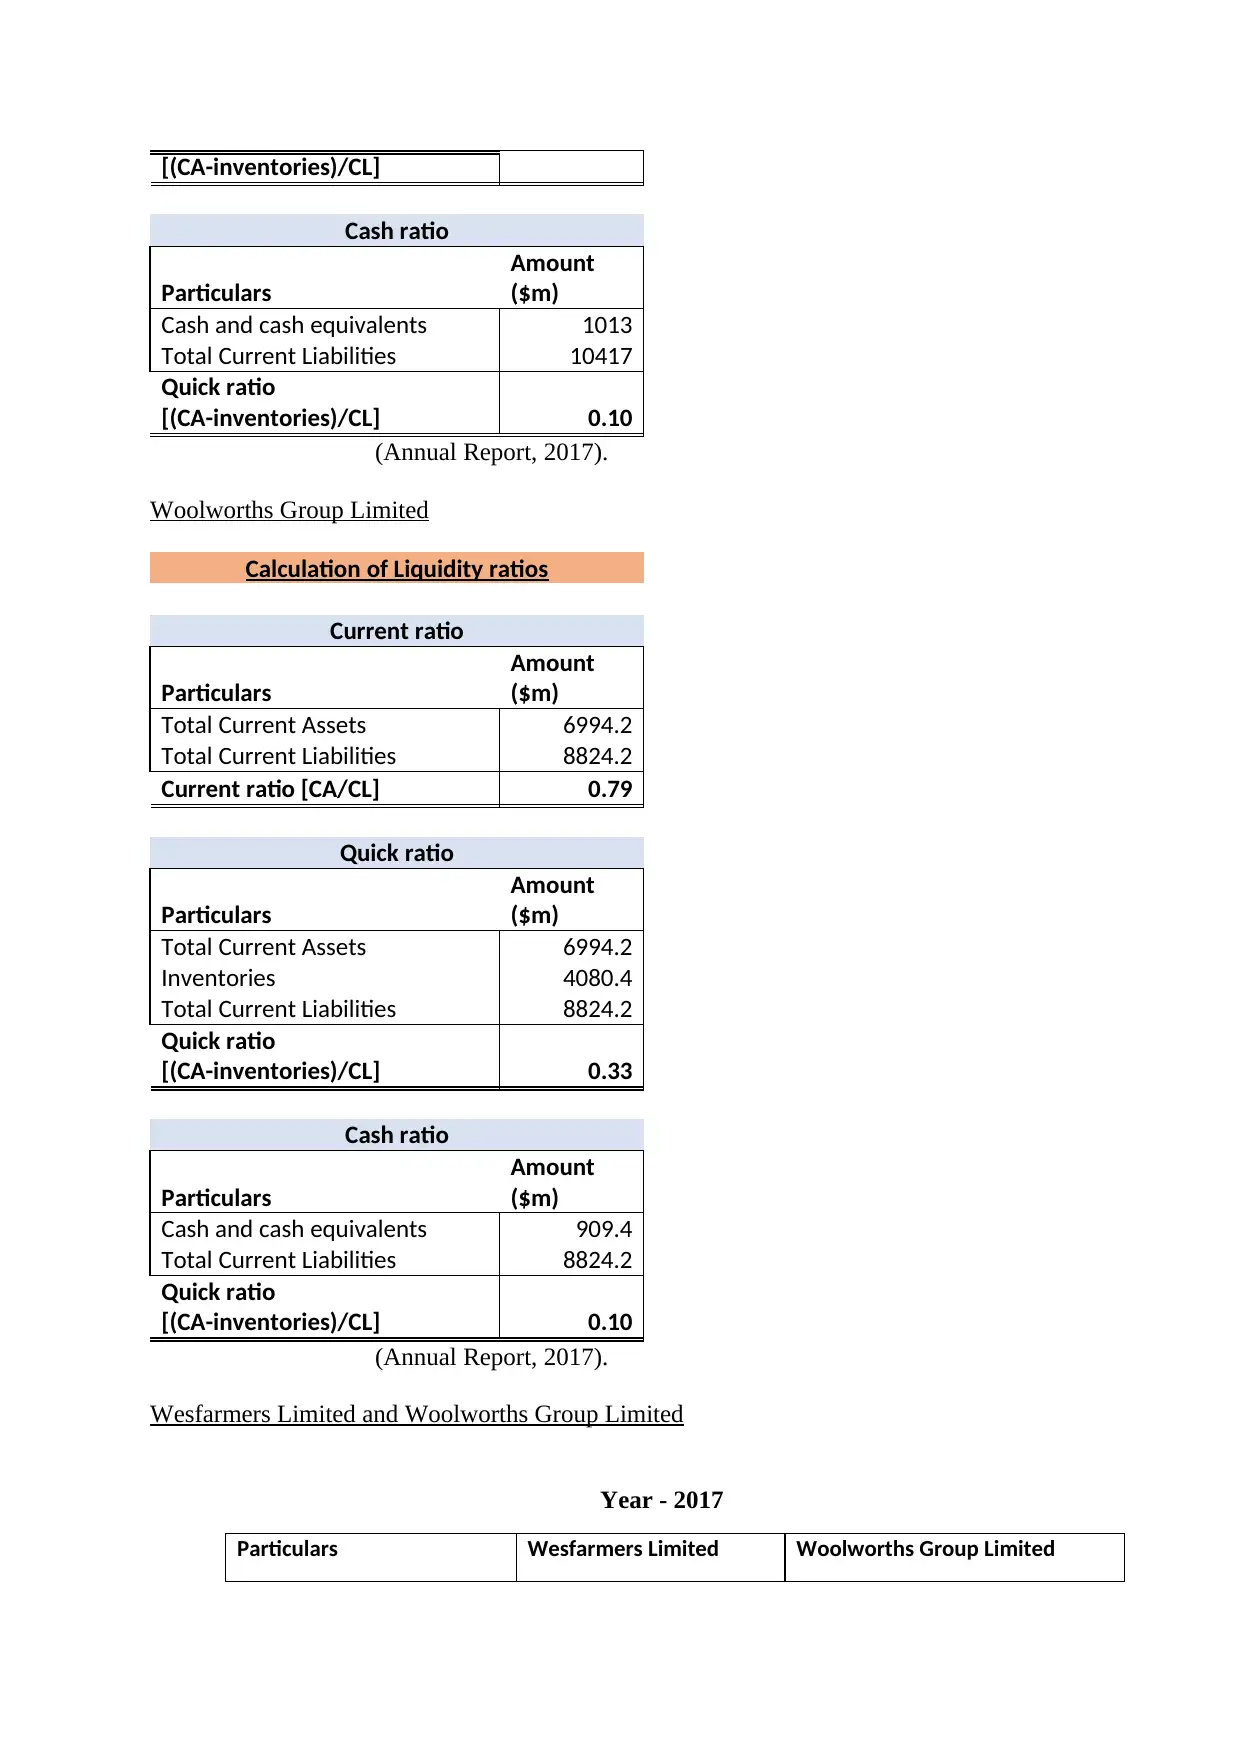
Woolworths Group Limited
Calculation of Liquidity ratios
Current ratio
Particulars
Amount
($m)
Total Current Assets 6994.2
Total Current Liabilities 8824.2
Current ratio [CA/CL] 0.79
Quick ratio
Particulars
Amount
($m)
Total Current Assets 6994.2
Inventories 4080.4
Total Current Liabilities 8824.2
Quick ratio
[(CA-inventories)/CL] 0.33
Cash ratio
Particulars
Amount
($m)
Cash and cash equivalents 909.4
Total Current Liabilities 8824.2
Quick ratio
[(CA-inventories)/CL] 0.10
(Annual Report, 2017).
Wesfarmers Limited and Woolworths Group Limited
Year - 2017
Particulars Wesfarmers Limited Woolworths Group Limited
Cash ratio
Particulars
Amount
($m)
Cash and cash equivalents 1013
Total Current Liabilities 10417
Quick ratio
[(CA-inventories)/CL] 0.10
(Annual Report, 2017).
Woolworths Group Limited
Calculation of Liquidity ratios
Current ratio
Particulars
Amount
($m)
Total Current Assets 6994.2
Total Current Liabilities 8824.2
Current ratio [CA/CL] 0.79
Quick ratio
Particulars
Amount
($m)
Total Current Assets 6994.2
Inventories 4080.4
Total Current Liabilities 8824.2
Quick ratio
[(CA-inventories)/CL] 0.33
Cash ratio
Particulars
Amount
($m)
Cash and cash equivalents 909.4
Total Current Liabilities 8824.2
Quick ratio
[(CA-inventories)/CL] 0.10
(Annual Report, 2017).
Wesfarmers Limited and Woolworths Group Limited
Year - 2017
Particulars Wesfarmers Limited Woolworths Group Limited
⊘ This is a preview!⊘
Do you want full access?
Subscribe today to unlock all pages.
Trusted by 1+ million students worldwide
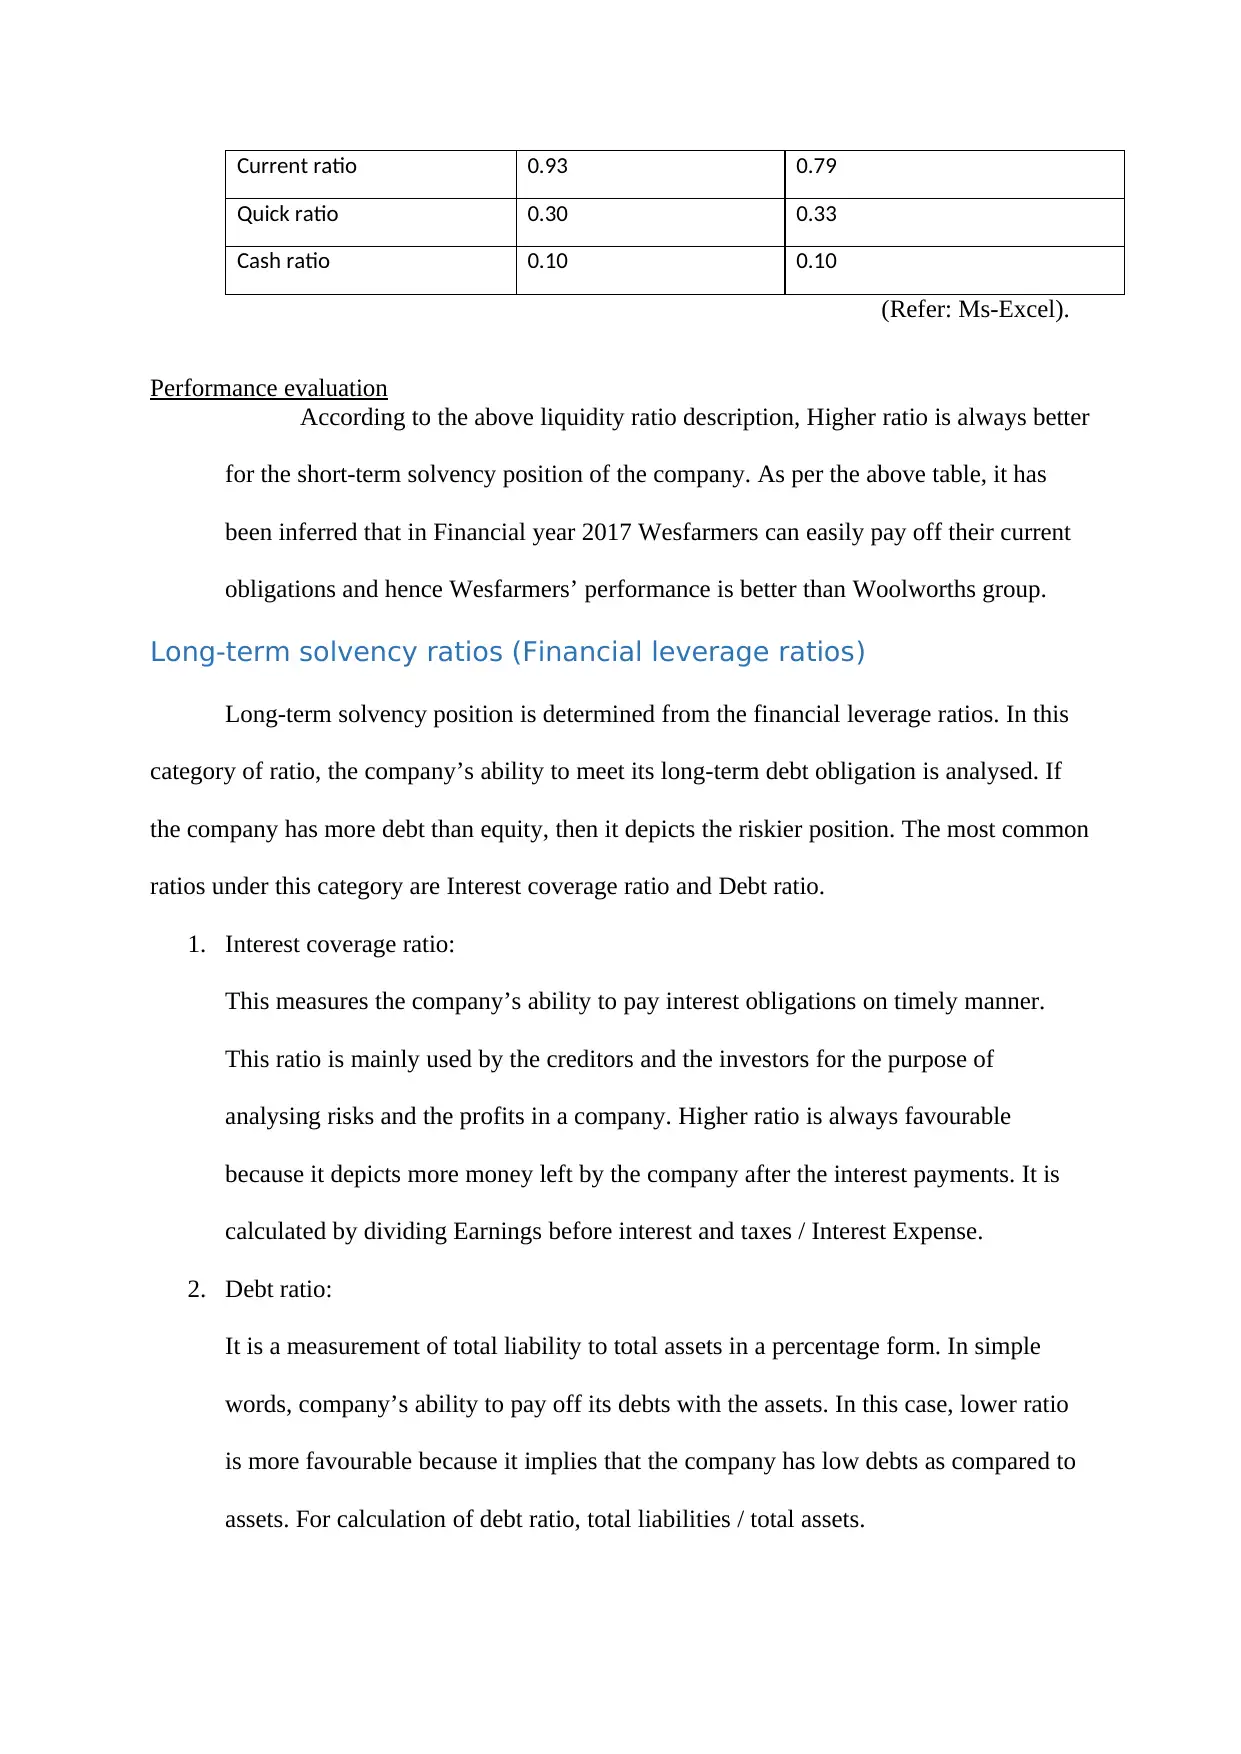
Current ratio 0.93 0.79
Quick ratio 0.30 0.33
Cash ratio 0.10 0.10
(Refer: Ms-Excel).
Performance evaluation
According to the above liquidity ratio description, Higher ratio is always better
for the short-term solvency position of the company. As per the above table, it has
been inferred that in Financial year 2017 Wesfarmers can easily pay off their current
obligations and hence Wesfarmers’ performance is better than Woolworths group.
Long-term solvency ratios (Financial leverage ratios)
Long-term solvency position is determined from the financial leverage ratios. In this
category of ratio, the company’s ability to meet its long-term debt obligation is analysed. If
the company has more debt than equity, then it depicts the riskier position. The most common
ratios under this category are Interest coverage ratio and Debt ratio.
1. Interest coverage ratio:
This measures the company’s ability to pay interest obligations on timely manner.
This ratio is mainly used by the creditors and the investors for the purpose of
analysing risks and the profits in a company. Higher ratio is always favourable
because it depicts more money left by the company after the interest payments. It is
calculated by dividing Earnings before interest and taxes / Interest Expense.
2. Debt ratio:
It is a measurement of total liability to total assets in a percentage form. In simple
words, company’s ability to pay off its debts with the assets. In this case, lower ratio
is more favourable because it implies that the company has low debts as compared to
assets. For calculation of debt ratio, total liabilities / total assets.
Paraphrase This Document
Need a fresh take? Get an instant paraphrase of this document with our AI Paraphraser
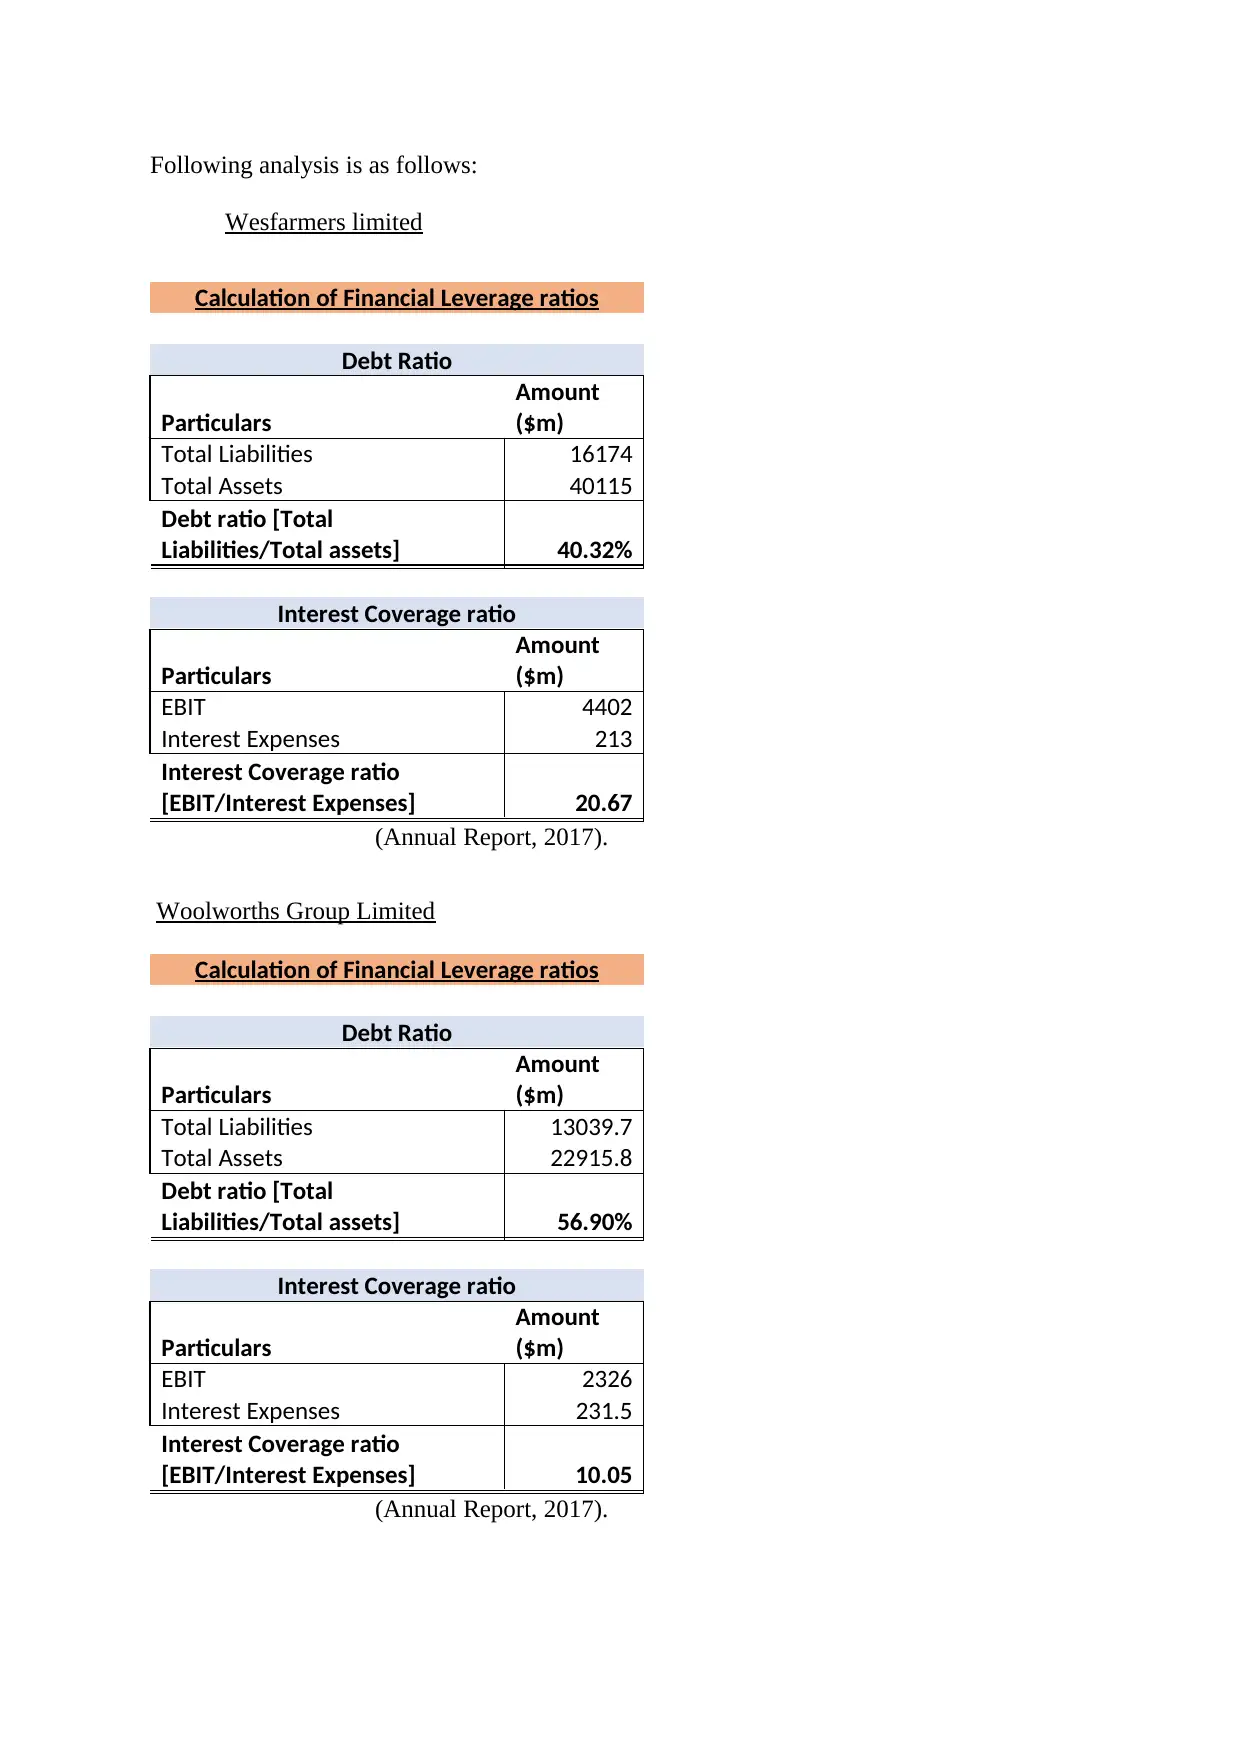
Following analysis is as follows:
Wesfarmers limited
Calculation of Financial Leverage ratios
Debt Ratio
Particulars
Amount
($m)
Total Liabilities 16174
Total Assets 40115
Debt ratio [Total
Liabilities/Total assets] 40.32%
Interest Coverage ratio
Particulars
Amount
($m)
EBIT 4402
Interest Expenses 213
Interest Coverage ratio
[EBIT/Interest Expenses] 20.67
(Annual Report, 2017).
Woolworths Group Limited
Calculation of Financial Leverage ratios
Debt Ratio
Particulars
Amount
($m)
Total Liabilities 13039.7
Total Assets 22915.8
Debt ratio [Total
Liabilities/Total assets] 56.90%
Interest Coverage ratio
Particulars
Amount
($m)
EBIT 2326
Interest Expenses 231.5
Interest Coverage ratio
[EBIT/Interest Expenses] 10.05
(Annual Report, 2017).
Wesfarmers Limited and Woolworths Group Limited
Year - 2017
Particulars Wesfarmers Limited Woolworths Group Limited
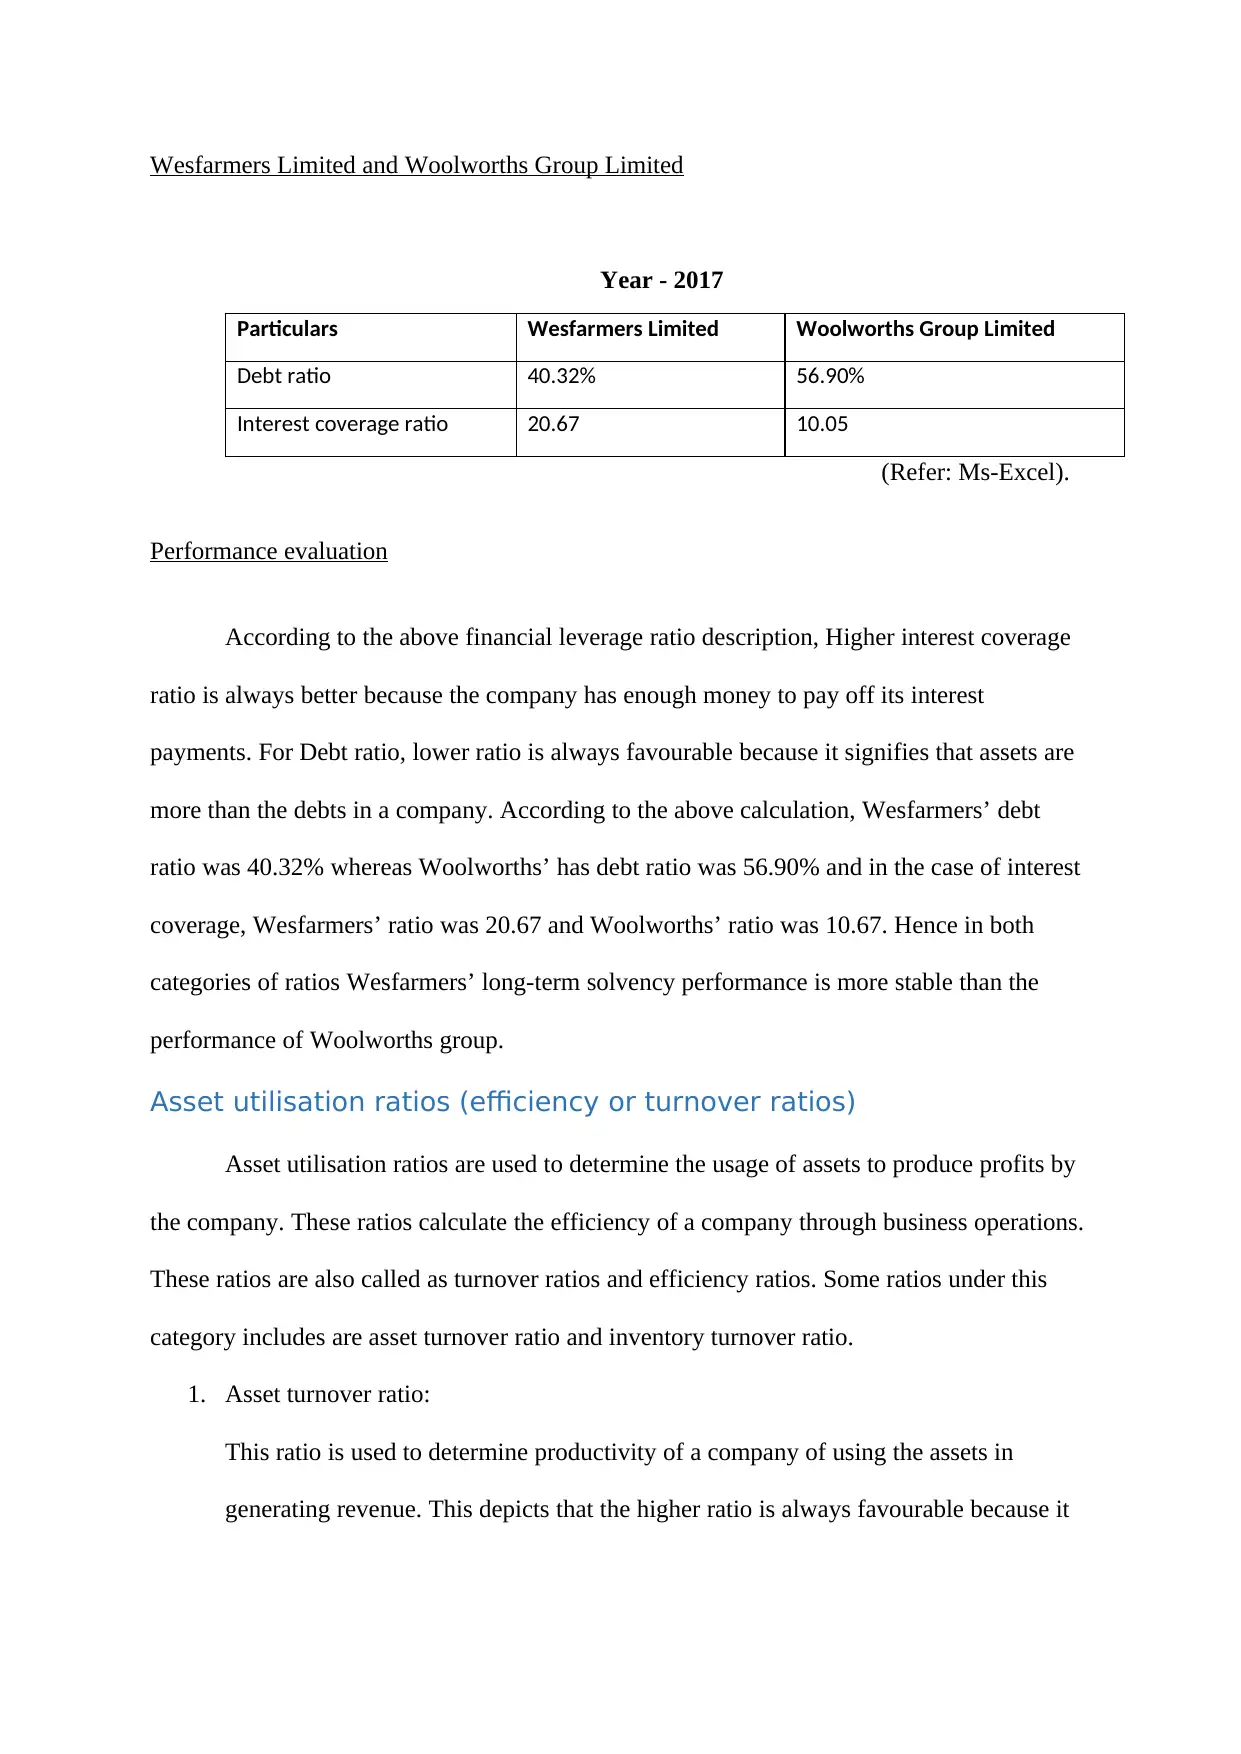
Debt ratio 40.32% 56.90%
Interest coverage ratio 20.67 10.05
(Refer: Ms-Excel).
Performance evaluation
According to the above financial leverage ratio description, Higher interest coverage
ratio is always better because the company has enough money to pay off its interest
payments. For Debt ratio, lower ratio is always favourable because it signifies that assets are
more than the debts in a company. According to the above calculation, Wesfarmers’ debt
ratio was 40.32% whereas Woolworths’ has debt ratio was 56.90% and in the case of interest
coverage, Wesfarmers’ ratio was 20.67 and Woolworths’ ratio was 10.67. Hence in both
categories of ratios Wesfarmers’ long-term solvency performance is more stable than the
performance of Woolworths group.
Asset utilisation ratios (efficiency or turnover ratios)
Asset utilisation ratios are used to determine the usage of assets to produce profits by
the company. These ratios calculate the efficiency of a company through business operations.
These ratios are also called as turnover ratios and efficiency ratios. Some ratios under this
category includes are asset turnover ratio and inventory turnover ratio.
1. Asset turnover ratio:
This ratio is used to determine productivity of a company of using the assets in
generating revenue. This depicts that the higher ratio is always favourable because it
Year - 2017
Particulars Wesfarmers Limited Woolworths Group Limited
Debt ratio 40.32% 56.90%
Interest coverage ratio 20.67 10.05
(Refer: Ms-Excel).
Performance evaluation
According to the above financial leverage ratio description, Higher interest coverage
ratio is always better because the company has enough money to pay off its interest
payments. For Debt ratio, lower ratio is always favourable because it signifies that assets are
more than the debts in a company. According to the above calculation, Wesfarmers’ debt
ratio was 40.32% whereas Woolworths’ has debt ratio was 56.90% and in the case of interest
coverage, Wesfarmers’ ratio was 20.67 and Woolworths’ ratio was 10.67. Hence in both
categories of ratios Wesfarmers’ long-term solvency performance is more stable than the
performance of Woolworths group.
Asset utilisation ratios (efficiency or turnover ratios)
Asset utilisation ratios are used to determine the usage of assets to produce profits by
the company. These ratios calculate the efficiency of a company through business operations.
These ratios are also called as turnover ratios and efficiency ratios. Some ratios under this
category includes are asset turnover ratio and inventory turnover ratio.
1. Asset turnover ratio:
This ratio is used to determine productivity of a company of using the assets in
generating revenue. This depicts that the higher ratio is always favourable because it
⊘ This is a preview!⊘
Do you want full access?
Subscribe today to unlock all pages.
Trusted by 1+ million students worldwide
implies that the company is very well used its assets. This is computed by dividing net
revenue to average total assets.
2. Inventory turnover ratio:
This ratio is used to determine productivity of a company of using the inventories in a
period. This measures how easily inventories are converted into cash. This is
computed by dividing the cost of sales to average total inventories.
3. Fixed asset turnover ratio:
This ratio is calculated to decide the efficiency of a company of generating revenue
from its fixed assets. This portrays that the higher ratio is favourable because it
implies that the company is effectively used its fixed assets. This is work out by
dividing net revenue to average total fixed assets.
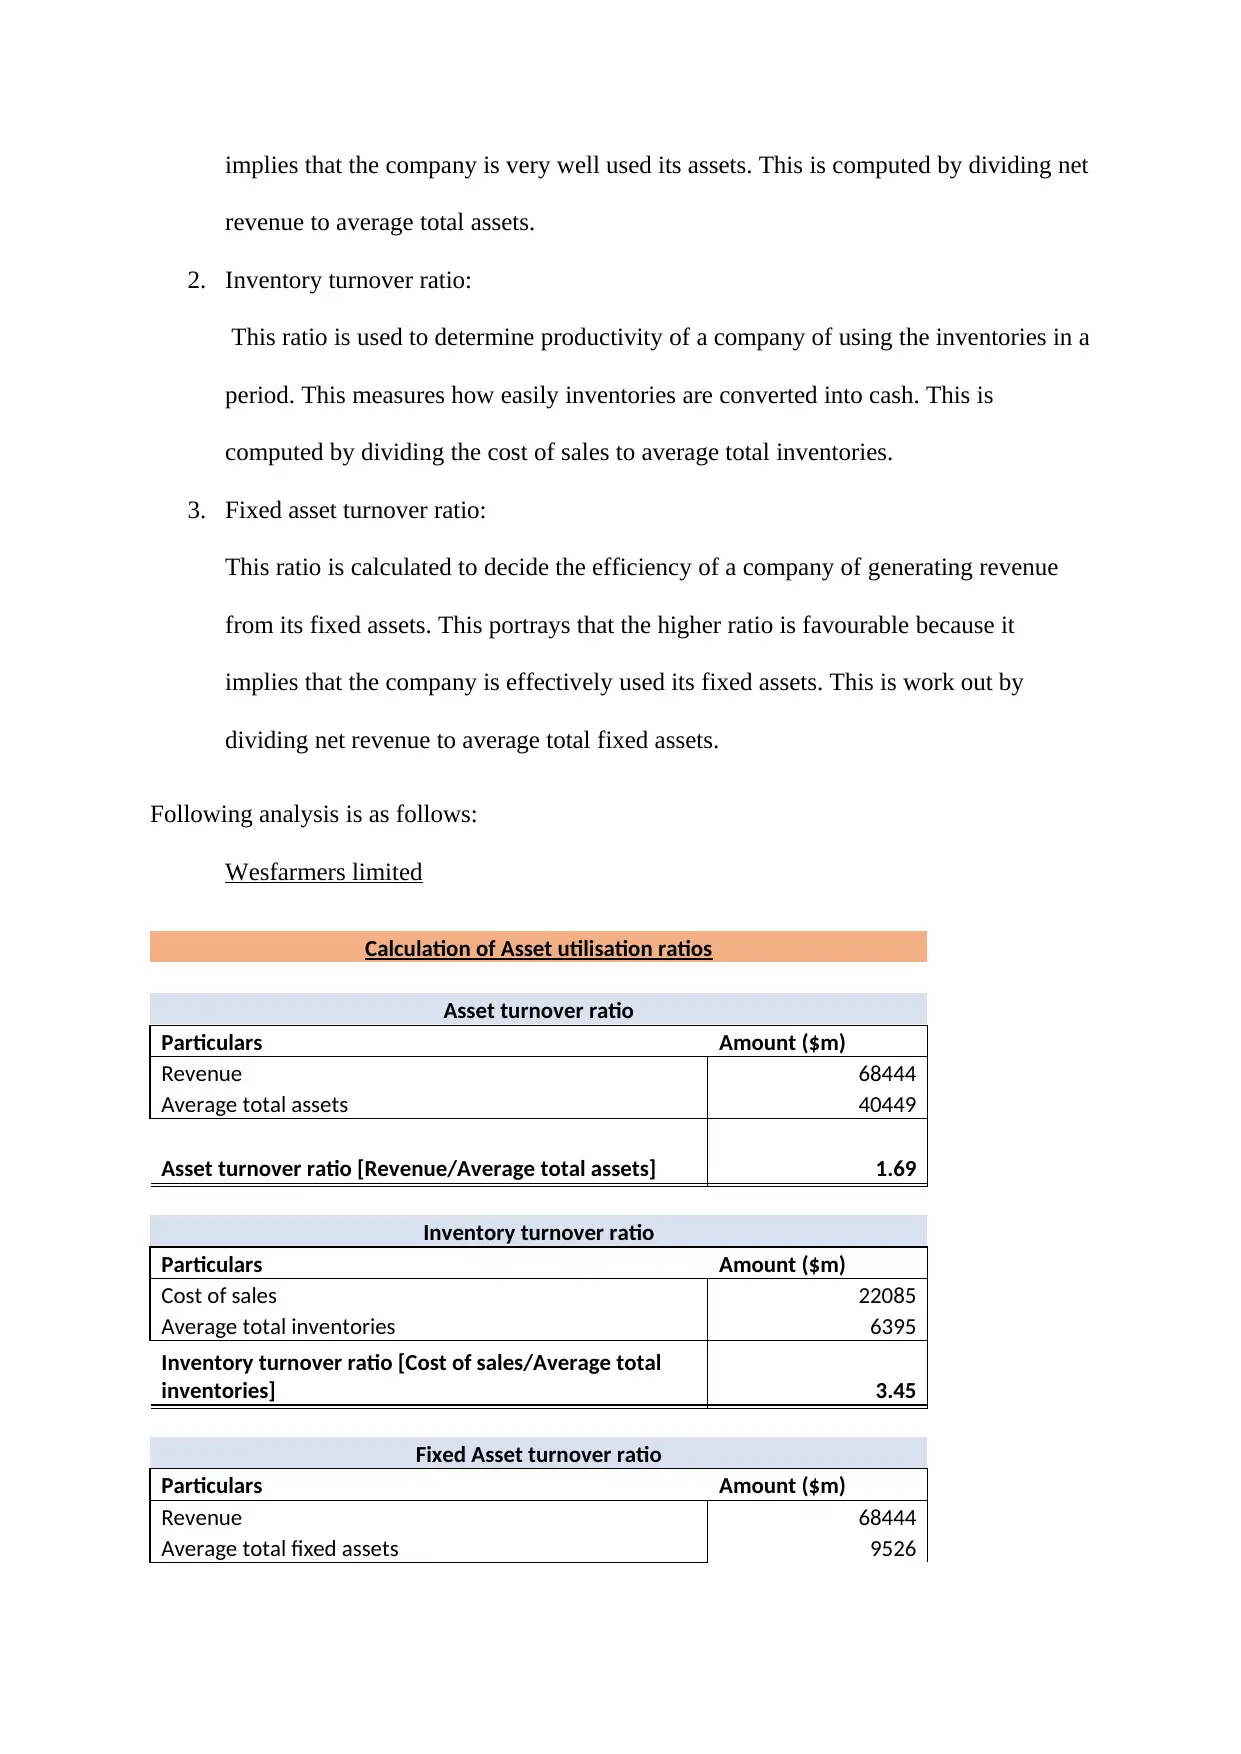
Following analysis is as follows:
Wesfarmers limited
Calculation of Asset utilisation ratios
Asset turnover ratio
Particulars Amount ($m)
Revenue 68444
Average total assets 40449
Asset turnover ratio [Revenue/Average total assets] 1.69
Inventory turnover ratio
Particulars Amount ($m)
Cost of sales 22085
Average total inventories 6395
Inventory turnover ratio [Cost of sales/Average total
inventories] 3.45
Fixed Asset turnover ratio
Particulars Amount ($m)
Revenue 68444
Average total fixed assets 9526
revenue to average total assets.
2. Inventory turnover ratio:
This ratio is used to determine productivity of a company of using the inventories in a
period. This measures how easily inventories are converted into cash. This is
computed by dividing the cost of sales to average total inventories.
3. Fixed asset turnover ratio:
This ratio is calculated to decide the efficiency of a company of generating revenue
from its fixed assets. This portrays that the higher ratio is favourable because it
implies that the company is effectively used its fixed assets. This is work out by
dividing net revenue to average total fixed assets.
Following analysis is as follows:
Wesfarmers limited
Calculation of Asset utilisation ratios
Asset turnover ratio
Particulars Amount ($m)
Revenue 68444
Average total assets 40449
Asset turnover ratio [Revenue/Average total assets] 1.69
Inventory turnover ratio
Particulars Amount ($m)
Cost of sales 22085
Average total inventories 6395
Inventory turnover ratio [Cost of sales/Average total
inventories] 3.45
Fixed Asset turnover ratio
Particulars Amount ($m)
Revenue 68444
Average total fixed assets 9526
Paraphrase This Document
Need a fresh take? Get an instant paraphrase of this document with our AI Paraphraser
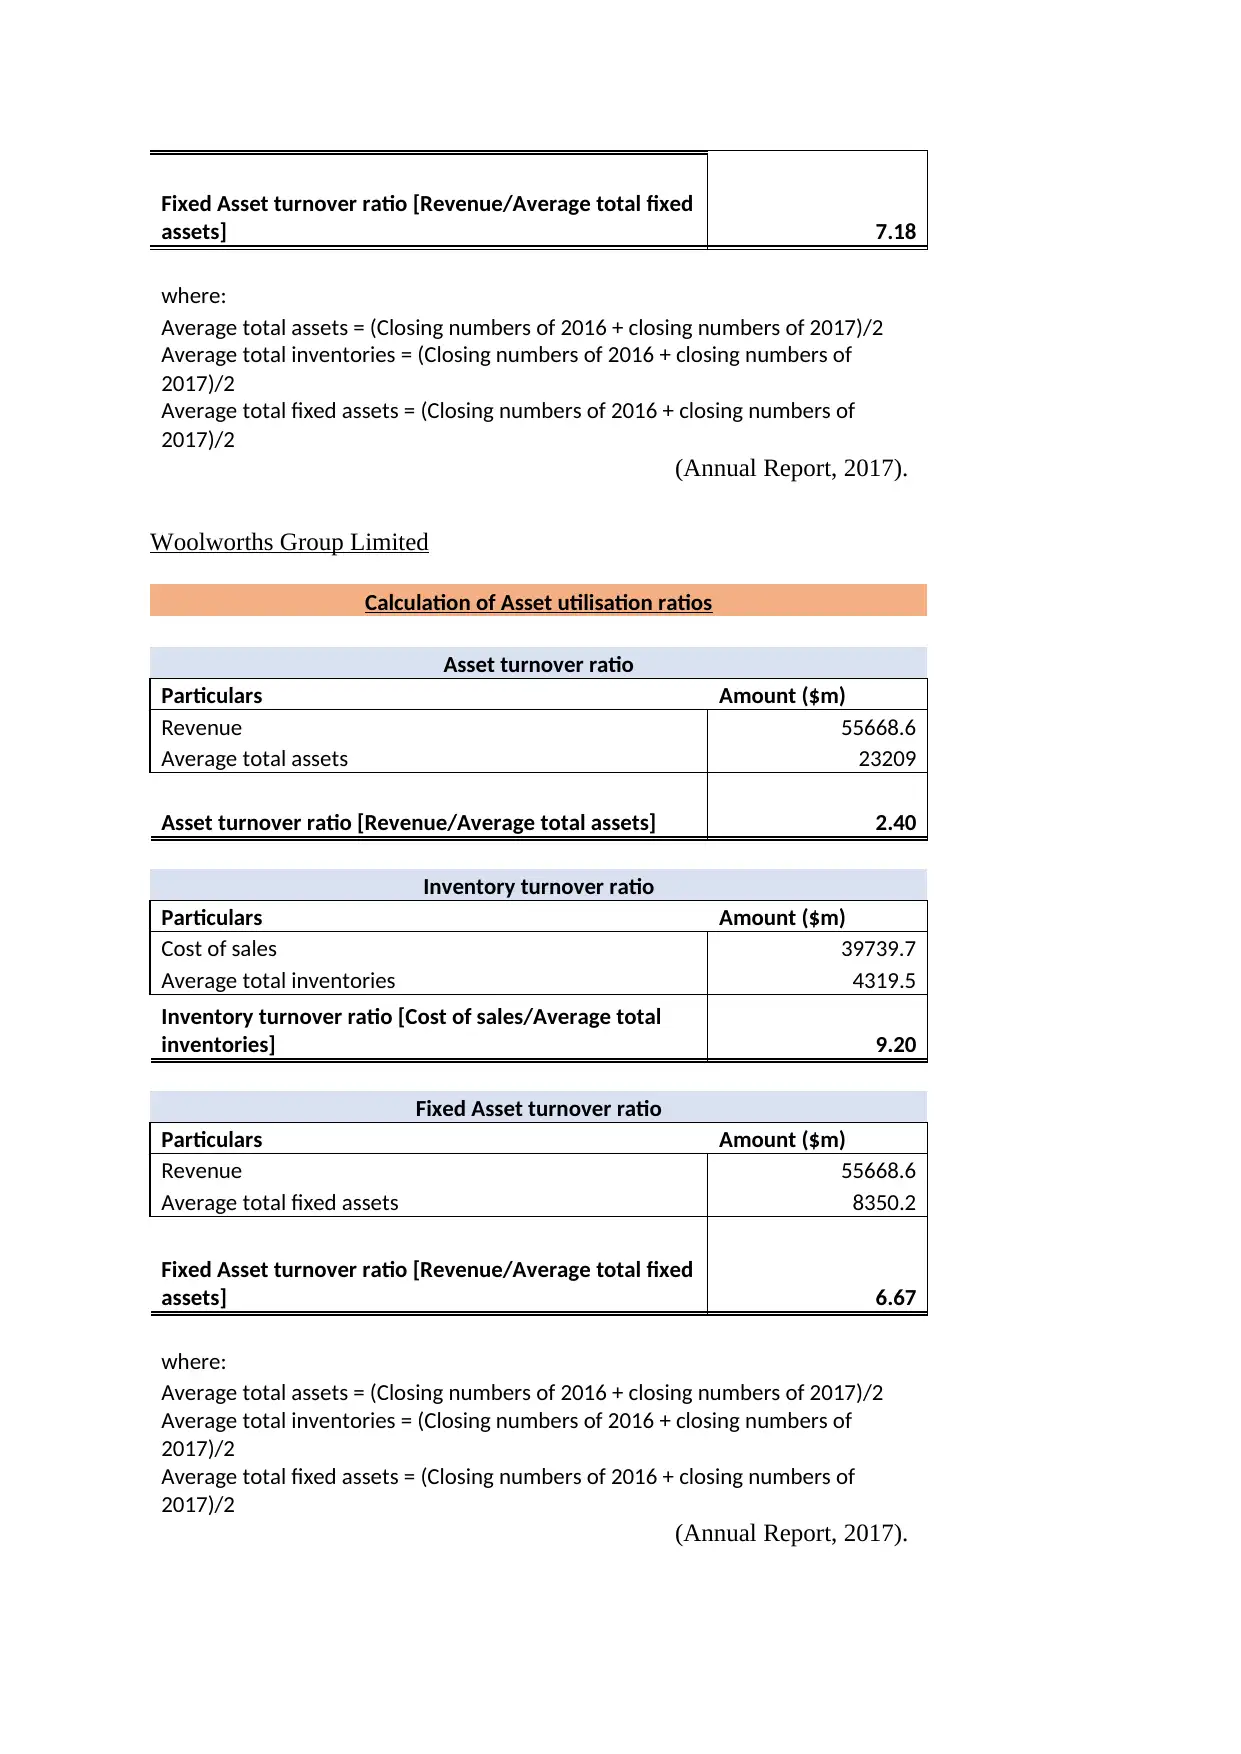
Fixed Asset turnover ratio [Revenue/Average total fixed
assets] 7.18
where:
Average total assets = (Closing numbers of 2016 + closing numbers of 2017)/2
Average total inventories = (Closing numbers of 2016 + closing numbers of
2017)/2
Average total fixed assets = (Closing numbers of 2016 + closing numbers of
2017)/2
(Annual Report, 2017).
Woolworths Group Limited
Calculation of Asset utilisation ratios
Asset turnover ratio
Particulars Amount ($m)
Revenue 55668.6
Average total assets 23209
Asset turnover ratio [Revenue/Average total assets] 2.40
Inventory turnover ratio
Particulars Amount ($m)
Cost of sales 39739.7
Average total inventories 4319.5
Inventory turnover ratio [Cost of sales/Average total
inventories] 9.20
Fixed Asset turnover ratio
Particulars Amount ($m)
Revenue 55668.6
Average total fixed assets 8350.2
Fixed Asset turnover ratio [Revenue/Average total fixed
assets] 6.67
where:
Average total assets = (Closing numbers of 2016 + closing numbers of 2017)/2
Average total inventories = (Closing numbers of 2016 + closing numbers of
2017)/2
Average total fixed assets = (Closing numbers of 2016 + closing numbers of
2017)/2
(Annual Report, 2017).
Wesfarmers Limited and Woolworths Group Limited
Year - 2017
Particulars Wesfarmers Limited Woolworths Group Limited
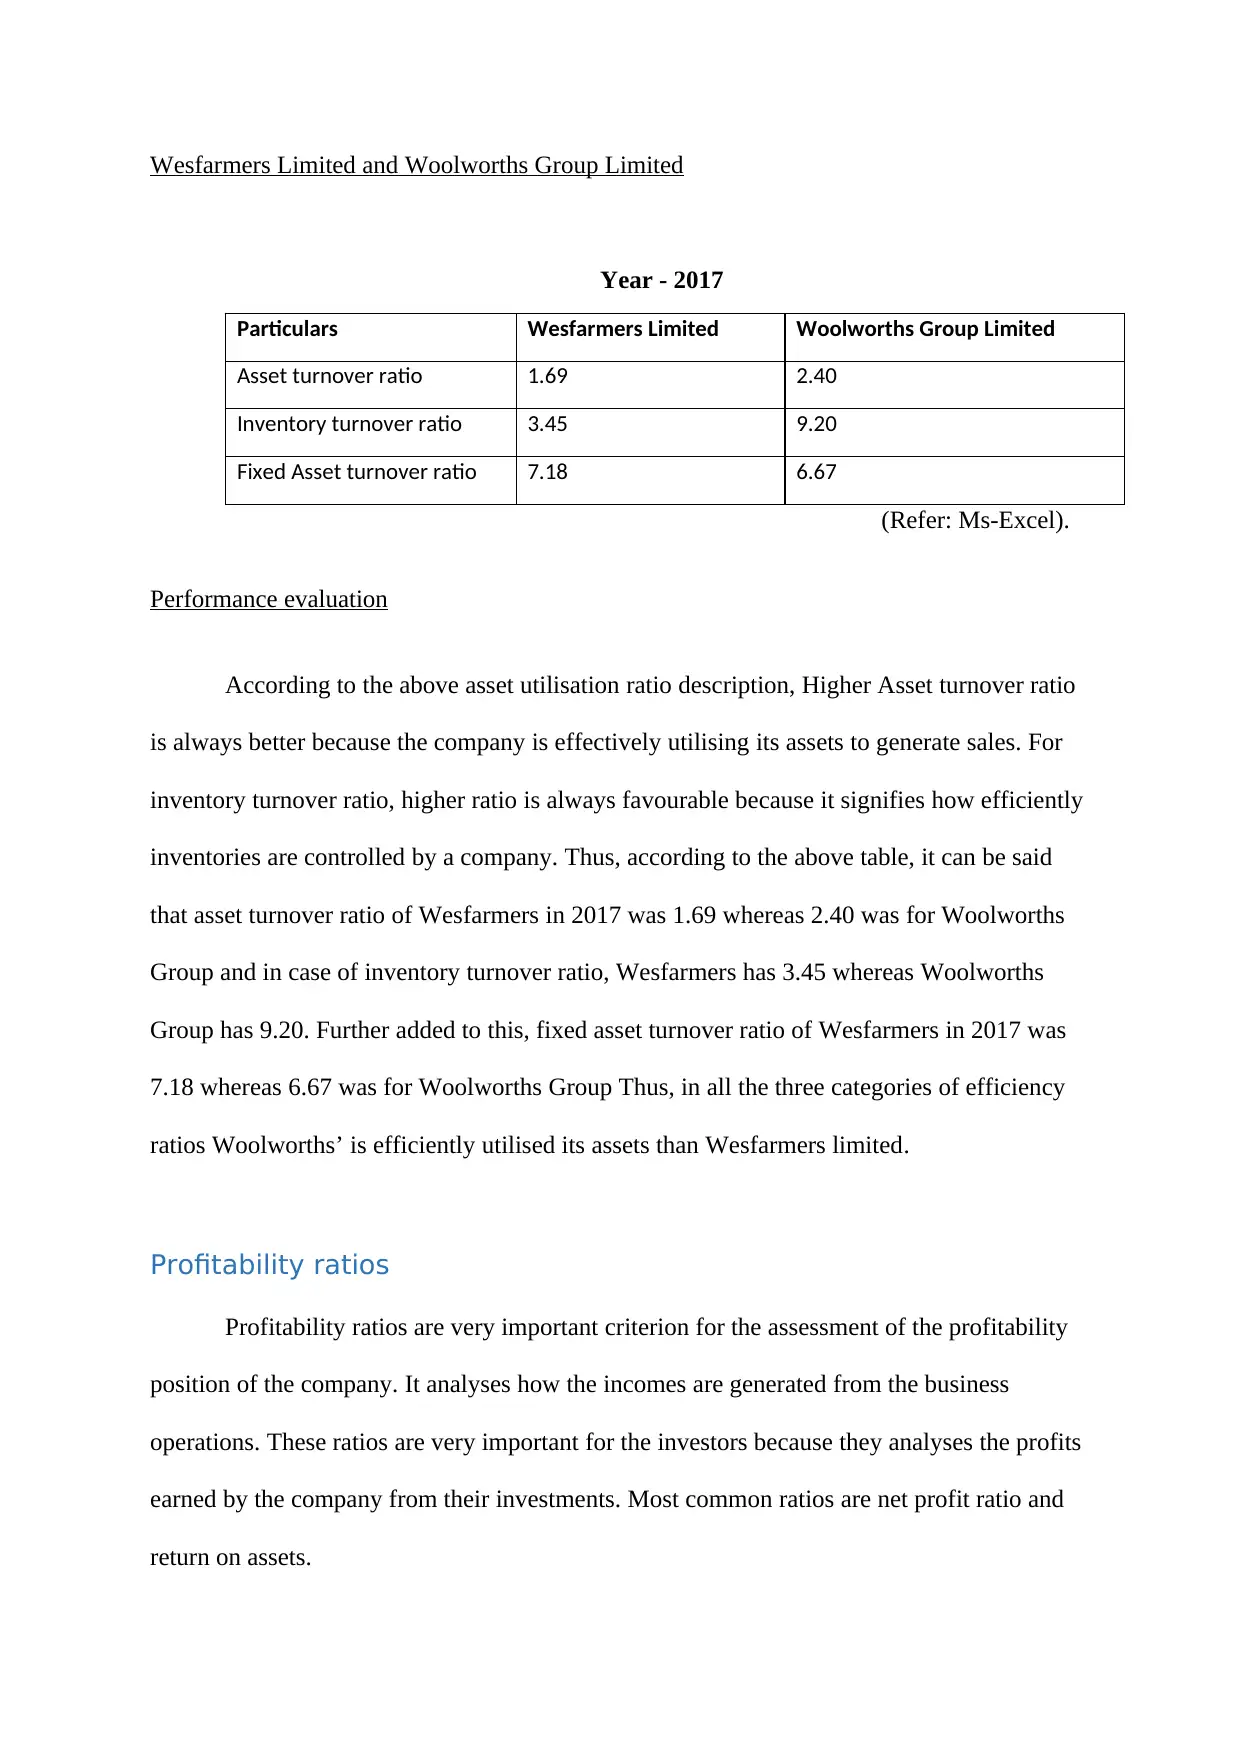
Asset turnover ratio 1.69 2.40
Inventory turnover ratio 3.45 9.20
Fixed Asset turnover ratio 7.18 6.67
(Refer: Ms-Excel).
Performance evaluation
According to the above asset utilisation ratio description, Higher Asset turnover ratio
is always better because the company is effectively utilising its assets to generate sales. For
inventory turnover ratio, higher ratio is always favourable because it signifies how efficiently
inventories are controlled by a company. Thus, according to the above table, it can be said
that asset turnover ratio of Wesfarmers in 2017 was 1.69 whereas 2.40 was for Woolworths
Group and in case of inventory turnover ratio, Wesfarmers has 3.45 whereas Woolworths
Group has 9.20. Further added to this, fixed asset turnover ratio of Wesfarmers in 2017 was
7.18 whereas 6.67 was for Woolworths Group Thus, in all the three categories of efficiency
ratios Woolworths’ is efficiently utilised its assets than Wesfarmers limited.
Profitability ratios
Profitability ratios are very important criterion for the assessment of the profitability
position of the company. It analyses how the incomes are generated from the business
operations. These ratios are very important for the investors because they analyses the profits
earned by the company from their investments. Most common ratios are net profit ratio and
return on assets.
Year - 2017
Particulars Wesfarmers Limited Woolworths Group Limited
Asset turnover ratio 1.69 2.40
Inventory turnover ratio 3.45 9.20
Fixed Asset turnover ratio 7.18 6.67
(Refer: Ms-Excel).
Performance evaluation
According to the above asset utilisation ratio description, Higher Asset turnover ratio
is always better because the company is effectively utilising its assets to generate sales. For
inventory turnover ratio, higher ratio is always favourable because it signifies how efficiently
inventories are controlled by a company. Thus, according to the above table, it can be said
that asset turnover ratio of Wesfarmers in 2017 was 1.69 whereas 2.40 was for Woolworths
Group and in case of inventory turnover ratio, Wesfarmers has 3.45 whereas Woolworths
Group has 9.20. Further added to this, fixed asset turnover ratio of Wesfarmers in 2017 was
7.18 whereas 6.67 was for Woolworths Group Thus, in all the three categories of efficiency
ratios Woolworths’ is efficiently utilised its assets than Wesfarmers limited.
Profitability ratios
Profitability ratios are very important criterion for the assessment of the profitability
position of the company. It analyses how the incomes are generated from the business
operations. These ratios are very important for the investors because they analyses the profits
earned by the company from their investments. Most common ratios are net profit ratio and
return on assets.
⊘ This is a preview!⊘
Do you want full access?
Subscribe today to unlock all pages.
Trusted by 1+ million students worldwide
1 out of 20
Related Documents


Your All-in-One AI-Powered Toolkit for Academic Success.
+13062052269
info@desklib.com
Available 24*7 on WhatsApp / Email
![[object Object]](/_next/static/media/star-bottom.7253800d.svg)
Unlock your academic potential
Copyright © 2020–2026 A2Z Services. All Rights Reserved. Developed and managed by ZUCOL.