Comparative Financial Ratio Analysis of UK Supermarket Groups

Verified

Added on  2022/09/18

|6
|860
|30
Report
AI Summary
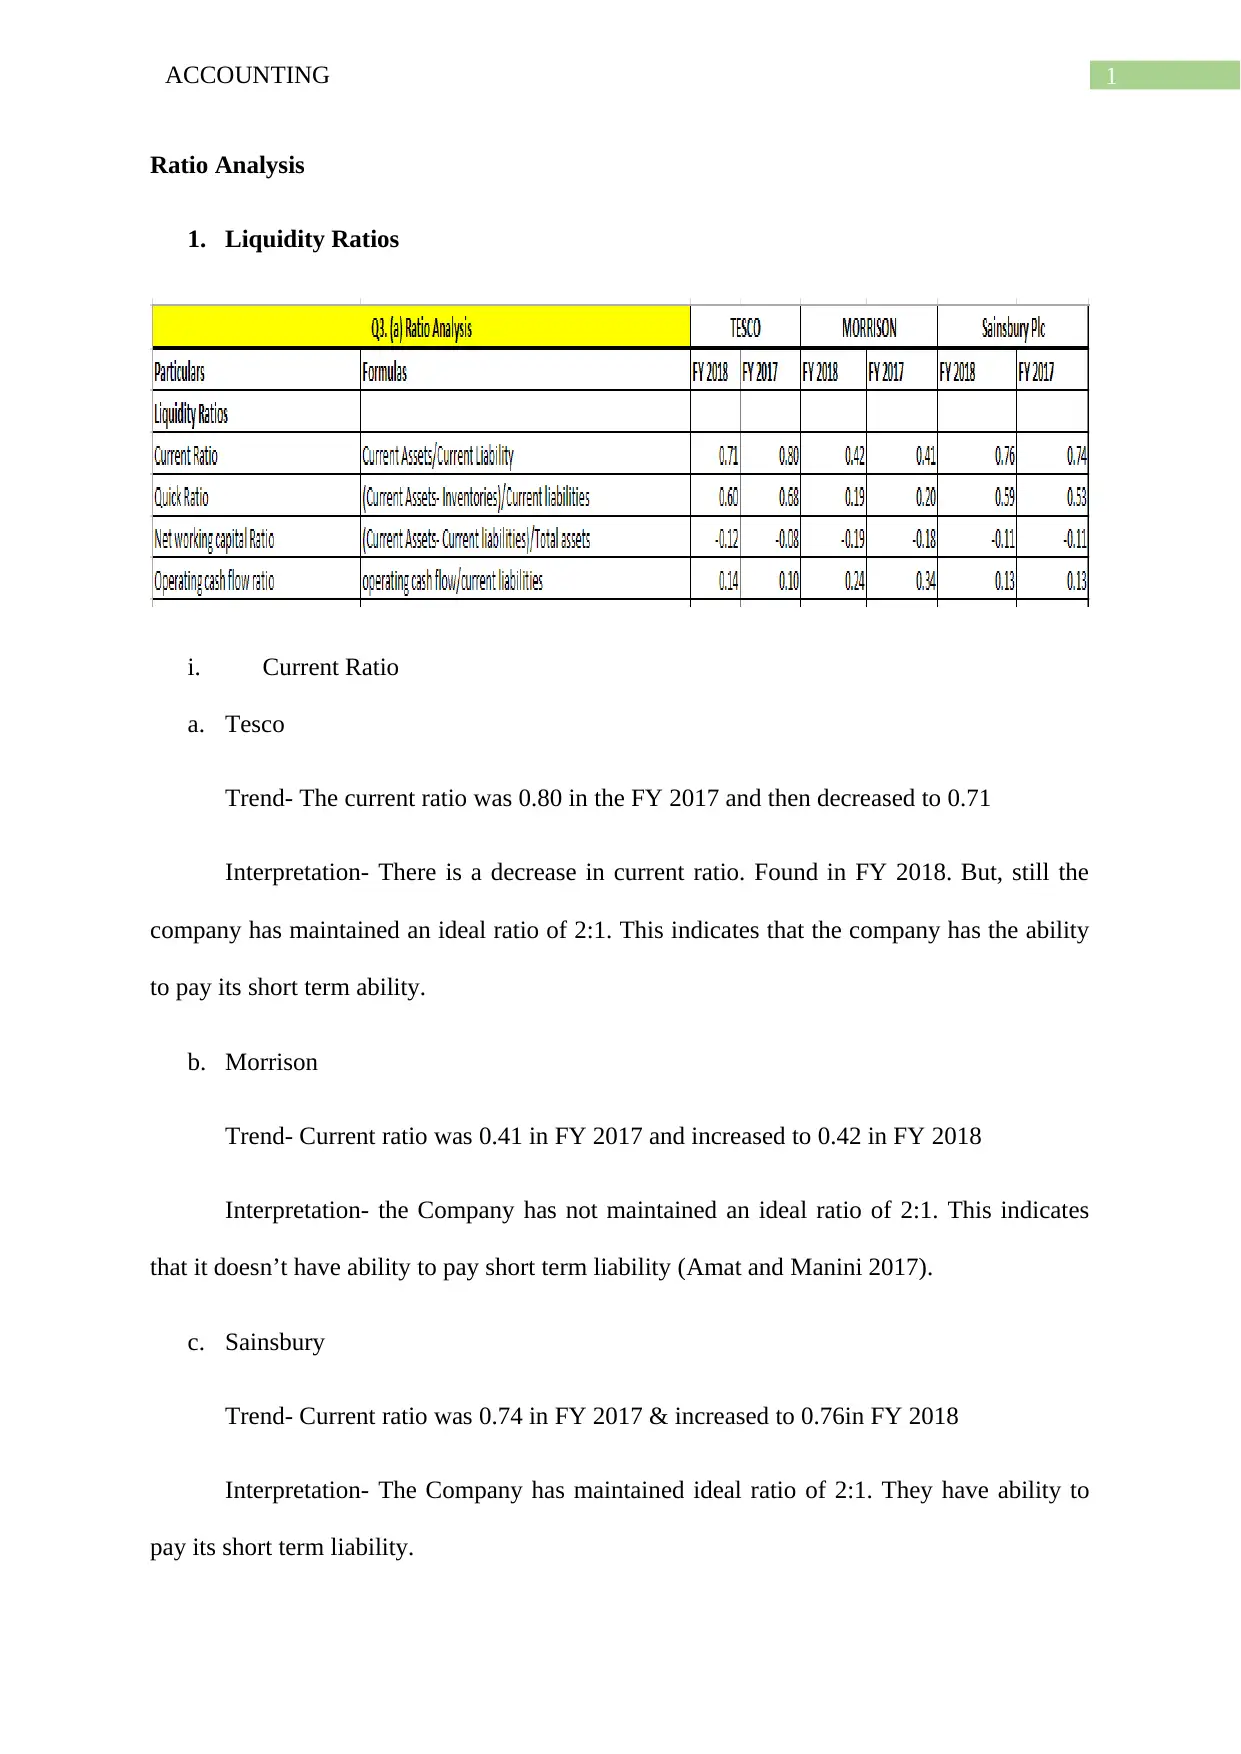
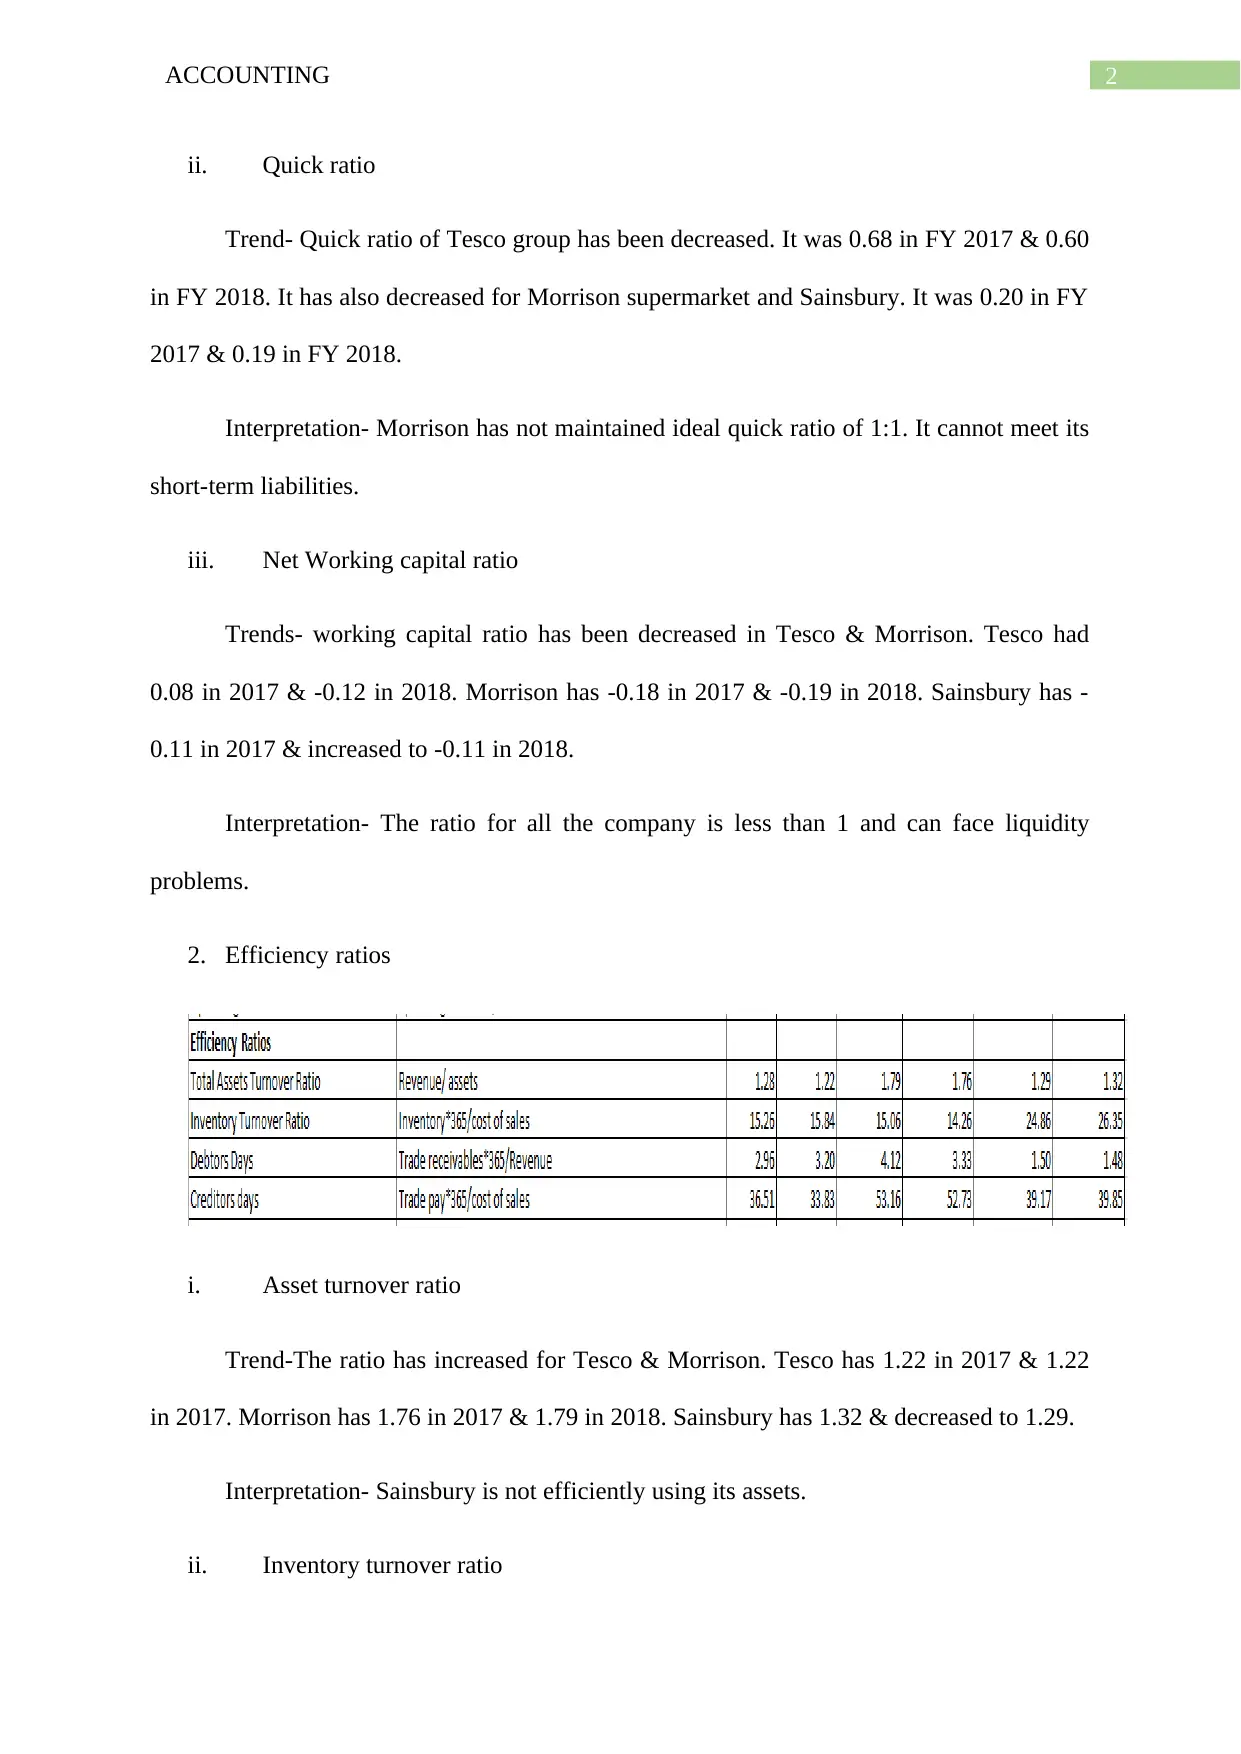
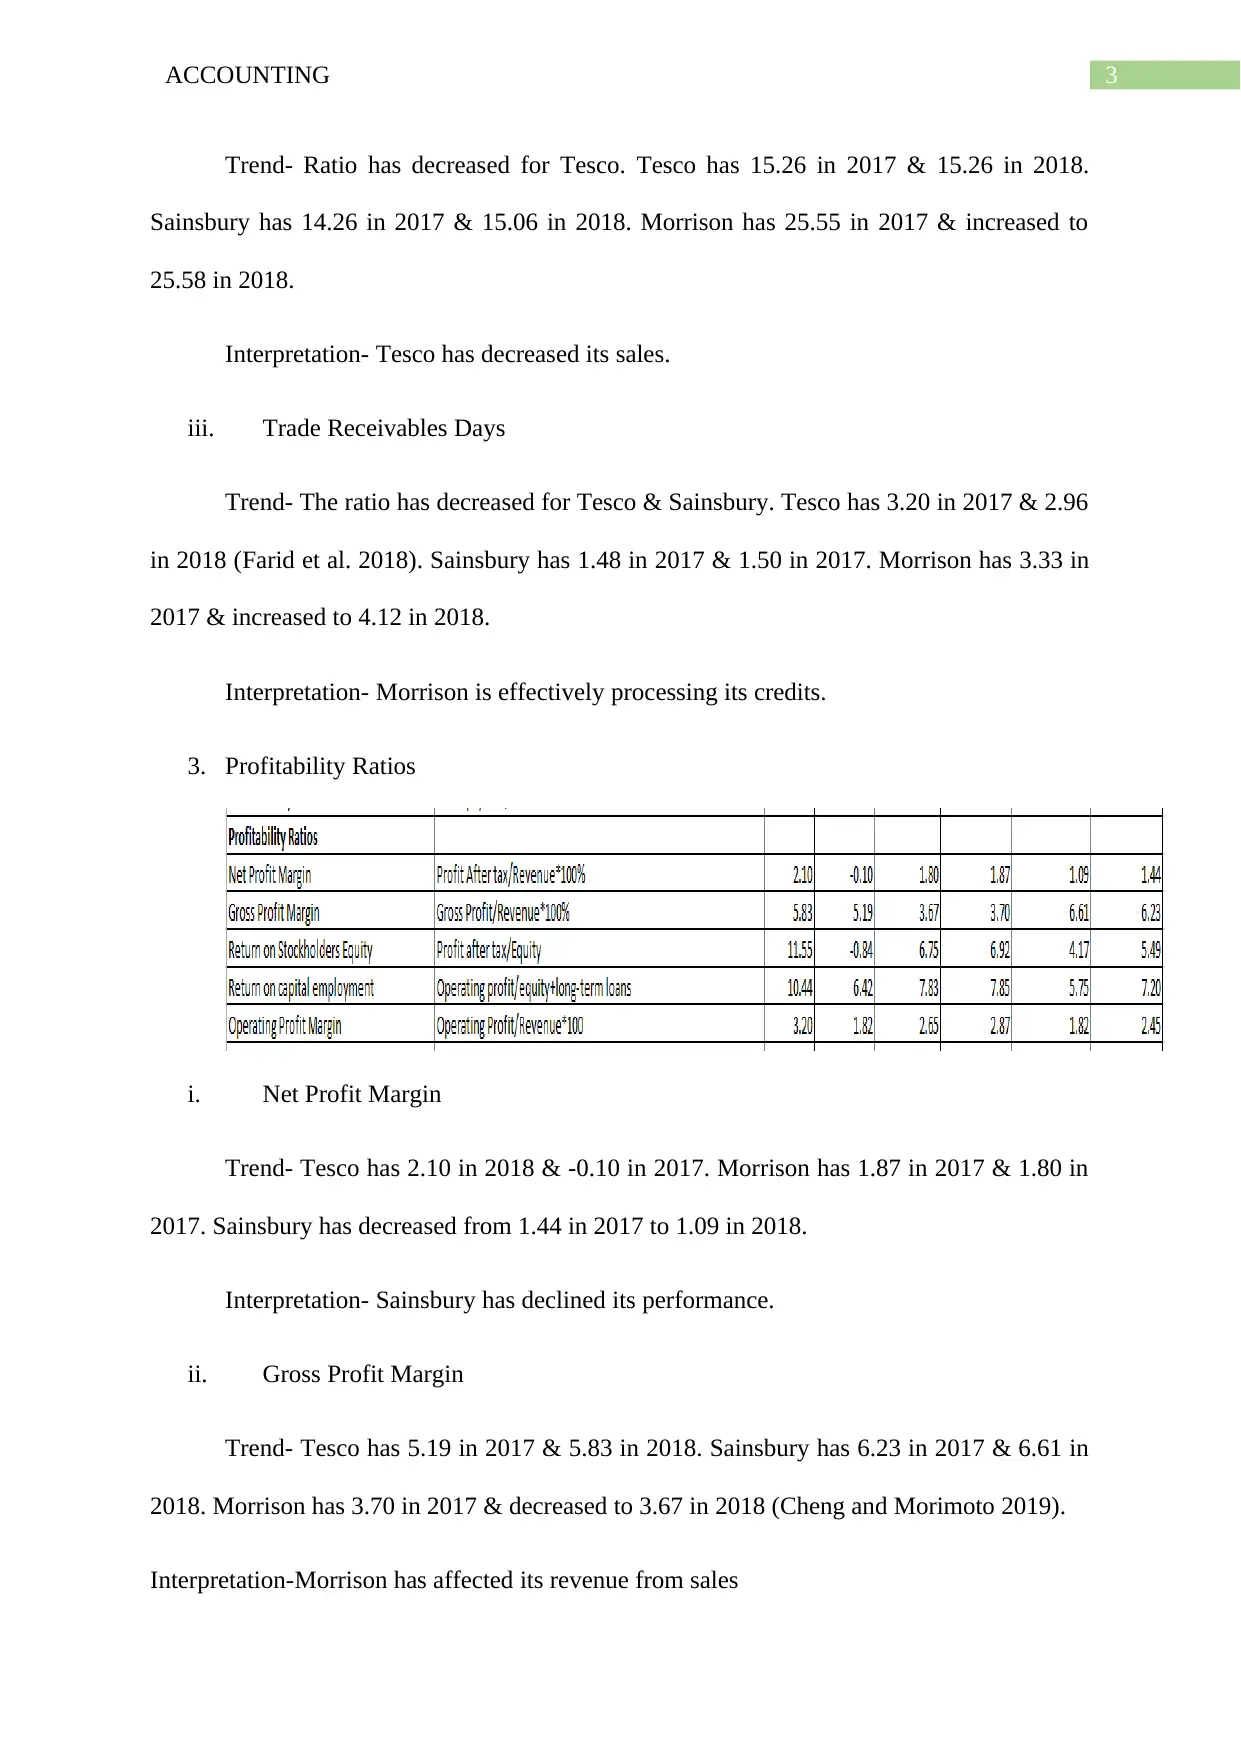
This report presents a comparative financial ratio analysis of three major UK supermarket groups: Tesco, Morrisons, and Sainsbury's. The analysis encompasses various financial ratios categorized into liquidity, efficiency, profitability, and investment ratios, calculated using data from their annual reports. The study identifies trends in each company's performance over a two-year period, highlighting key changes in metrics such as current ratio, quick ratio, asset turnover, inventory turnover, net profit margin, gross profit margin, price-earnings ratio, and DuPont analysis. The report interprets these ratios to assess the financial health, efficiency, and profitability of each supermarket, providing insights into their ability to manage assets, meet short-term liabilities, and generate returns for investors. The conclusion summarizes the relative financial positions of the companies based on the ratio analysis, emphasizing their strengths and weaknesses.
Document Page
Running Head: ACCOUNTING
ACCOUNTING
Name of the Student
Name of the University
Author Note
tabler-icon-diamond-filled.svg

Paraphrase This Document

Need a fresh take? Get an instant paraphrase of this document with our AI Paraphraser
Document Page
1ACCOUNTING
Ratio Analysis
1. Liquidity Ratios
i. Current Ratio
a. Tesco
Trend- The current ratio was 0.80 in the FY 2017 and then decreased to 0.71
Interpretation- There is a decrease in current ratio. Found in FY 2018. But, still the
company has maintained an ideal ratio of 2:1. This indicates that the company has the ability
to pay its short term ability.
b. Morrison
Trend- Current ratio was 0.41 in FY 2017 and increased to 0.42 in FY 2018
Interpretation- the Company has not maintained an ideal ratio of 2:1. This indicates
that it doesn’t have ability to pay short term liability (Amat and Manini 2017).
c. Sainsbury
Trend- Current ratio was 0.74 in FY 2017 & increased to 0.76in FY 2018
Interpretation- The Company has maintained ideal ratio of 2:1. They have ability to
pay its short term liability.
Document Page
2ACCOUNTING
ii. Quick ratio
Trend- Quick ratio of Tesco group has been decreased. It was 0.68 in FY 2017 & 0.60
in FY 2018. It has also decreased for Morrison supermarket and Sainsbury. It was 0.20 in FY
2017 & 0.19 in FY 2018.
Interpretation- Morrison has not maintained ideal quick ratio of 1:1. It cannot meet its
short-term liabilities.
iii. Net Working capital ratio
Trends- working capital ratio has been decreased in Tesco & Morrison. Tesco had
0.08 in 2017 & -0.12 in 2018. Morrison has -0.18 in 2017 & -0.19 in 2018. Sainsbury has -
0.11 in 2017 & increased to -0.11 in 2018.
Interpretation- The ratio for all the company is less than 1 and can face liquidity
problems.
2. Efficiency ratios
i. Asset turnover ratio
Trend-The ratio has increased for Tesco & Morrison. Tesco has 1.22 in 2017 & 1.22
in 2017. Morrison has 1.76 in 2017 & 1.79 in 2018. Sainsbury has 1.32 & decreased to 1.29.
Interpretation- Sainsbury is not efficiently using its assets.
ii. Inventory turnover ratio
Document Page
3ACCOUNTING
Trend- Ratio has decreased for Tesco. Tesco has 15.26 in 2017 & 15.26 in 2018.
Sainsbury has 14.26 in 2017 & 15.06 in 2018. Morrison has 25.55 in 2017 & increased to
25.58 in 2018.
Interpretation- Tesco has decreased its sales.
iii. Trade Receivables Days
Trend- The ratio has decreased for Tesco & Sainsbury. Tesco has 3.20 in 2017 & 2.96
in 2018 (Farid et al. 2018). Sainsbury has 1.48 in 2017 & 1.50 in 2017. Morrison has 3.33 in
2017 & increased to 4.12 in 2018.
Interpretation- Morrison is effectively processing its credits.
3. Profitability Ratios
i. Net Profit Margin
Trend- Tesco has 2.10 in 2018 & -0.10 in 2017. Morrison has 1.87 in 2017 & 1.80 in
2017. Sainsbury has decreased from 1.44 in 2017 to 1.09 in 2018.
Interpretation- Sainsbury has declined its performance.
ii. Gross Profit Margin
Trend- Tesco has 5.19 in 2017 & 5.83 in 2018. Sainsbury has 6.23 in 2017 & 6.61 in
2018. Morrison has 3.70 in 2017 & decreased to 3.67 in 2018 (Cheng and Morimoto 2019).
Interpretation-Morrison has affected its revenue from sales
tabler-icon-diamond-filled.svg

Paraphrase This Document

Need a fresh take? Get an instant paraphrase of this document with our AI Paraphraser
Document Page
4ACCOUNTING
4. Investment Ratios
i. Price earnings ratio
Trend- Tesco has -380 in 2017 & 13.91 in 2018. Morison has 18.16 in 2017 & 16.73
in 2018. Sainsbury has 15.22 in 2017 & 18.18 in 2018 (Tarigan et al. 2018).
Interpretation- Tesco has lower value for its stocks
ii. DuPont
Trend- Tesco has -0.72 in 2017 & increased to 8.86 in 2018. Morrison has 3.88 in
2017 & 3.58 in 2018. Sainsbury has 3.58 in 2017 & 26.76 in 2018.
Interpretation- All the company has ability to return its equity.
Conclusion
Therefore, it is found that, the Tesco has properly managed its assets, current ratio and
has higher ability to return its equity. It also has increased its net profitability. The company
is in better financial position.
iii.
Document Page
5ACCOUNTING
References
Amat, O. and Manini, R., 2017. Credit scoring for the supermarket and retailing industry:
analysis and application proposal.
Cheng, Y. and Morimoto, Y., 2019. Analysis of Supermarket Customer Behavior by Using
RFM and Huff’s Gravity Model. Bulletin of Networking, Computing, Systems, and Software,
8(2), pp.81-86.
Farid, M.S., Alam, M.J., Rahman, M.M., Barua, S. and Sarker, B., 2018. Direct and
associated factors influencing the growth in supermarket activity in Bangladesh. Asian
Research Journal of Arts & Social Sciences, pp.1-12.
Tarigan, U., Tarigan, U.P.P., Rahman, I.H. and Rizkya, I., 2018. Design of facility layout
with lean service and market basket analysis method to simplification of service process in
the supermarket. In MATEC Web of Conferences (Vol. 197, p. 14006). EDP Sciences.
chevron_up_icon
1 out of 6
circle_padding
hide_on_mobile
zoom_out_icon
[object Object]