Financial Analysis Report: AstraZeneca vs. GSK, MBA Finance Module
VerifiedAdded on 2021/09/18
|29
|4389
|80
Report
AI Summary
This report presents a comprehensive financial analysis of AstraZeneca plc, comparing its performance with that of GlaxoSmithKline (GSK). The analysis examines key financial statements and calculates various ratios, including profitability (gross profit, net profit, ROCE, ROA, and operating profit), liquidity (current ratio and quick ratio), leverage (gearing ratio and debt-equity ratio), and investment ratios (EPS and P/E ratio). The report analyzes trends from 2011 to 2014, identifying factors influencing these ratios, such as revenue fluctuations, acquisitions, and financial expenses. The analysis provides insights into AstraZeneca's financial position, highlighting its strengths and weaknesses, and offers potential areas for improvement. The report also touches upon the company's history, controversies, and market position. The report concludes with a discussion on the option of purchasing shares of a competitor and the reasons behind it.
Student Electronic Assignment Cover Sheet
Student (s) Number as per your student card:10332343
Course Title: MBA (FINANCE STREAM)
Lecturer Name: ENDA MURPHY
Module/Subject Code: B9AC106
Module/Subject Title: FINANCIAL ANALYSIS
Assignment Title: FINANCIAL ANALYSIS OF ASTRAZENECA AND GSK
No. of words:2956
Date of Submission: 20/03/2016
0 | P a g e
Paraphrase This Document
Need a fresh take? Get an instant paraphrase of this document with our AI Paraphraser
TABLE OF CONTENTS:
INTRODUCTION……………………………………………………………2
FINANCIAL PERFORMANCE AND POSITION………………………….4
OPTION OF PURCHASING SHARES OF COMPETITOR……………….13
REASONS……………………………………………………………………15
CONCLUSION……………………………………………………………….19
BIBLIOGRAPHY…………………………………………………………….20
APPENDIX…………………………………………………………………22
Figures:12
Tables:5
1 | P a g e
Introduction:
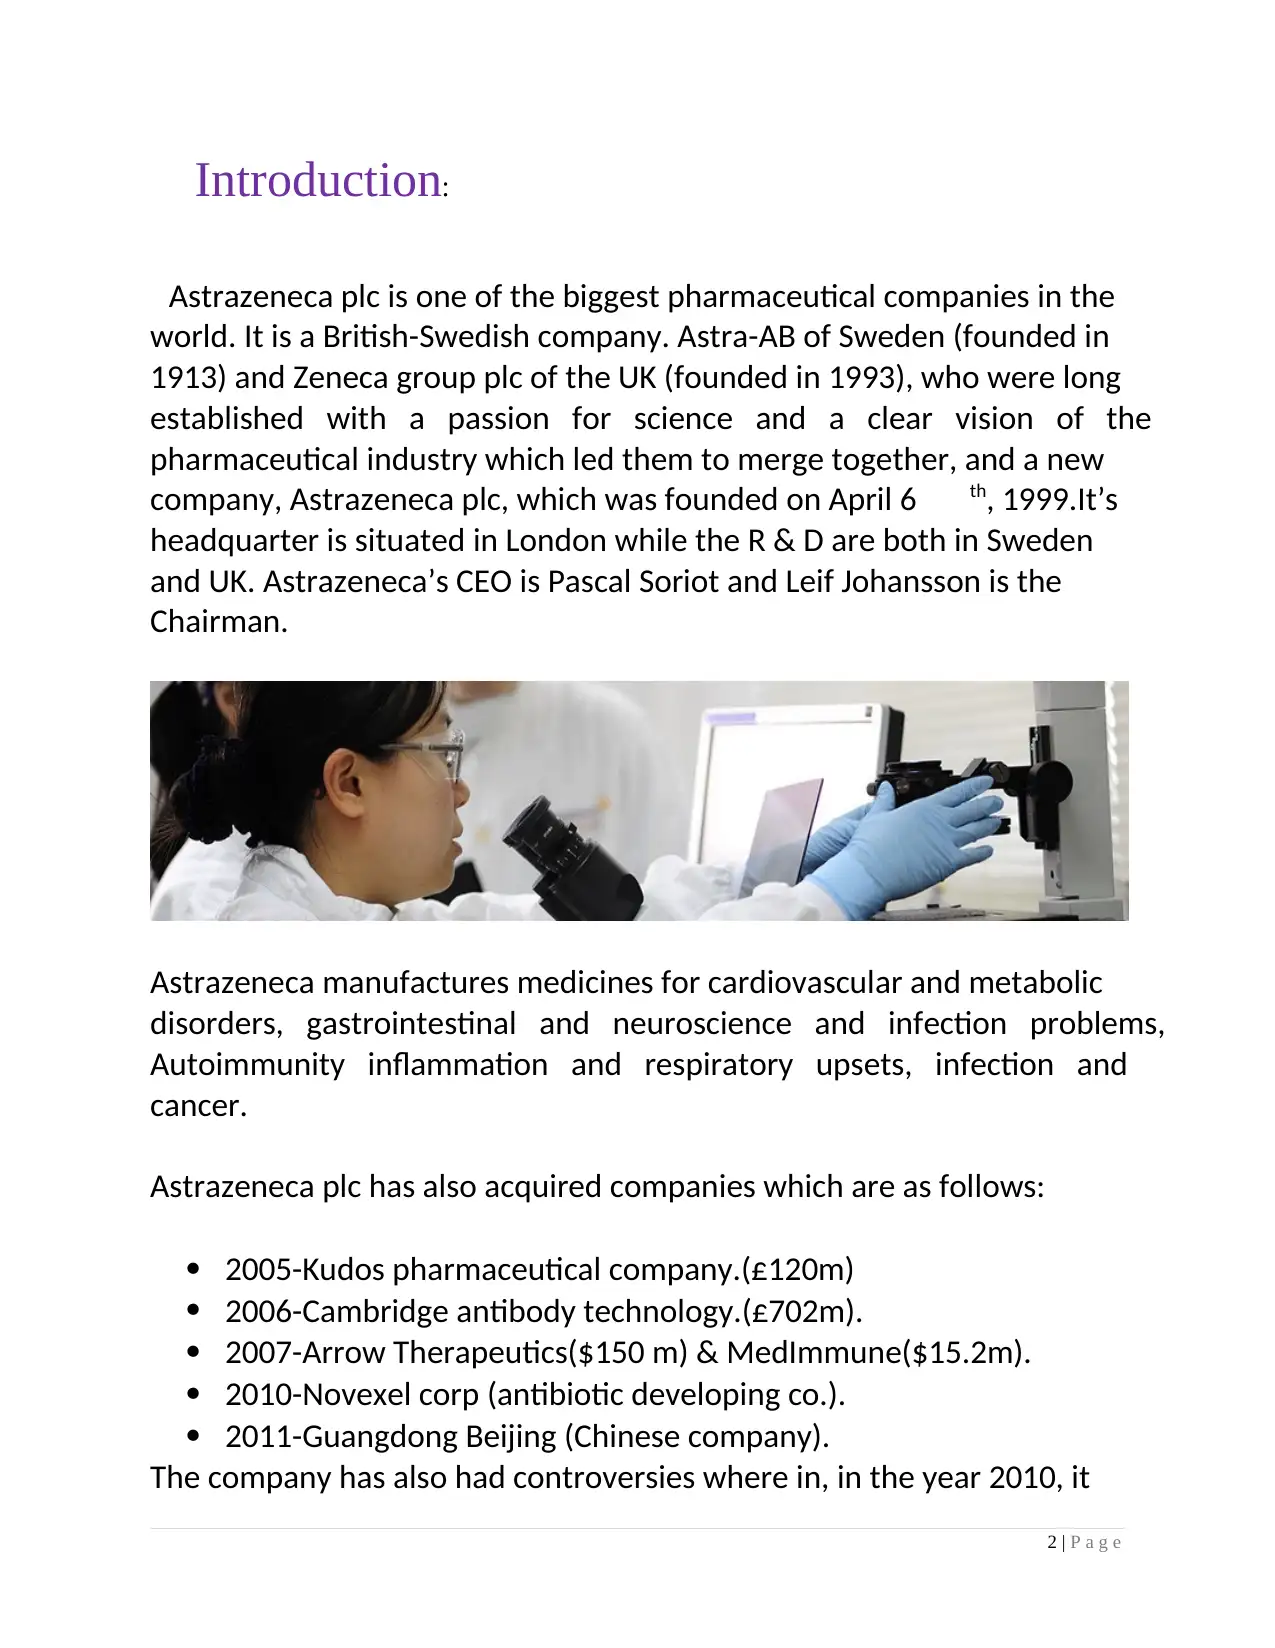
Astrazeneca plc is one of the biggest pharmaceutical companies in the
world. It is a British-Swedish company. Astra-AB of Sweden (founded in
1913) and Zeneca group plc of the UK (founded in 1993), who were long
established with a passion for science and a clear vision of the
pharmaceutical industry which led them to merge together, and a new
company, Astrazeneca plc, which was founded on April 6 th, 1999.It’s
headquarter is situated in London while the R & D are both in Sweden
and UK. Astrazeneca’s CEO is Pascal Soriot and Leif Johansson is the
Chairman.
Astrazeneca manufactures medicines for cardiovascular and metabolic
disorders, gastrointestinal and neuroscience and infection problems,
Autoimmunity inflammation and respiratory upsets, infection and
cancer.
Astrazeneca plc has also acquired companies which are as follows:
2005-Kudos pharmaceutical company.(£120m)
2006-Cambridge antibody technology.(£702m).
2007-Arrow Therapeutics($150 m) & MedImmune($15.2m).
2010-Novexel corp (antibiotic developing co.).
2011-Guangdong Beijing (Chinese company).
The company has also had controversies where in, in the year 2010, it
2 | P a g e
⊘ This is a preview!⊘
Do you want full access?
Subscribe today to unlock all pages.
Trusted by 1+ million students worldwide
settled a lawsuit for $520m to settle allegations that the company
defrauded Medicaid and Medicare, and other government-funded
health care programs. In 2011, it settled a lawsuit of $68.5m in US.
Despite the uncertanities Astrazeneca faced in the past, it has managed
to keep up the good work and has continued effective research to cure
serious diseases.
The company operates in the UK, US, France, Sweden, Canada, Brazil,
China, Japan and India. The company’s largest single R & D site is based
at Alderly park, Cheshire, England with over 4,500 staff. All together,
there are over 50,000 people who work for Astrazeneca. Astrazeneca is
listed at #239 Global 2000.In 2014, company revenue was $26.09B and
net income was $1.23B. Today, Astrazeneca is listed in the 100 FTSE
index and it’s market capital is £54.8 billion which makes it 6 th in the
primary L.S.E.
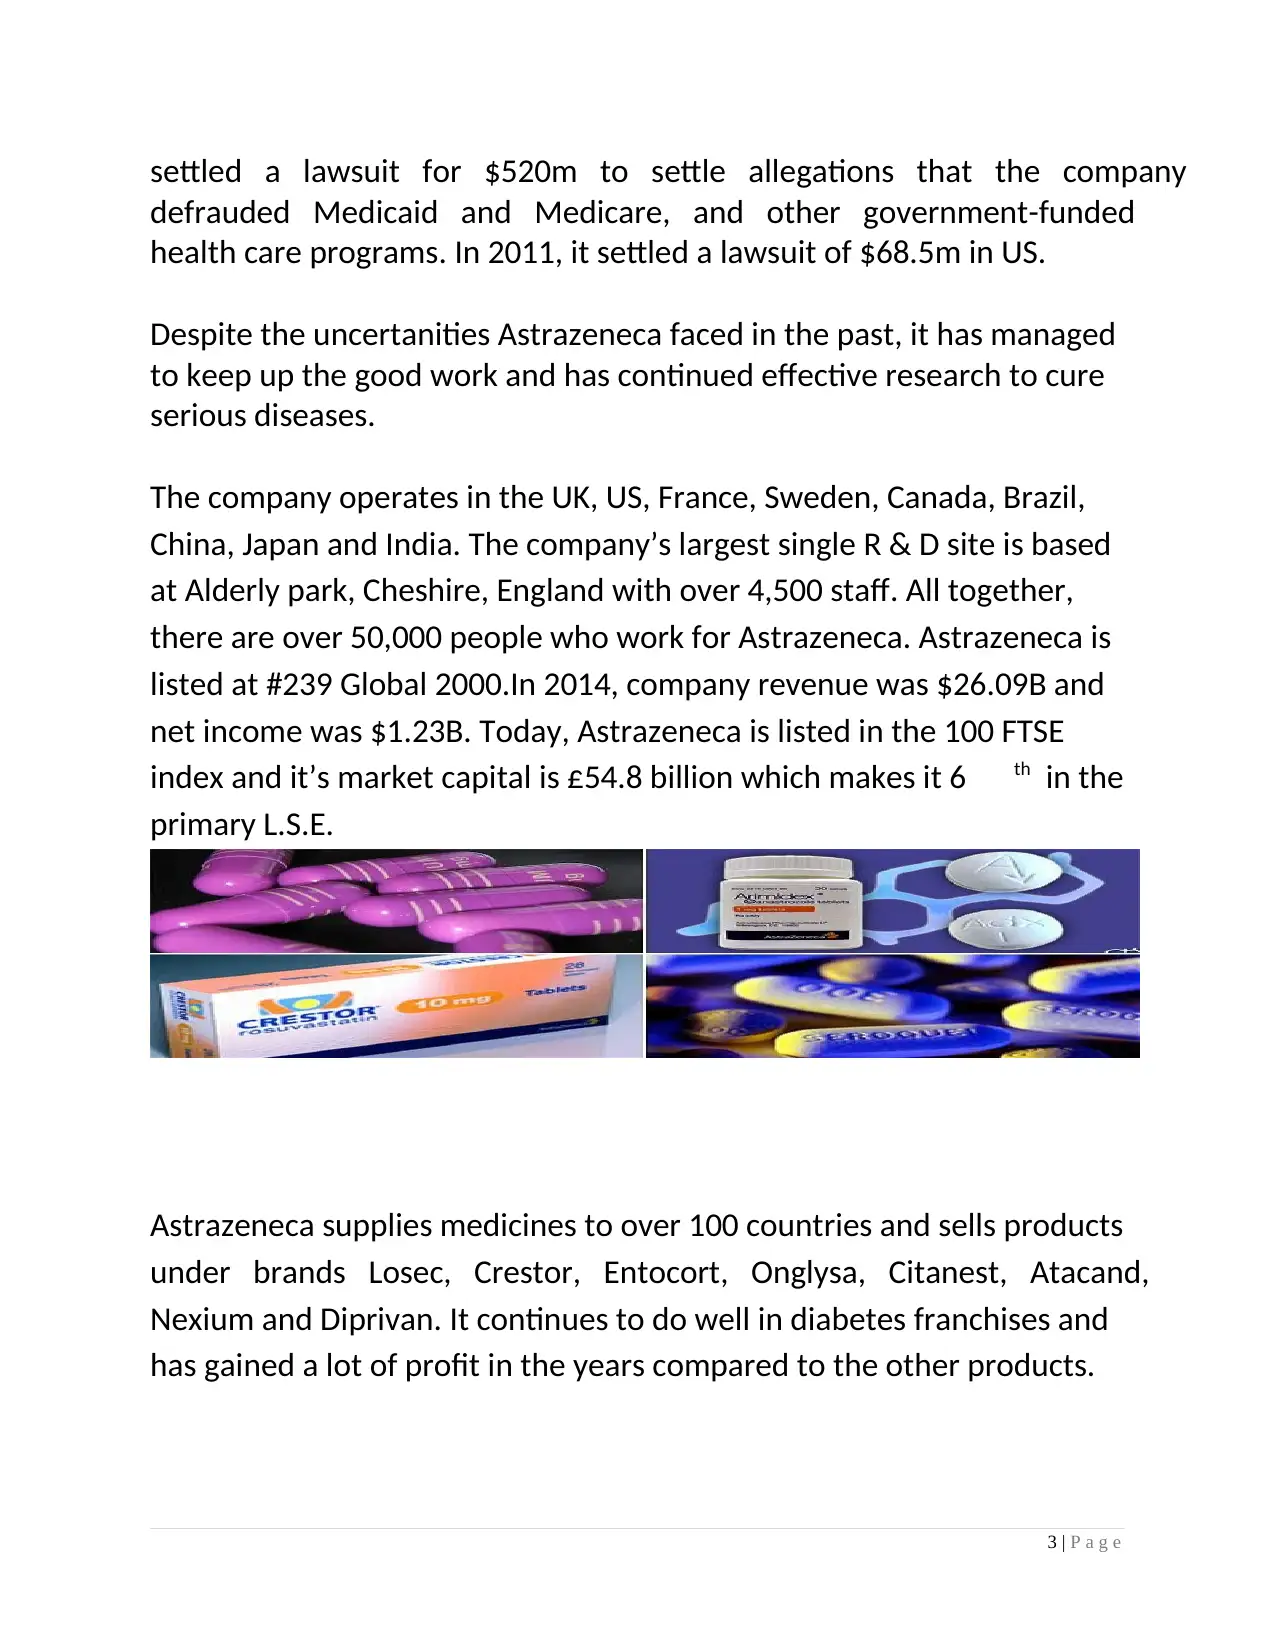
Astrazeneca supplies medicines to over 100 countries and sells products
under brands Losec, Crestor, Entocort, Onglysa, Citanest, Atacand,
Nexium and Diprivan. It continues to do well in diabetes franchises and
has gained a lot of profit in the years compared to the other products.
3 | P a g e
defrauded Medicaid and Medicare, and other government-funded
health care programs. In 2011, it settled a lawsuit of $68.5m in US.
Despite the uncertanities Astrazeneca faced in the past, it has managed
to keep up the good work and has continued effective research to cure
serious diseases.
The company operates in the UK, US, France, Sweden, Canada, Brazil,
China, Japan and India. The company’s largest single R & D site is based
at Alderly park, Cheshire, England with over 4,500 staff. All together,
there are over 50,000 people who work for Astrazeneca. Astrazeneca is
listed at #239 Global 2000.In 2014, company revenue was $26.09B and
net income was $1.23B. Today, Astrazeneca is listed in the 100 FTSE
index and it’s market capital is £54.8 billion which makes it 6 th in the
primary L.S.E.
Astrazeneca supplies medicines to over 100 countries and sells products
under brands Losec, Crestor, Entocort, Onglysa, Citanest, Atacand,
Nexium and Diprivan. It continues to do well in diabetes franchises and
has gained a lot of profit in the years compared to the other products.
3 | P a g e
Paraphrase This Document
Need a fresh take? Get an instant paraphrase of this document with our AI Paraphraser
2.FINANCIAL PERFORMANCE AND POSITION:
Any company’s financial performance can be understood from the
financial statements issued by the company at the end of the fiscal year.
Current financial standings of this organisation are shown in these
statements. There is also an analysis carried out after a critical calculation
of various ratios such as Profitability, Liquidity, Effeciency ratios and so on.
Furthermore, these statements and ratios also help the shareholders and
the investors to understand the financial position of the company and
decide whether to invest or not.
We will now discuss some of these ratios to understand the financial
performance and position of Astrazeneca plc.
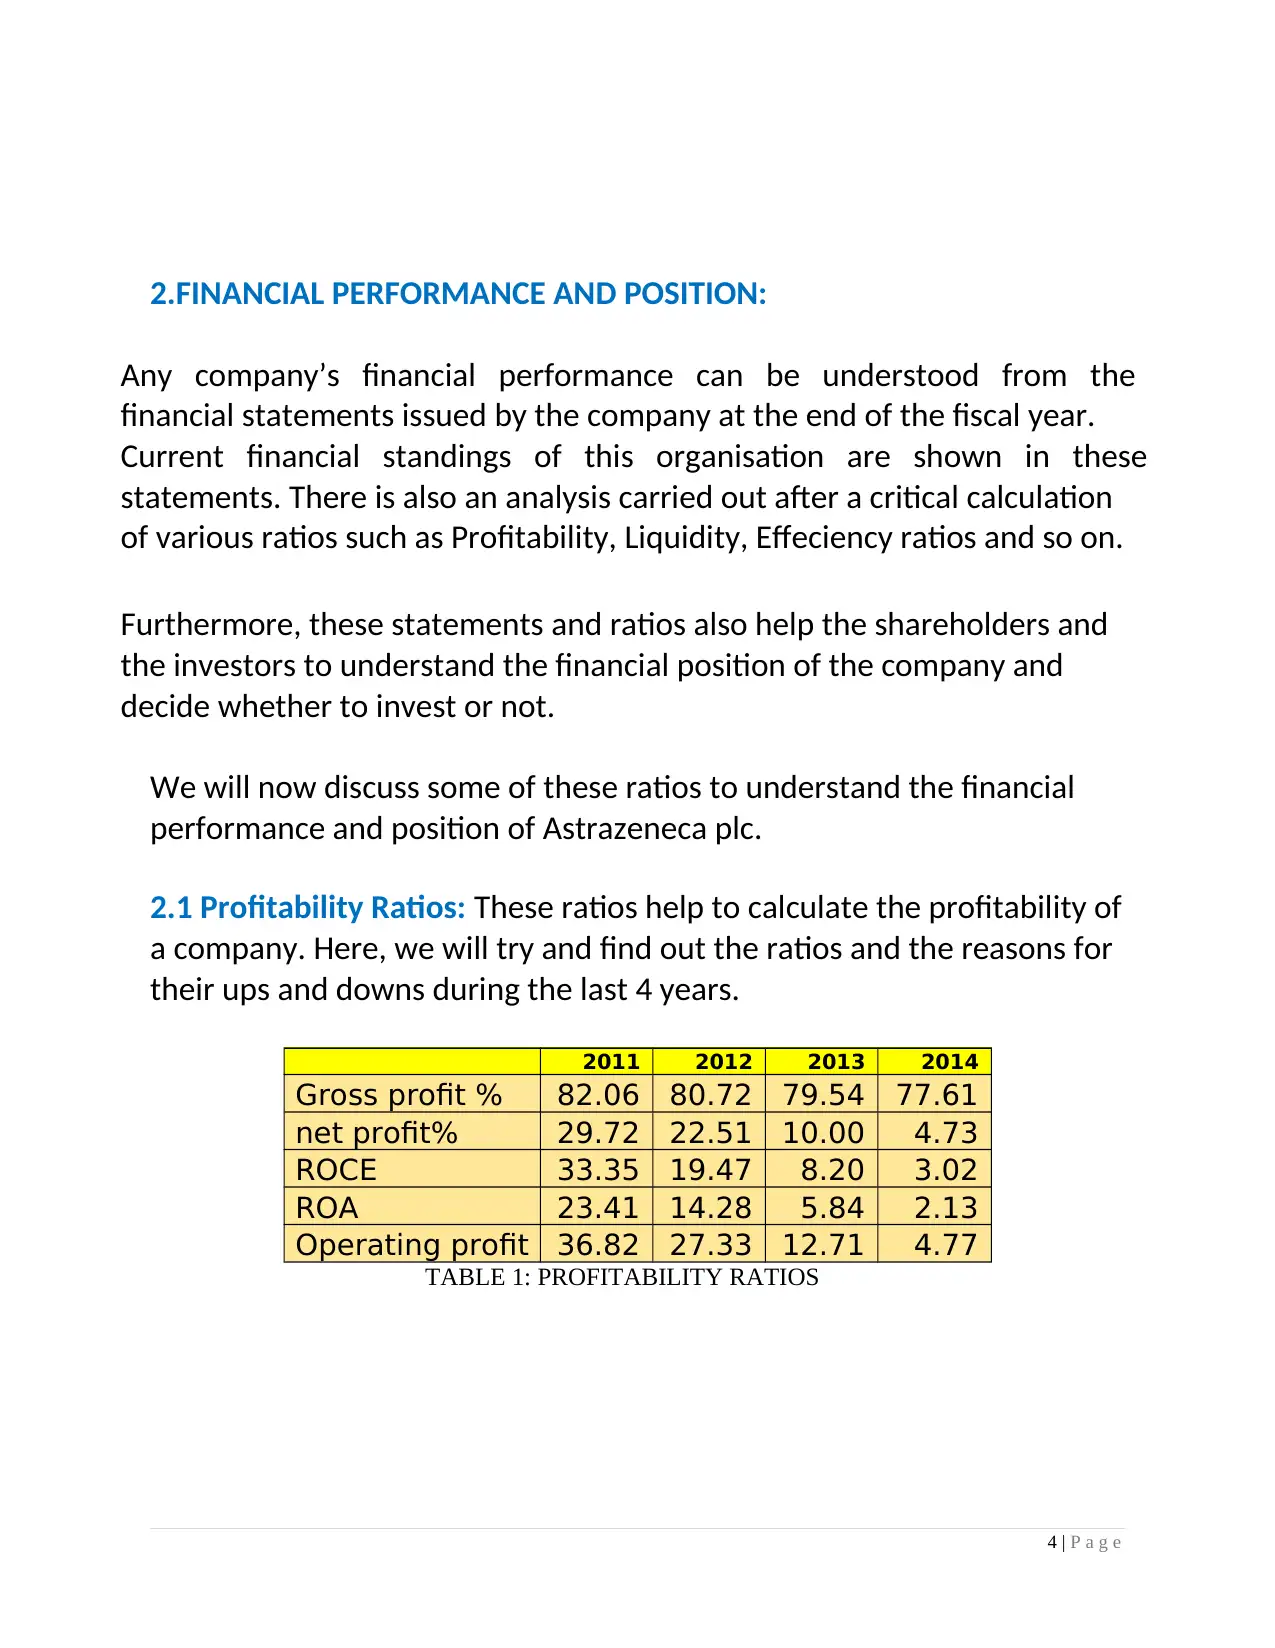
2.1 Profitability Ratios: These ratios help to calculate the profitability of
a company. Here, we will try and find out the ratios and the reasons for
their ups and downs during the last 4 years.
2011 2012 2013 2014
Gross profit % 82.06 80.72 79.54 77.61
net profit% 29.72 22.51 10.00 4.73
ROCE 33.35 19.47 8.20 3.02
ROA 23.41 14.28 5.84 2.13
Operating profit 36.82 27.33 12.71 4.77
TABLE 1: PROFITABILITY RATIOS
4 | P a g e
Any company’s financial performance can be understood from the
financial statements issued by the company at the end of the fiscal year.
Current financial standings of this organisation are shown in these
statements. There is also an analysis carried out after a critical calculation
of various ratios such as Profitability, Liquidity, Effeciency ratios and so on.
Furthermore, these statements and ratios also help the shareholders and
the investors to understand the financial position of the company and
decide whether to invest or not.
We will now discuss some of these ratios to understand the financial
performance and position of Astrazeneca plc.
2.1 Profitability Ratios: These ratios help to calculate the profitability of
a company. Here, we will try and find out the ratios and the reasons for
their ups and downs during the last 4 years.
2011 2012 2013 2014
Gross profit % 82.06 80.72 79.54 77.61
net profit% 29.72 22.51 10.00 4.73
ROCE 33.35 19.47 8.20 3.02
ROA 23.41 14.28 5.84 2.13
Operating profit 36.82 27.33 12.71 4.77
TABLE 1: PROFITABILITY RATIOS
4 | P a g e
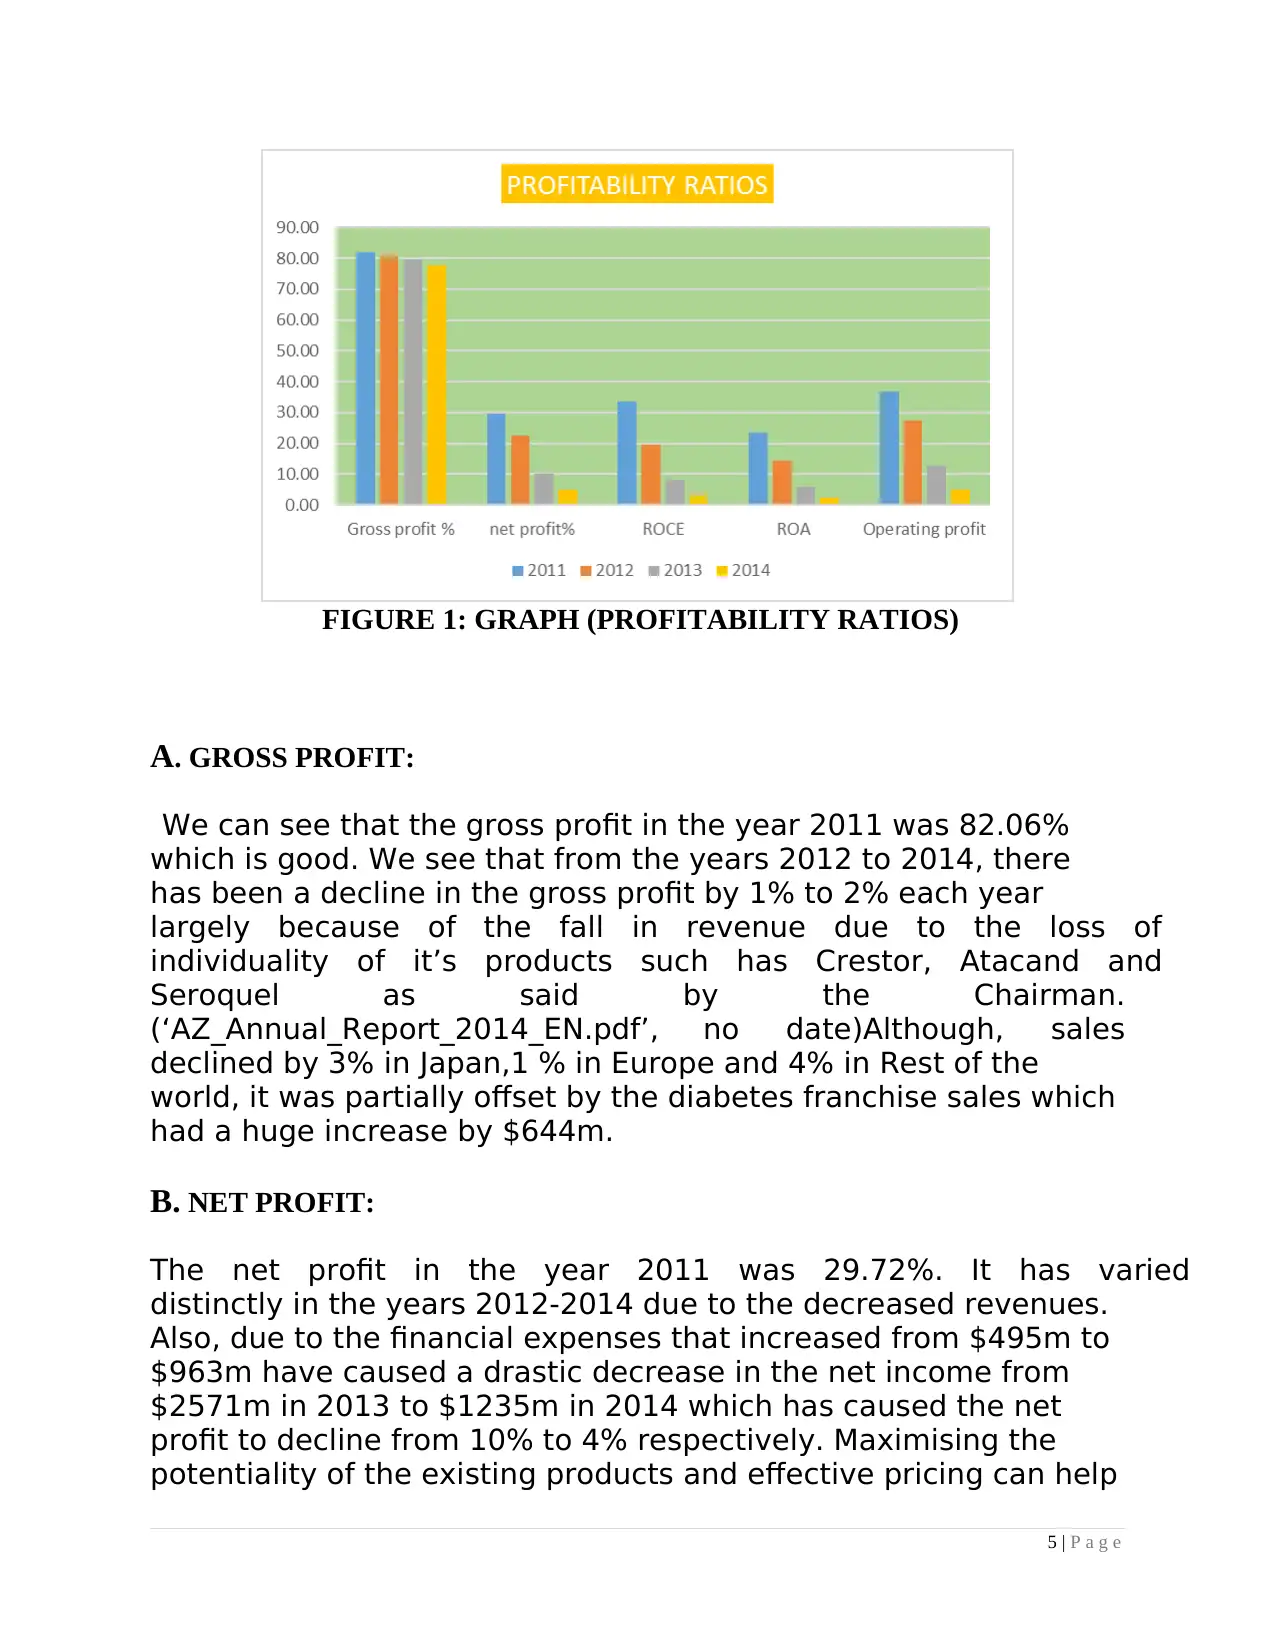
FIGURE 1: GRAPH (PROFITABILITY RATIOS)
A. GROSS PROFIT:
We can see that the gross profit in the year 2011 was 82.06%
which is good. We see that from the years 2012 to 2014, there
has been a decline in the gross profit by 1% to 2% each year
largely because of the fall in revenue due to the loss of
individuality of it’s products such has Crestor, Atacand and
Seroquel as said by the Chairman.
(‘AZ_Annual_Report_2014_EN.pdf’, no date)Although, sales
declined by 3% in Japan,1 % in Europe and 4% in Rest of the
world, it was partially offset by the diabetes franchise sales which
had a huge increase by $644m.
B. NET PROFIT:
The net profit in the year 2011 was 29.72%. It has varied
distinctly in the years 2012-2014 due to the decreased revenues.
Also, due to the financial expenses that increased from $495m to
$963m have caused a drastic decrease in the net income from
$2571m in 2013 to $1235m in 2014 which has caused the net
profit to decline from 10% to 4% respectively. Maximising the
potentiality of the existing products and effective pricing can help
5 | P a g e
⊘ This is a preview!⊘
Do you want full access?
Subscribe today to unlock all pages.
Trusted by 1+ million students worldwide
the in the improvement of net profit.
C. RETURN ON CAPITAL EMPLOYED:
This ratio is used for the comparison of the profits of the
competing companies through the capital used by them.
We can see that the ROCE of Astrazeneca has been
decreasing from 2011 to 2014 which was 33.35% and
3.02% respectively. In my analysis, the ROCE has
declined due to less profits made and also the acquisitons
of Pearl Therapeutics for $569million, 100% of Omthera
pharmaceutical’s shares for $323million. Also, there was
an acquisition of Almirall Sofotec for $878million was
made in 2014. High investments tend to produce low
return on capital than the existing business.
D. RETURN ON ASSETS:
This ratio helps us to understand whether how profitable
a company is with relation to their assets. We can see
that Astrazeneca’s ROA has been low from 2012 to 2014
i.e 14.28% and 2.13% respectively. The reason for this
has been the share of after tax losses in it’s joint ventures
and also the financial expenses have been more in the
year 2014 of $963 million which has led to a decline in
the profit before tax.
6 | P a g e
Paraphrase This Document
Need a fresh take? Get an instant paraphrase of this document with our AI Paraphraser
E. OPERATING PROFIT:
The operating profit from 2011 to 2014 was 36.82% to
4.77% respectively. The decline of operating profit was
due to the expenditure associated with the growth
platforms such as research and development expenses of
$5579m in 2014.The increase in selling, administrative
and distribution costs have led to a decline in the net
operating margin. One of the reasons for this is the
denominations in the currencies as the cash is converted
and held in US dollars. Thus, operating profit can be
affected in US dollars by movement in exchange rates.
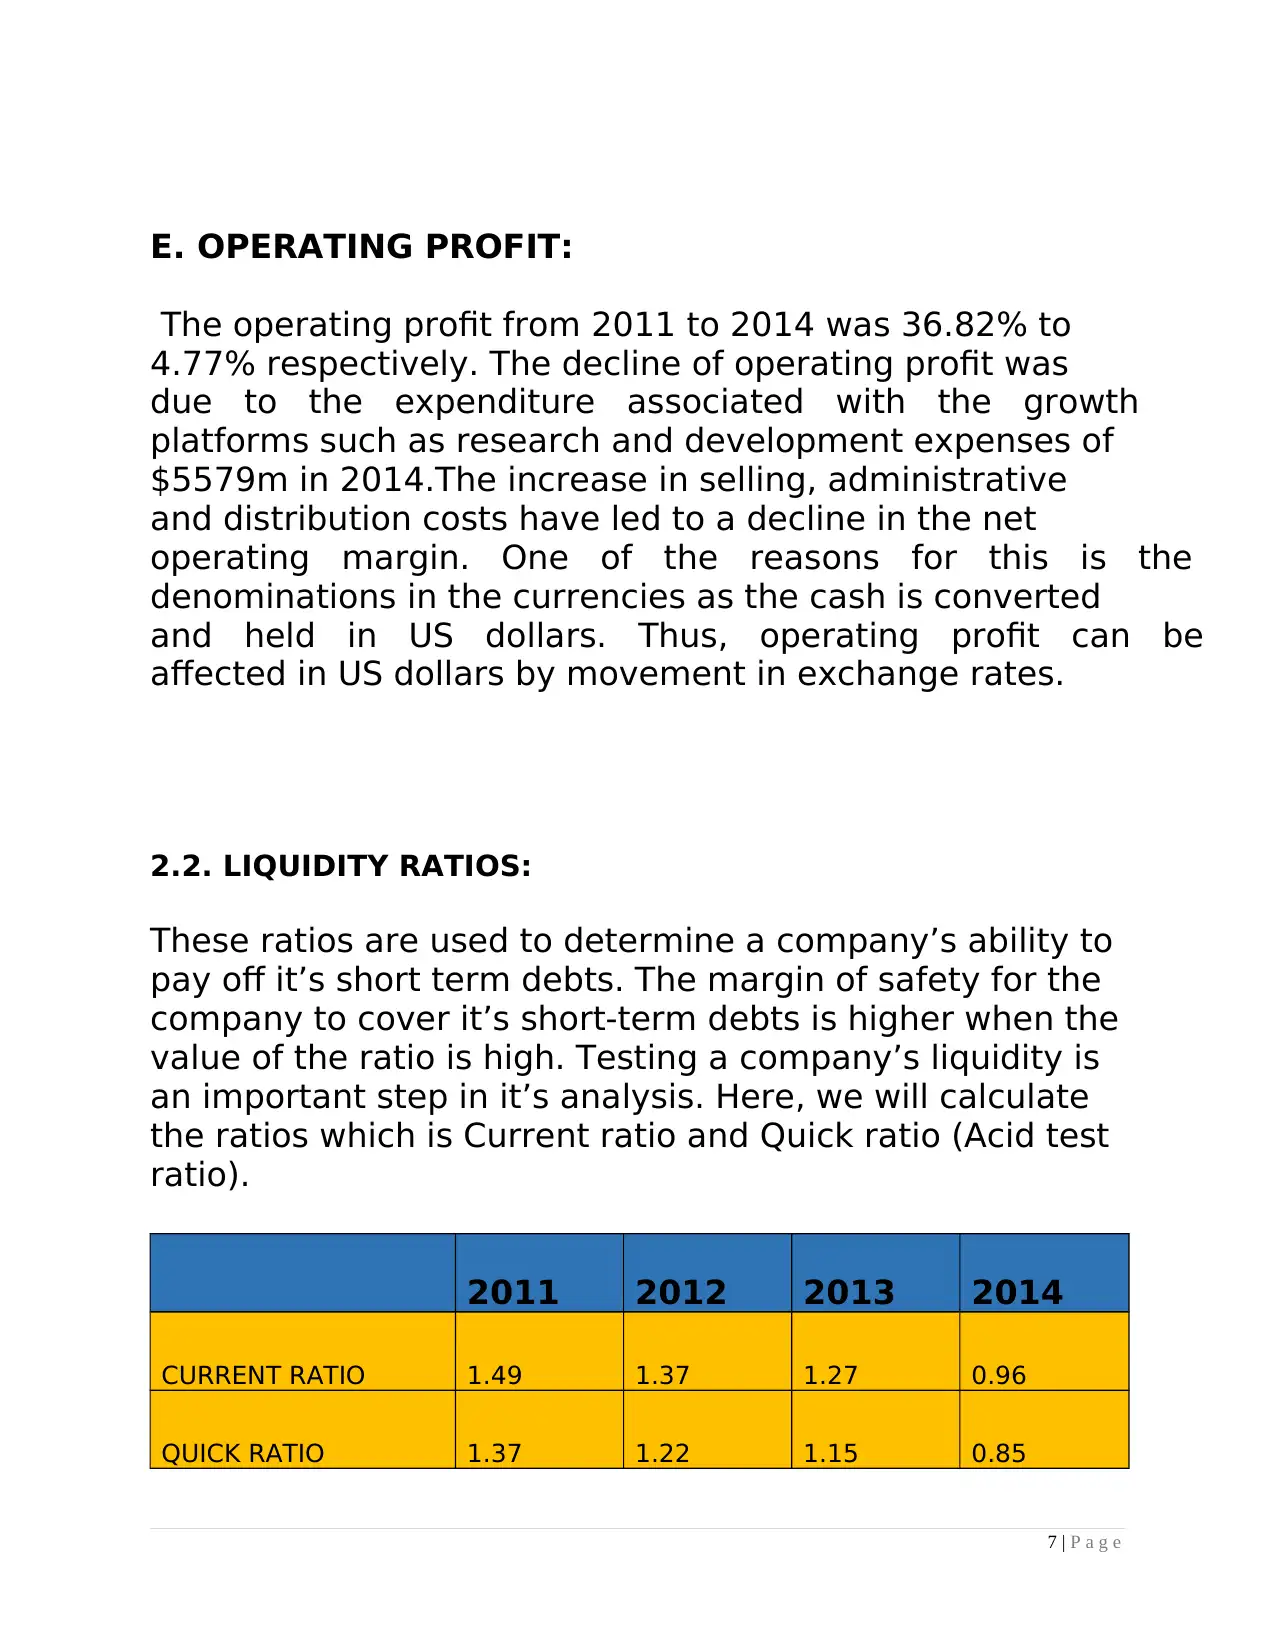
2.2. LIQUIDITY RATIOS:
These ratios are used to determine a company’s ability to
pay off it’s short term debts. The margin of safety for the
company to cover it’s short-term debts is higher when the
value of the ratio is high. Testing a company’s liquidity is
an important step in it’s analysis. Here, we will calculate
the ratios which is Current ratio and Quick ratio (Acid test
ratio).
2011 2012 2013 2014
CURRENT RATIO 1.49 1.37 1.27 0.96
QUICK RATIO 1.37 1.22 1.15 0.85
7 | P a g e
The operating profit from 2011 to 2014 was 36.82% to
4.77% respectively. The decline of operating profit was
due to the expenditure associated with the growth
platforms such as research and development expenses of
$5579m in 2014.The increase in selling, administrative
and distribution costs have led to a decline in the net
operating margin. One of the reasons for this is the
denominations in the currencies as the cash is converted
and held in US dollars. Thus, operating profit can be
affected in US dollars by movement in exchange rates.
2.2. LIQUIDITY RATIOS:
These ratios are used to determine a company’s ability to
pay off it’s short term debts. The margin of safety for the
company to cover it’s short-term debts is higher when the
value of the ratio is high. Testing a company’s liquidity is
an important step in it’s analysis. Here, we will calculate
the ratios which is Current ratio and Quick ratio (Acid test
ratio).
2011 2012 2013 2014
CURRENT RATIO 1.49 1.37 1.27 0.96
QUICK RATIO 1.37 1.22 1.15 0.85
7 | P a g e
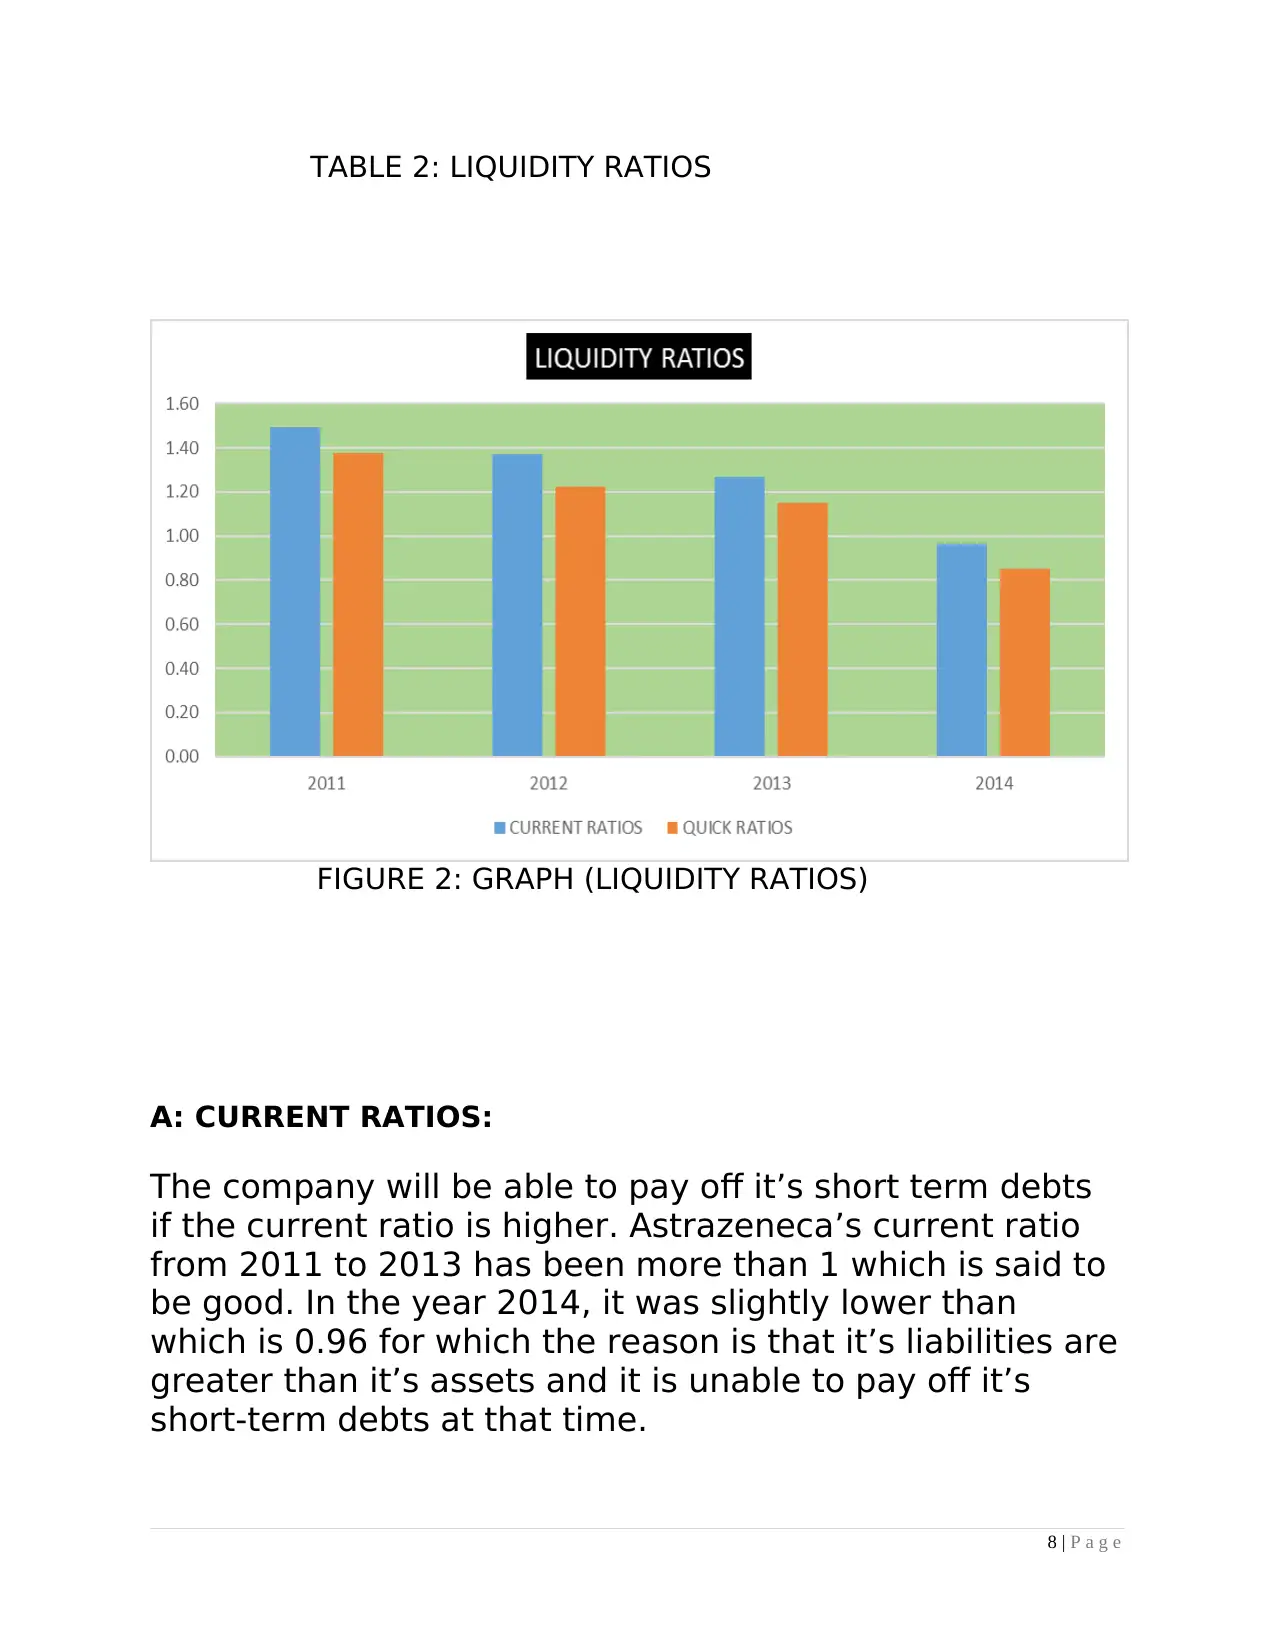
TABLE 2: LIQUIDITY RATIOS
FIGURE 2: GRAPH (LIQUIDITY RATIOS)
A: CURRENT RATIOS:
The company will be able to pay off it’s short term debts
if the current ratio is higher. Astrazeneca’s current ratio
from 2011 to 2013 has been more than 1 which is said to
be good. In the year 2014, it was slightly lower than
which is 0.96 for which the reason is that it’s liabilities are
greater than it’s assets and it is unable to pay off it’s
short-term debts at that time.
8 | P a g e
⊘ This is a preview!⊘
Do you want full access?
Subscribe today to unlock all pages.
Trusted by 1+ million students worldwide
B: QUICK RATIOS: (ACID-TEST RATIOS)
This ratio is the division of the current assets and current
liabilities by subtracting the stock(inventories). Similar to
the current ratio, Astrazeneca’s quick ratio from 2011 to
2013 has been more than 1 which means that it has the
liquid assets to pay it’s current liabilities. However, in the
year 2014, the quick ratio has been less than 1 which is
0.85% which is the reason it may not have been able to
pay it’s current liabilities. There are other reasons for this
which could be that the current liabilities such as the
trade payables, income tax , loans, provisions etc have
been more than the current assets such as the trade
receivables, income tax receivable etc.
Hence, as per my analysis from the financial statements,
if the current liabilities are controlled, it will be good for
the company.
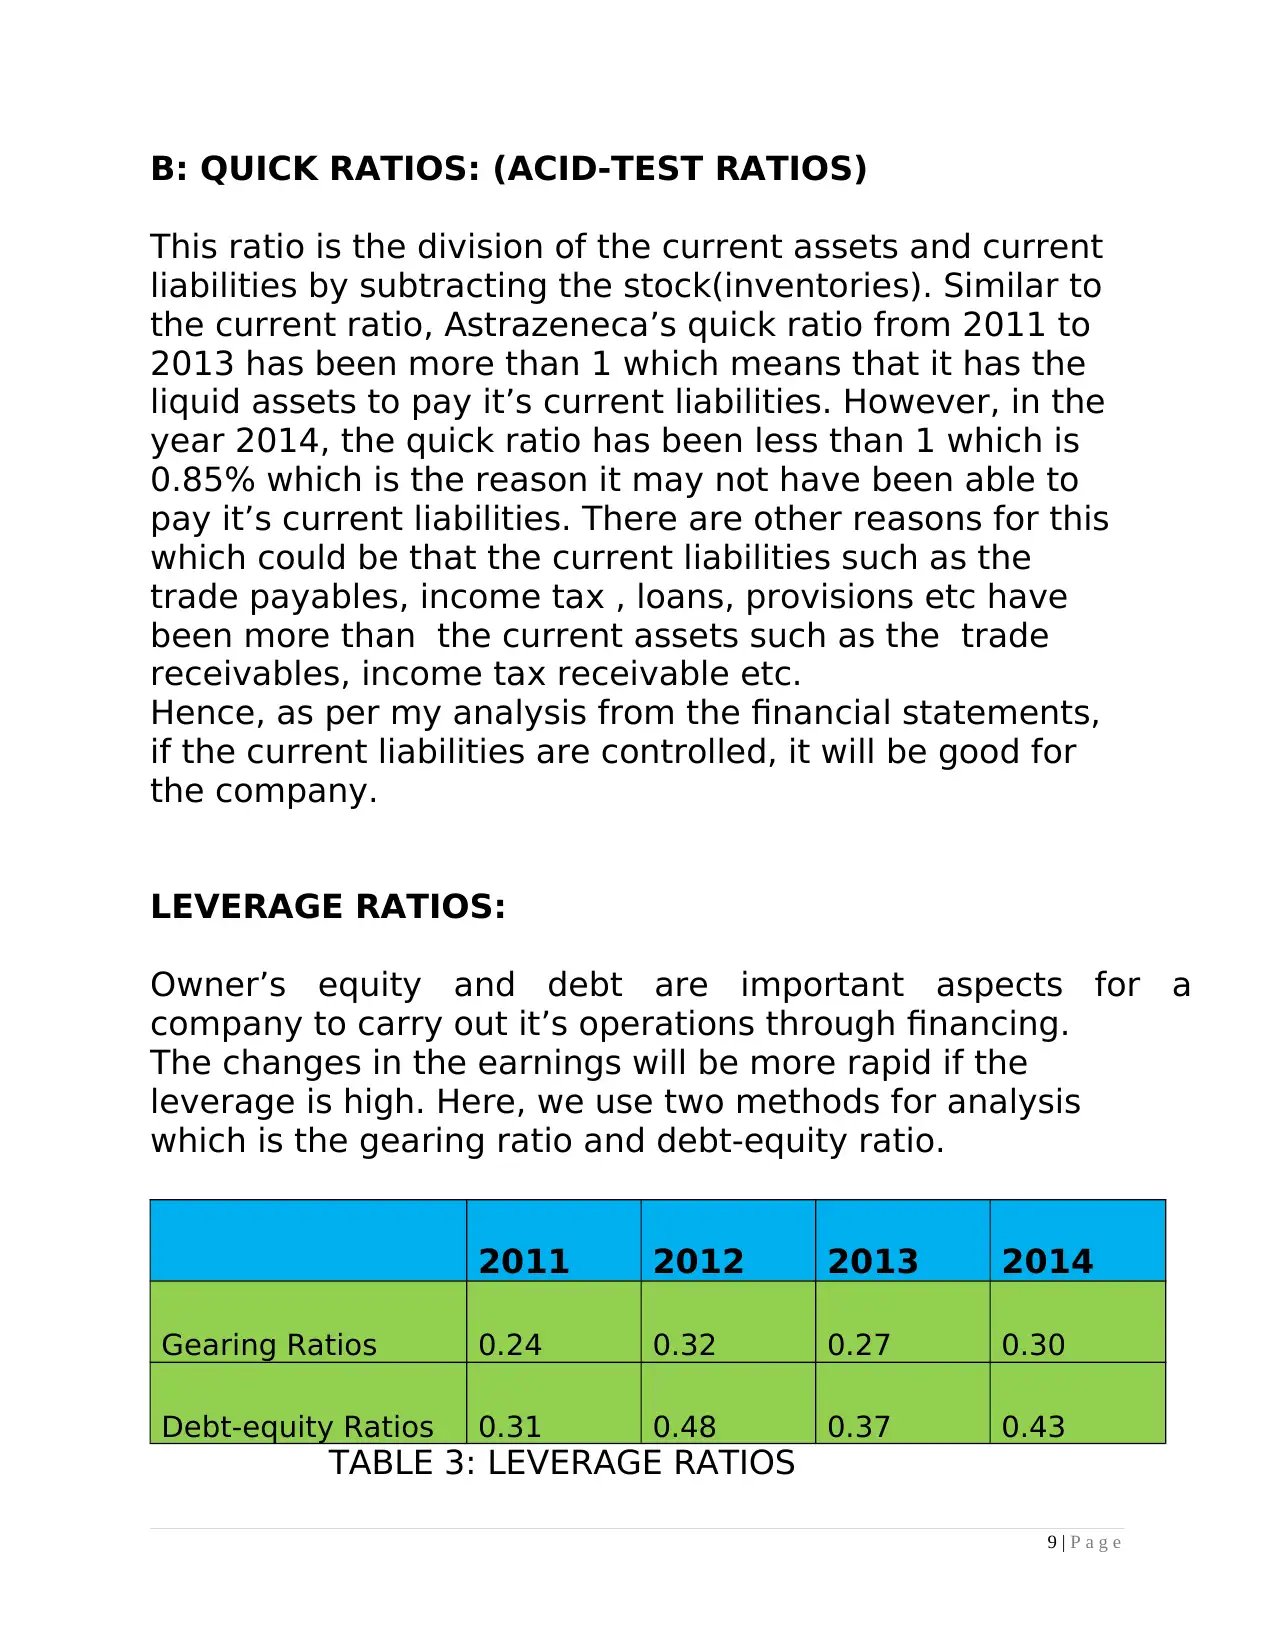
LEVERAGE RATIOS:
Owner’s equity and debt are important aspects for a
company to carry out it’s operations through financing.
The changes in the earnings will be more rapid if the
leverage is high. Here, we use two methods for analysis
which is the gearing ratio and debt-equity ratio.
2011 2012 2013 2014
Gearing Ratios 0.24 0.32 0.27 0.30
Debt-equity Ratios 0.31 0.48 0.37 0.43
TABLE 3: LEVERAGE RATIOS
9 | P a g e
This ratio is the division of the current assets and current
liabilities by subtracting the stock(inventories). Similar to
the current ratio, Astrazeneca’s quick ratio from 2011 to
2013 has been more than 1 which means that it has the
liquid assets to pay it’s current liabilities. However, in the
year 2014, the quick ratio has been less than 1 which is
0.85% which is the reason it may not have been able to
pay it’s current liabilities. There are other reasons for this
which could be that the current liabilities such as the
trade payables, income tax , loans, provisions etc have
been more than the current assets such as the trade
receivables, income tax receivable etc.
Hence, as per my analysis from the financial statements,
if the current liabilities are controlled, it will be good for
the company.
LEVERAGE RATIOS:
Owner’s equity and debt are important aspects for a
company to carry out it’s operations through financing.
The changes in the earnings will be more rapid if the
leverage is high. Here, we use two methods for analysis
which is the gearing ratio and debt-equity ratio.
2011 2012 2013 2014
Gearing Ratios 0.24 0.32 0.27 0.30
Debt-equity Ratios 0.31 0.48 0.37 0.43
TABLE 3: LEVERAGE RATIOS
9 | P a g e
Paraphrase This Document
Need a fresh take? Get an instant paraphrase of this document with our AI Paraphraser
FIGURE 3:GRAPH (LEVERAGE RATIOS)
A.GEARING RATIOS:
A company is considered more risky if it’s degree of
leverage is high. Also, if the gearing is high, the company
is prone to the downward side of the business cycle as it
has to continue to service it’s debt even if the sales are
bad. There have been ups and downs from year 2011 to
2013 with regards to the equity and debt. In year 2014,
there was a fall in both equity and debt which resulted in
gearing ratio to be higher which is 0.30% compared to
2013 which was 0.27%. Overall, the gearing ratios have
been low and in my analysis of the financial statements
the reason for this is that Astrazeneca requires more
redemption capital because of the merger acquisition it
has had and also the earnings need to be increased.
10 | P a g e
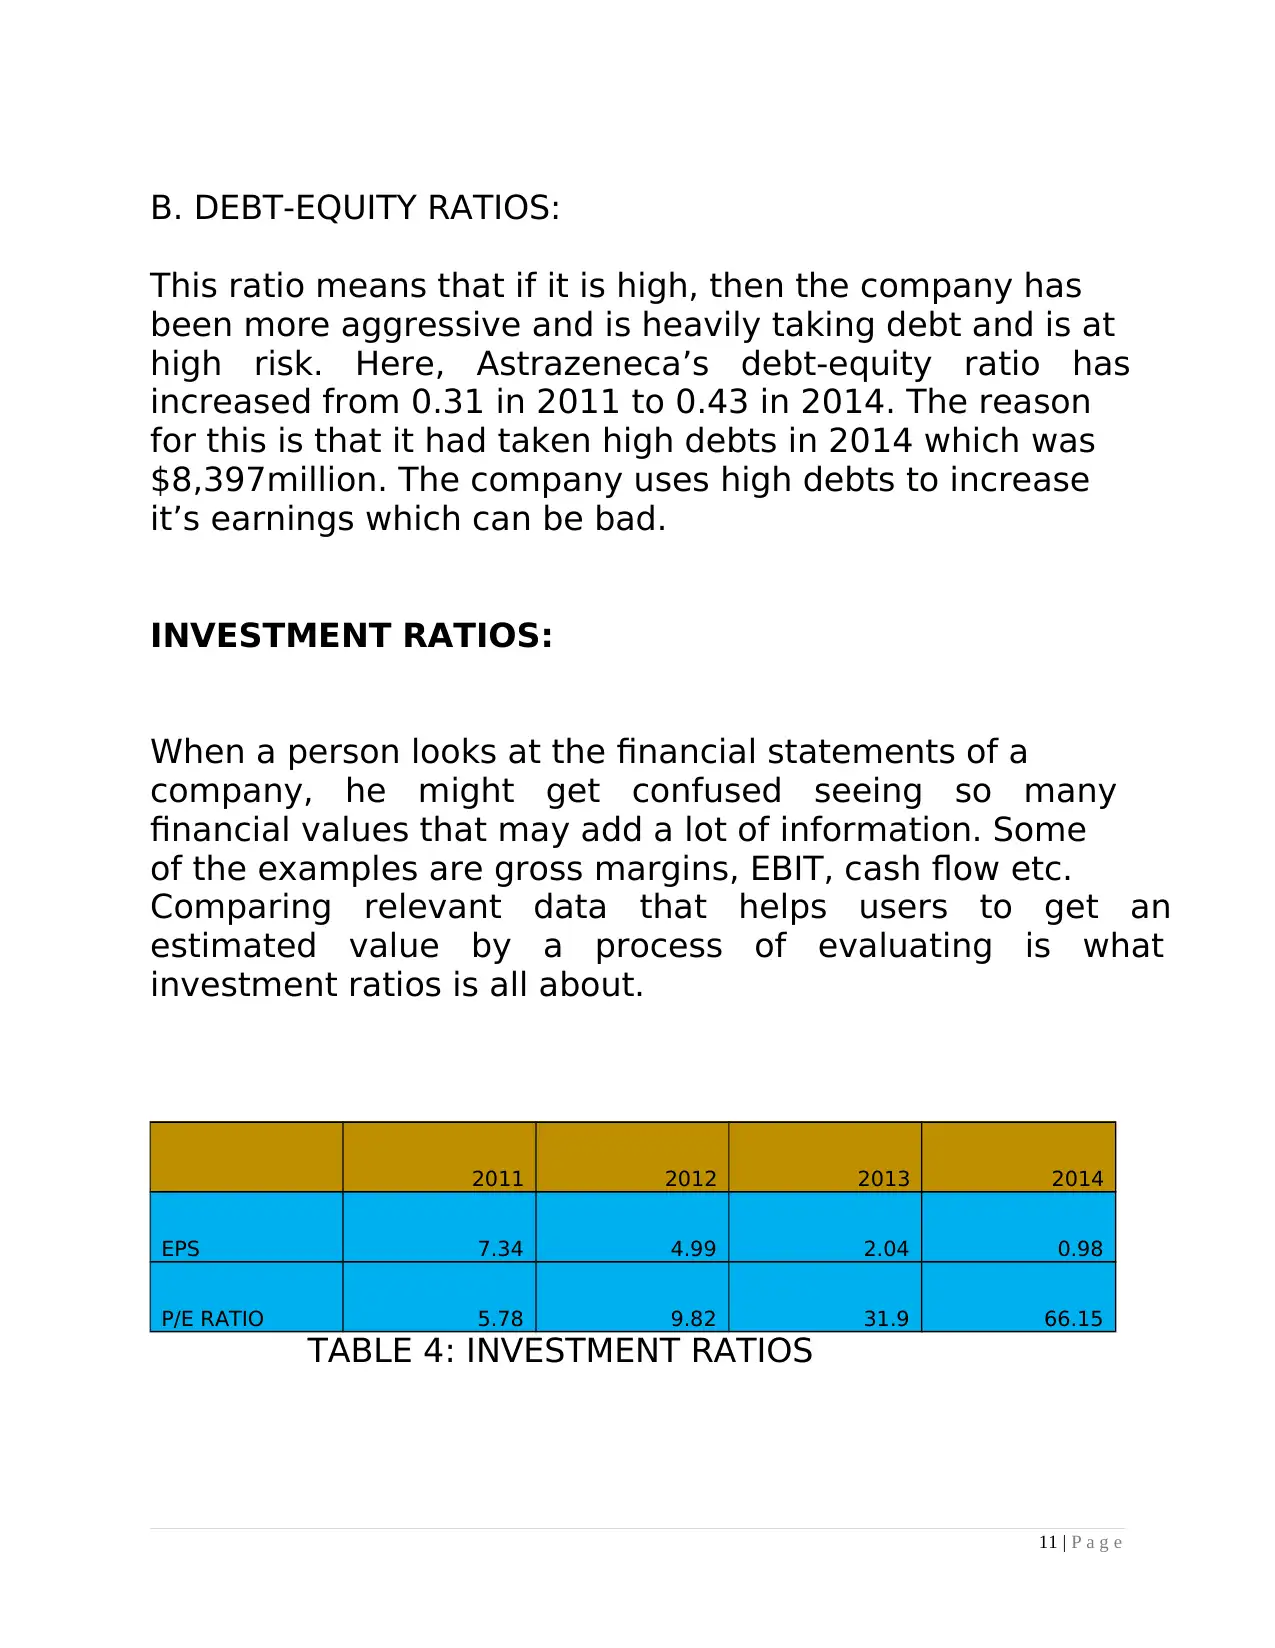
B. DEBT-EQUITY RATIOS:
This ratio means that if it is high, then the company has
been more aggressive and is heavily taking debt and is at
high risk. Here, Astrazeneca’s debt-equity ratio has
increased from 0.31 in 2011 to 0.43 in 2014. The reason
for this is that it had taken high debts in 2014 which was
$8,397million. The company uses high debts to increase
it’s earnings which can be bad.
INVESTMENT RATIOS:
When a person looks at the financial statements of a
company, he might get confused seeing so many
financial values that may add a lot of information. Some
of the examples are gross margins, EBIT, cash flow etc.
Comparing relevant data that helps users to get an
estimated value by a process of evaluating is what
investment ratios is all about.
2011 2012 2013 2014
EPS 7.34 4.99 2.04 0.98
P/E RATIO 5.78 9.82 31.9 66.15
TABLE 4: INVESTMENT RATIOS
11 | P a g e
⊘ This is a preview!⊘
Do you want full access?
Subscribe today to unlock all pages.
Trusted by 1+ million students worldwide
1 out of 29
Your All-in-One AI-Powered Toolkit for Academic Success.
+13062052269
info@desklib.com
Available 24*7 on WhatsApp / Email
![[object Object]](/_next/static/media/star-bottom.7253800d.svg)
Unlock your academic potential
Copyright © 2020–2026 A2Z Services. All Rights Reserved. Developed and managed by ZUCOL.