Financial Analysis Report: XYZ Investment - Tender Review and Decision

Verified

Added on  2022/10/19

|9
|1888
|36
Report
AI Summary
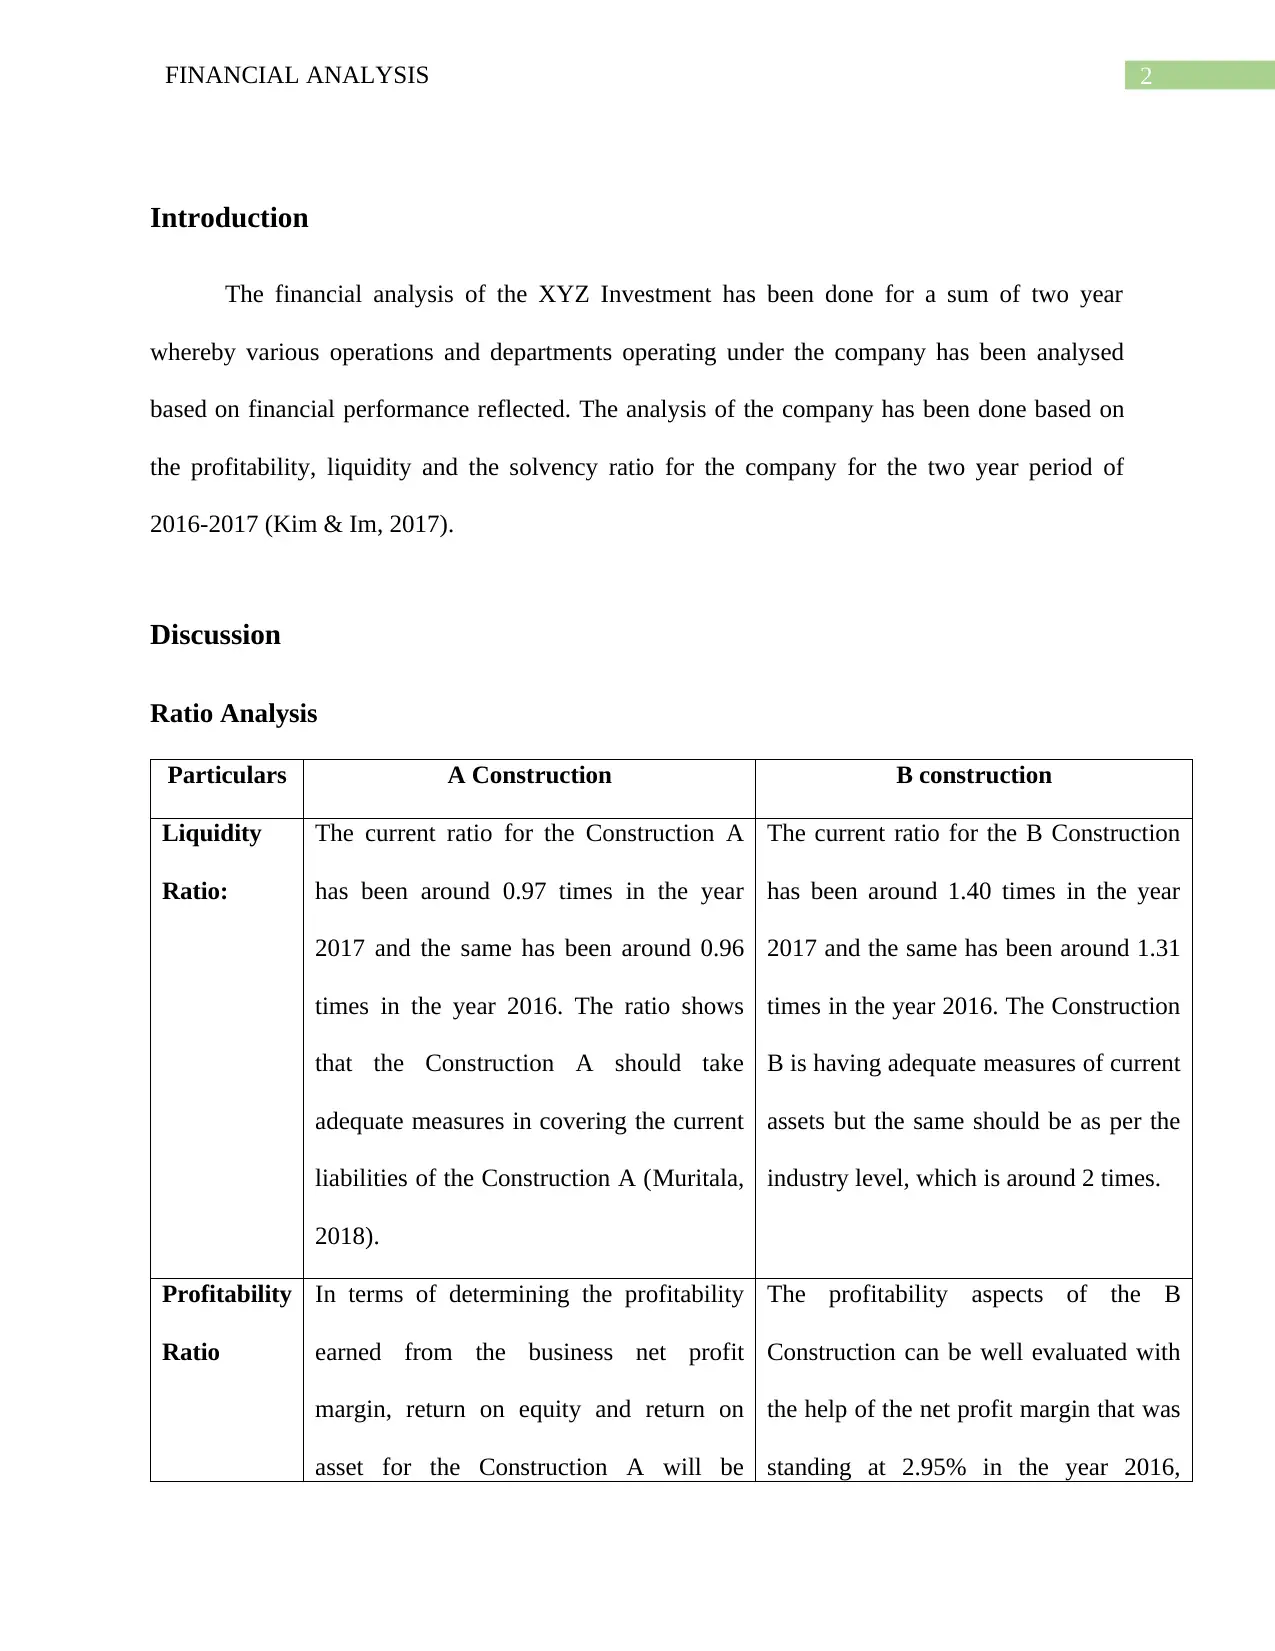
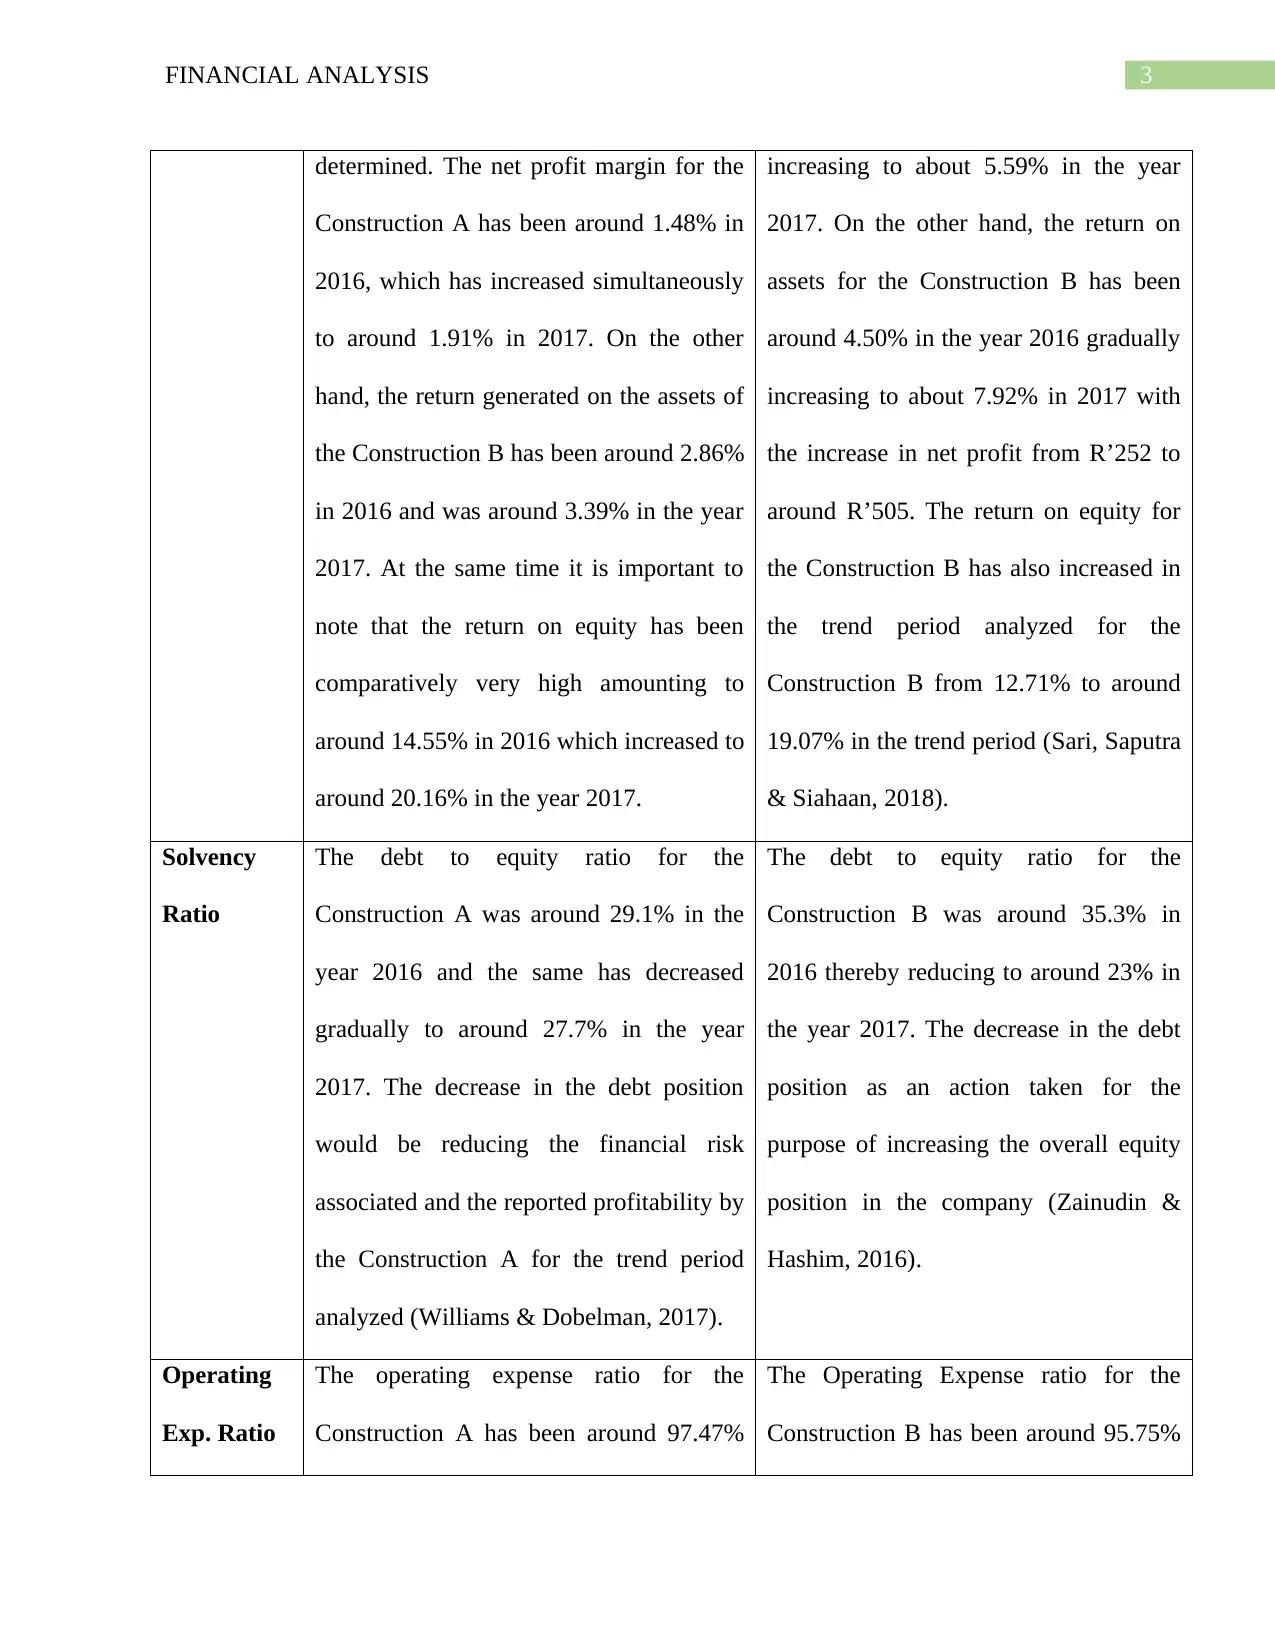
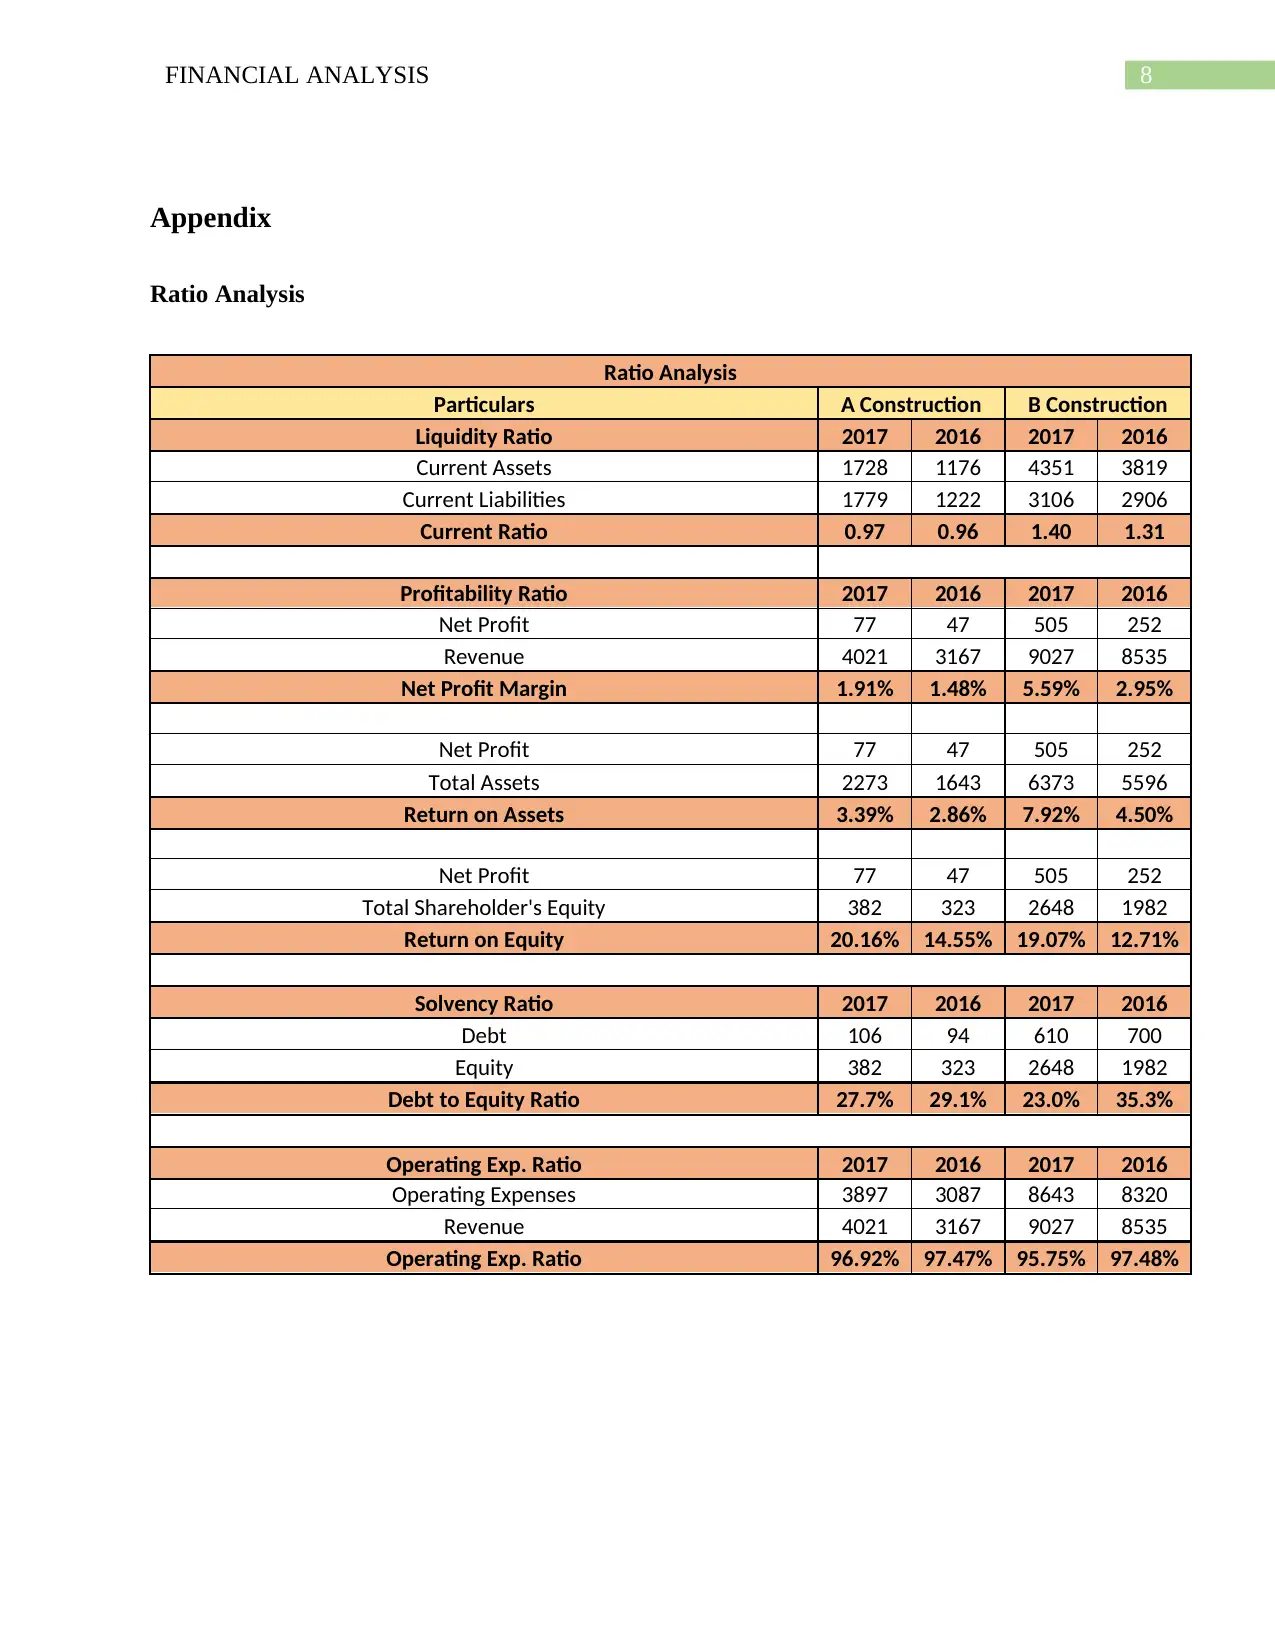
This report presents a comprehensive financial analysis of XYZ Investment, focusing on the performance of two construction companies, A Construction and B Construction, for the years 2016 and 2017. The analysis encompasses a detailed examination of liquidity, profitability, and solvency ratios, including current ratios, net profit margins, return on assets, return on equity, and debt-to-equity ratios. The report also considers operating expense ratios and earnings per share (EPS) for each construction unit. Financial considerations, such as tender prices and return on investment (ROI), are evaluated to determine the best investment option. Non-financial considerations, including employee base, business risk, and financial stability, are also addressed. The report concludes with a recommendation to invest in Construction B due to its superior financial performance and position, supported by a comparative analysis of key financial metrics and risk factors.
tabler-icon-diamond-filled.svg

Contribute Materials

Your contribution can guide someone’s learning journey. Share your documents today.
Document Page
Running head: ACCOUNTING FINANCIAL ANALYSIS REPORT
Financial Analysis
Name of the Student:
Name of the University:
Author’s Note:
tabler-icon-diamond-filled.svg

Secure Best Marks with AI Grader

Need help grading? Try our AI Grader for instant feedback on your assignments.
Document Page
1FINANCIAL ANALYSIS
Table of Contents
Introduction......................................................................................................................................2
Discussion........................................................................................................................................2
Ratio Analysis..............................................................................................................................2
Financial Considerations.............................................................................................................4
Non-Financial Considerations.....................................................................................................5
Conclusion.......................................................................................................................................6
References........................................................................................................................................7
Appendix..........................................................................................................................................8
Document Page
2FINANCIAL ANALYSIS
Introduction
The financial analysis of the XYZ Investment has been done for a sum of two year
whereby various operations and departments operating under the company has been analysed
based on financial performance reflected. The analysis of the company has been done based on
the profitability, liquidity and the solvency ratio for the company for the two year period of
2016-2017 (Kim & Im, 2017).
Discussion
Ratio Analysis
Particulars A Construction B construction
Liquidity
Ratio:
The current ratio for the Construction A
has been around 0.97 times in the year
2017 and the same has been around 0.96
times in the year 2016. The ratio shows
that the Construction A should take
adequate measures in covering the current
liabilities of the Construction A (Muritala,
2018).
The current ratio for the B Construction
has been around 1.40 times in the year
2017 and the same has been around 1.31
times in the year 2016. The Construction
B is having adequate measures of current
assets but the same should be as per the
industry level, which is around 2 times.
Profitability
Ratio
In terms of determining the profitability
earned from the business net profit
margin, return on equity and return on
asset for the Construction A will be
The profitability aspects of the B
Construction can be well evaluated with
the help of the net profit margin that was
standing at 2.95% in the year 2016,
Document Page
3FINANCIAL ANALYSIS
determined. The net profit margin for the
Construction A has been around 1.48% in
2016, which has increased simultaneously
to around 1.91% in 2017. On the other
hand, the return generated on the assets of
the Construction B has been around 2.86%
in 2016 and was around 3.39% in the year
2017. At the same time it is important to
note that the return on equity has been
comparatively very high amounting to
around 14.55% in 2016 which increased to
around 20.16% in the year 2017.
increasing to about 5.59% in the year
2017. On the other hand, the return on
assets for the Construction B has been
around 4.50% in the year 2016 gradually
increasing to about 7.92% in 2017 with
the increase in net profit from R’252 to
around R’505. The return on equity for
the Construction B has also increased in
the trend period analyzed for the
Construction B from 12.71% to around
19.07% in the trend period (Sari, Saputra
& Siahaan, 2018).
Solvency
Ratio
The debt to equity ratio for the
Construction A was around 29.1% in the
year 2016 and the same has decreased
gradually to around 27.7% in the year
2017. The decrease in the debt position
would be reducing the financial risk
associated and the reported profitability by
the Construction A for the trend period
analyzed (Williams & Dobelman, 2017).
The debt to equity ratio for the
Construction B was around 35.3% in
2016 thereby reducing to around 23% in
the year 2017. The decrease in the debt
position as an action taken for the
purpose of increasing the overall equity
position in the company (Zainudin &
Hashim, 2016).
Operating
Exp. Ratio
The operating expense ratio for the
Construction A has been around 97.47%
The Operating Expense ratio for the
Construction B has been around 95.75%
tabler-icon-diamond-filled.svg

Secure Best Marks with AI Grader

Need help grading? Try our AI Grader for instant feedback on your assignments.
Document Page
4FINANCIAL ANALYSIS
in the year 2016 and the same was around
96.92% in the year 2017. The high amount
of reported operating expenses ratio for
the company in the trend period analyzed
will be leaving the company with a very
limited amount of net profit. It is
important that the company undertake
various course of action and plans for the
purpose of reducing the operating
expenses of the company.
in the year 2017 and for the year 2016 it
was around 97.48%. In this case also the
operating expenses ratio for the
construction B has been high for the
company thereby leaving the company
with a very low amount of profitability.
Financial Considerations
The important financial considerations that would be made by the company should be
based on the Earning Per Share for each of the construction units in the Company particularly
Construction A and Construction B. The EPS for Construction A has been around 68 Cents in
the year 2016 and the same increased to around 111 cents with the increase in reported
profitability. The tender price for Construction A is around R720 MN. On the other hand the
tender price for the Construction B is around R780 MN (Robinson et al., 2015). It is
recommended that Construction B should be selected for the purpose of investment. The same
has been evaluated based on the net profit generated and the amount of investment that has been
done in each of the construction units. The return on investment from Construction A has been
around 6.99% and on the other hand, side the return on investment for the Construction B has
Document Page
5FINANCIAL ANALYSIS
been around 14.73%, highlighting that the Construction B could be the best available option for
the company (Lee, Lin & Shin, 2018).
Non-Financial Considerations
The non-financial considerations that the company would be considering would be in the
form of employee base that are deployed in the business operations of the company, The amount
of business risk that each of the unit faces and the stability in the financial performance shown
by each of the business unit. On the other hand, certain important aspects like the ability of
company in maintain the financial risk of the company has also been some of the key approaches
for stabilizing the overall operations of the company (Altman et al., 2017). Business risk and
financial risk are some of the important considerations that a company should make while
investing into any form of business. Business risks are associated with a company due to the
level of sales and business operations undertaken by the company on the other hand, the financial
risk of a company is primarily associated or in the form of debt position in the company. The
management strategy followed for each of the sections of the company, should also be
undertaken with great care for the purpose of analysis for the company so that they can
eventually increase the business operations of the company. The tender committee should also
take the forecasted or the actual return which they might earn from the business from respective
department that is Construction A and Construction B. The total investment would be analyzed
from the perspective of initial equity balance plus the additional amount of tender investment
that would be done in the company. The net return from Construction A in that case for the
equity investor has been around 6.99% and for Construction B the same has been around
14.73%. In terms of liquidity risk the Construction A materially could face cash crisis as the
current obligations for the company is currently very high for the company and the same would
Document Page
6FINANCIAL ANALYSIS
be impacting the overall operations of the company. It is necessary that the management of the
company should review the liquidity position of the company and keep an adequate amount of
working capital for the business.
Conclusion
The above discussion analysis for the XYZ investment based on the investment reported
generated for the business could well state that the financial performance of each of the business
divisions. It is recommended to the company that Construction B should be selected for the
purpose of investment, because of the better financial performance and financial position of the
business unit.
tabler-icon-diamond-filled.svg

Paraphrase This Document

Need a fresh take? Get an instant paraphrase of this document with our AI Paraphraser
Document Page
7FINANCIAL ANALYSIS
References
Altman, E. I., IwaniczDrozdowska, M., Laitinen, E. K., & Suvas, A. (2017). Financial distress
prediction in an international context: A review and empirical analysis of Altman's Zscore
model. Journal of International Financial Management & Accounting, 28(2), 131-171.
Kim, J., & Im, C. (2017). Study on corporate social responsibility (CSR): focus on tax avoidance
and financial ratio analysis. Sustainability, 9(10), 1710.
Lee, P. T. W., Lin, C. W., & Shin, S. H. (2018). Financial performance evaluation of shipping
companies using entropy and grey relation analysis. In Multi-Criteria Decision Making in
Maritime Studies and Logistics (pp. 219-247). Springer, Cham.
Muritala, T. A. (2018). An empirical analysis of capital structure on firms’ performance in
Nigeria. IJAME.
Robinson, T. R., Henry, E., Pirie, W. L., & Broihahn, M. A. (2015). International financial
statement analysis. John Wiley & Sons.
Sari, A., Saputra, H., & Siahaan, A. P. U. P. U. (2018). Financial Distress Analysis on Indonesia
Stock Exchange Companies. Int. J. Innov. Res. Multidiscip. F, 4(3), 73-74.
Williams, E. E., & Dobelman, J. A. (2017). Financial statement analysis. World Scientific Book
Chapters, 109-169.
Zainudin, E. F., & Hashim, H. A. (2016). Detecting fraudulent financial reporting using financial
ratio. Journal of Financial Reporting and Accounting, 14(2), 266-278.
Document Page
8FINANCIAL ANALYSIS
Appendix
Ratio Analysis
Ratio Analysis
Particulars A Construction B Construction
Liquidity Ratio 2017 2016 2017 2016
Current Assets 1728 1176 4351 3819
Current Liabilities 1779 1222 3106 2906
Current Ratio 0.97 0.96 1.40 1.31
Profitability Ratio 2017 2016 2017 2016
Net Profit 77 47 505 252
Revenue 4021 3167 9027 8535
Net Profit Margin 1.91% 1.48% 5.59% 2.95%
Net Profit 77 47 505 252
Total Assets 2273 1643 6373 5596
Return on Assets 3.39% 2.86% 7.92% 4.50%
Net Profit 77 47 505 252
Total Shareholder's Equity 382 323 2648 1982
Return on Equity 20.16% 14.55% 19.07% 12.71%
Solvency Ratio 2017 2016 2017 2016
Debt 106 94 610 700
Equity 382 323 2648 1982
Debt to Equity Ratio 27.7% 29.1% 23.0% 35.3%
Operating Exp. Ratio 2017 2016 2017 2016
Operating Expenses 3897 3087 8643 8320
Revenue 4021 3167 9027 8535
Operating Exp. Ratio 96.92% 97.47% 95.75% 97.48%
chevron_up_icon
1 out of 9
circle_padding
hide_on_mobile
zoom_out_icon
logo.png

Your All-in-One AI-Powered Toolkit for Academic Success.

Available 24*7 on WhatsApp / Email

[object Object]