Financial Analysis of Stocks and Portfolio Recommendation for Tri-Star

Verified

Added on  2022/10/12

|10
|1297
|3
Report
AI Summary
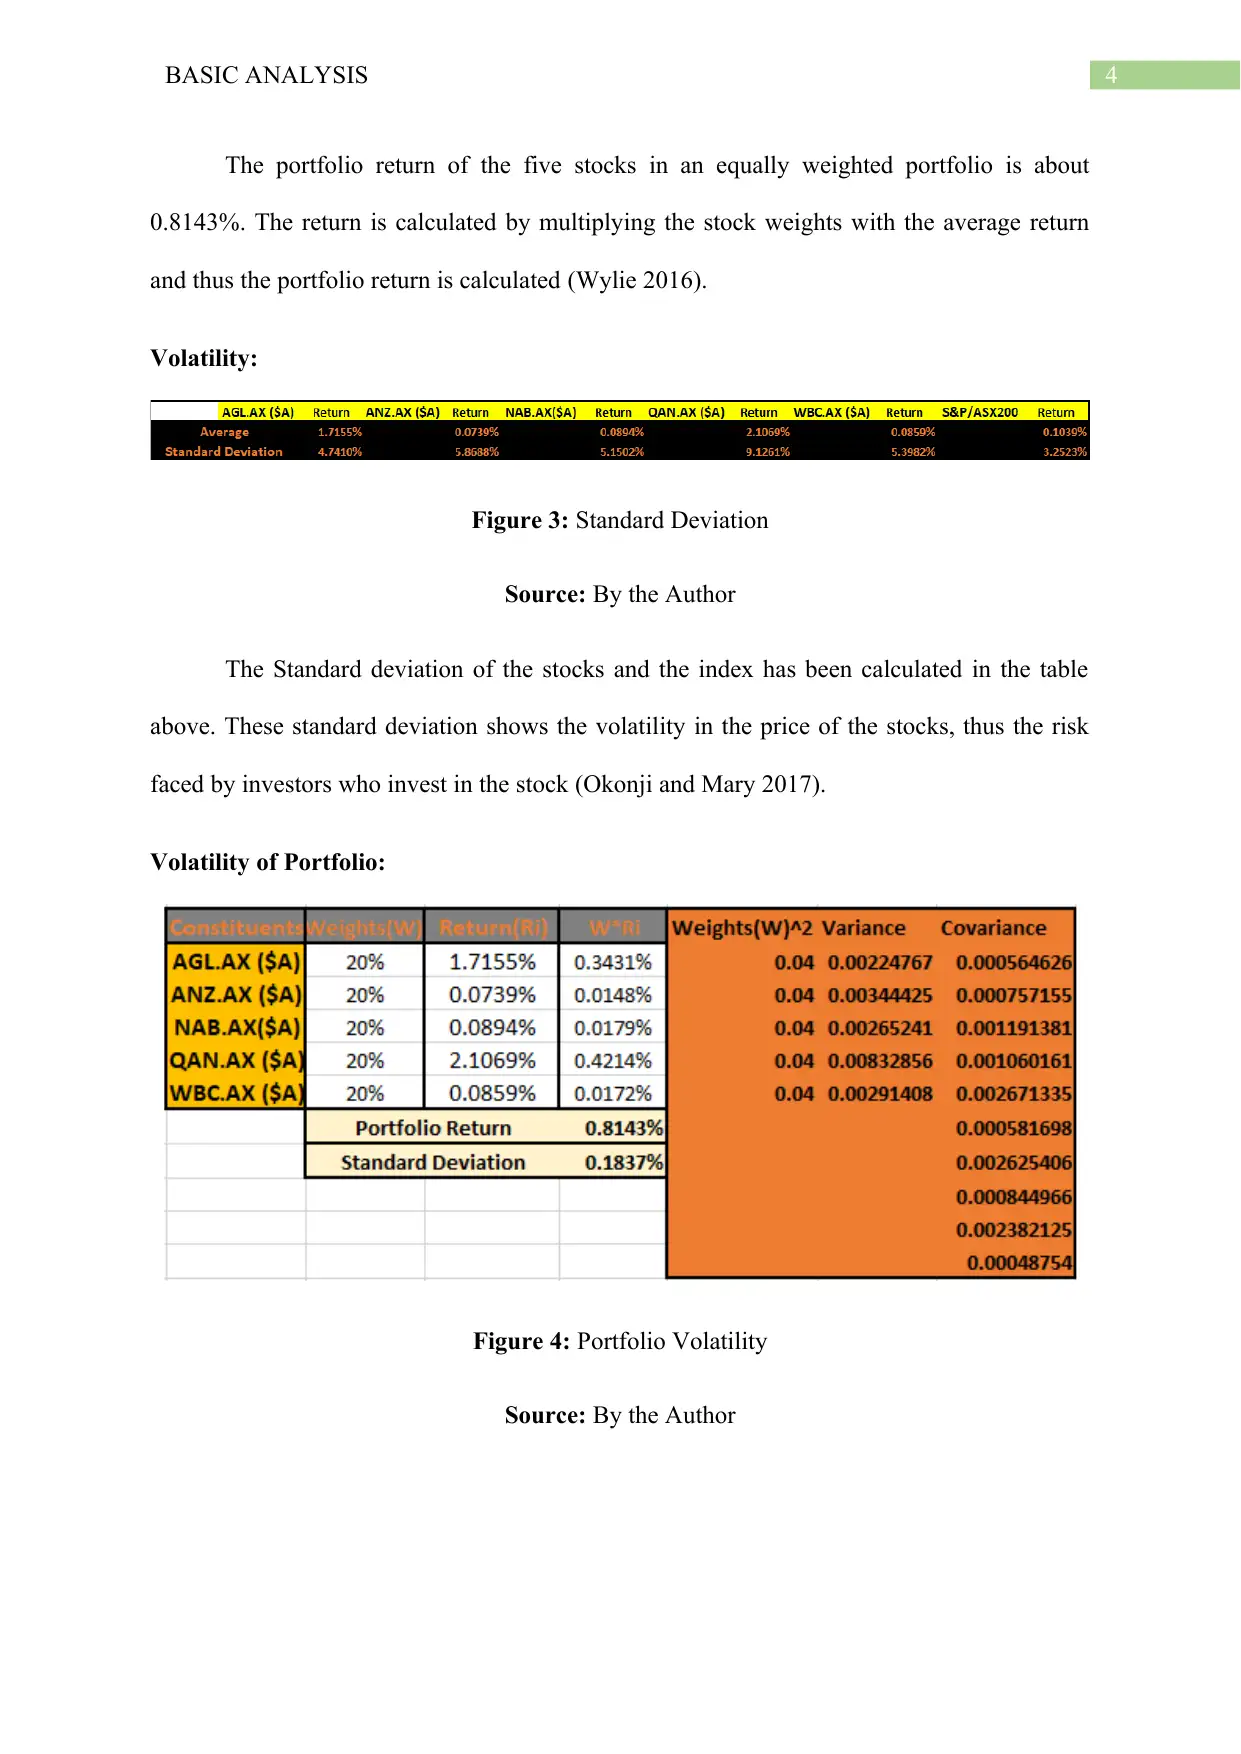
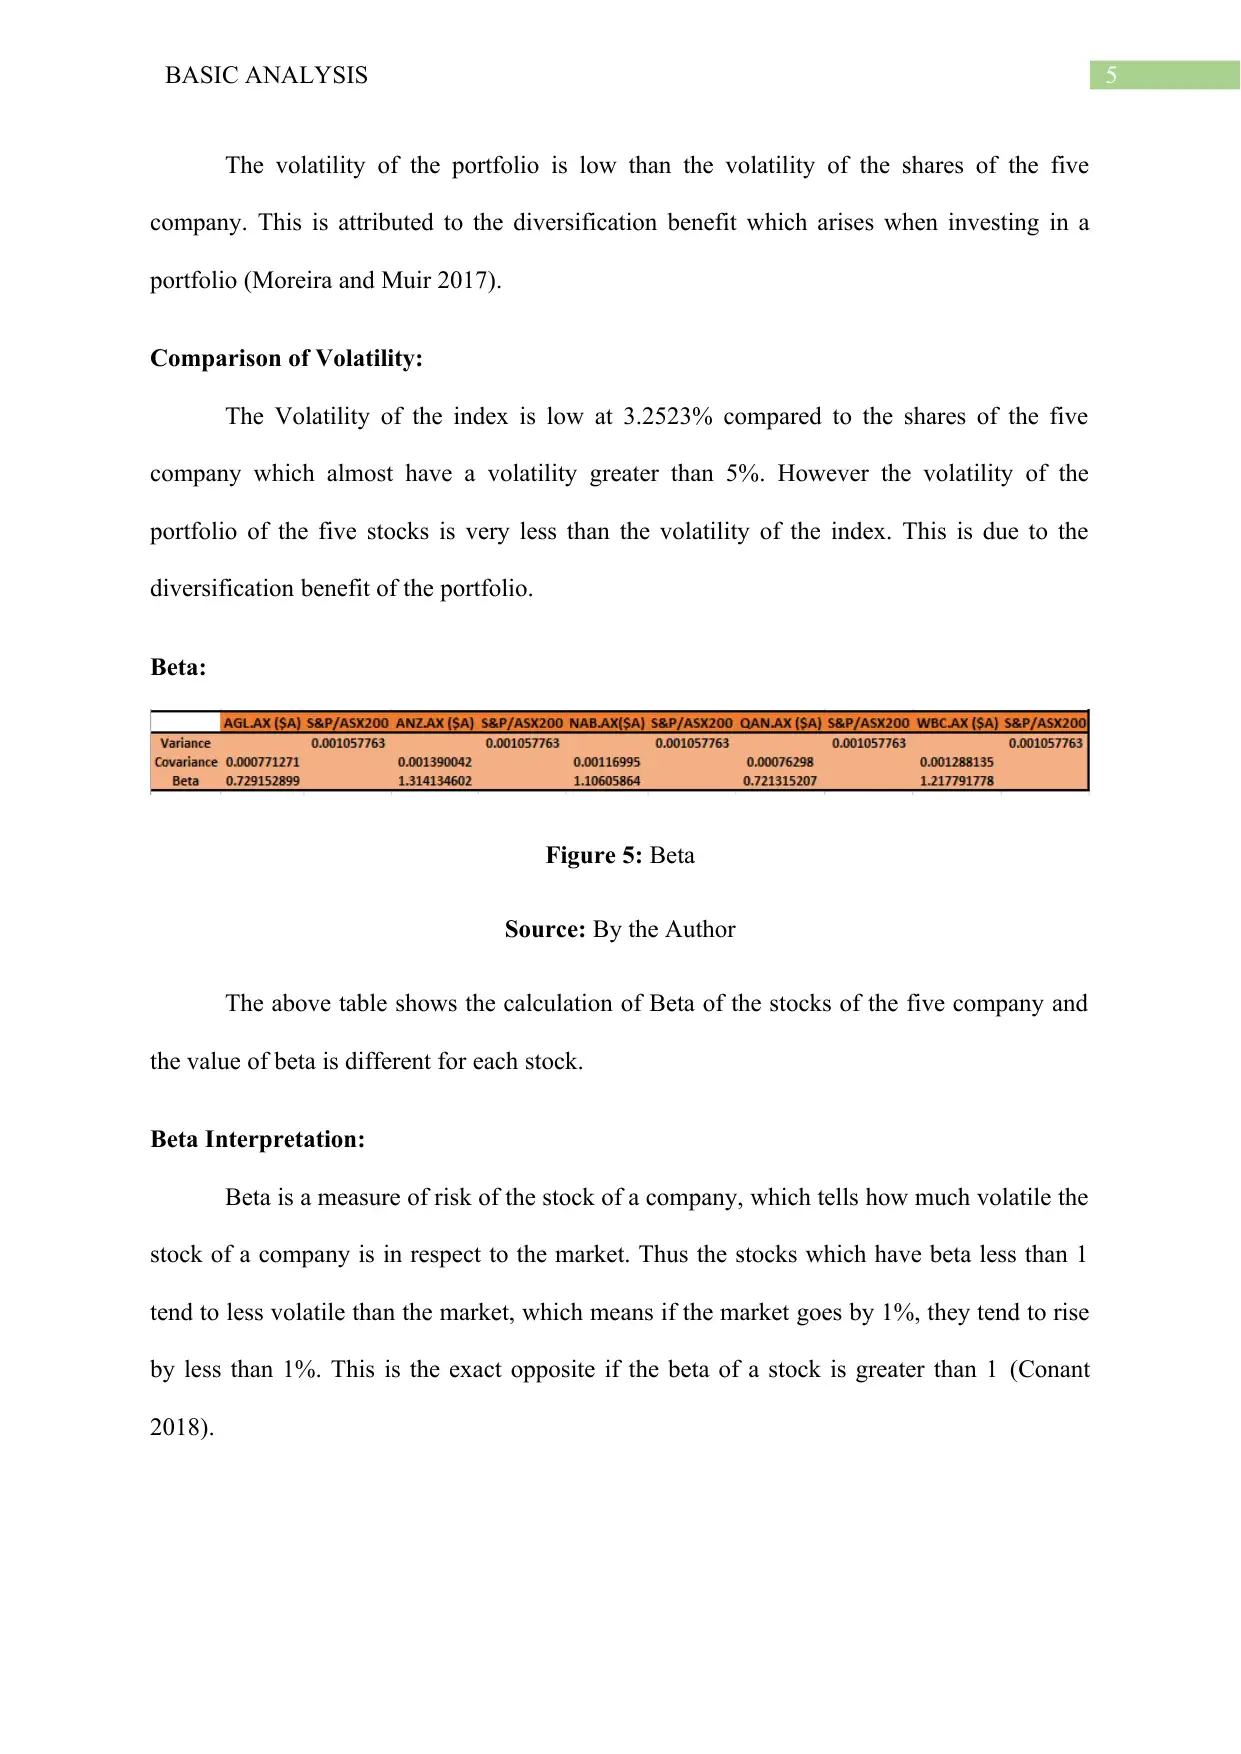
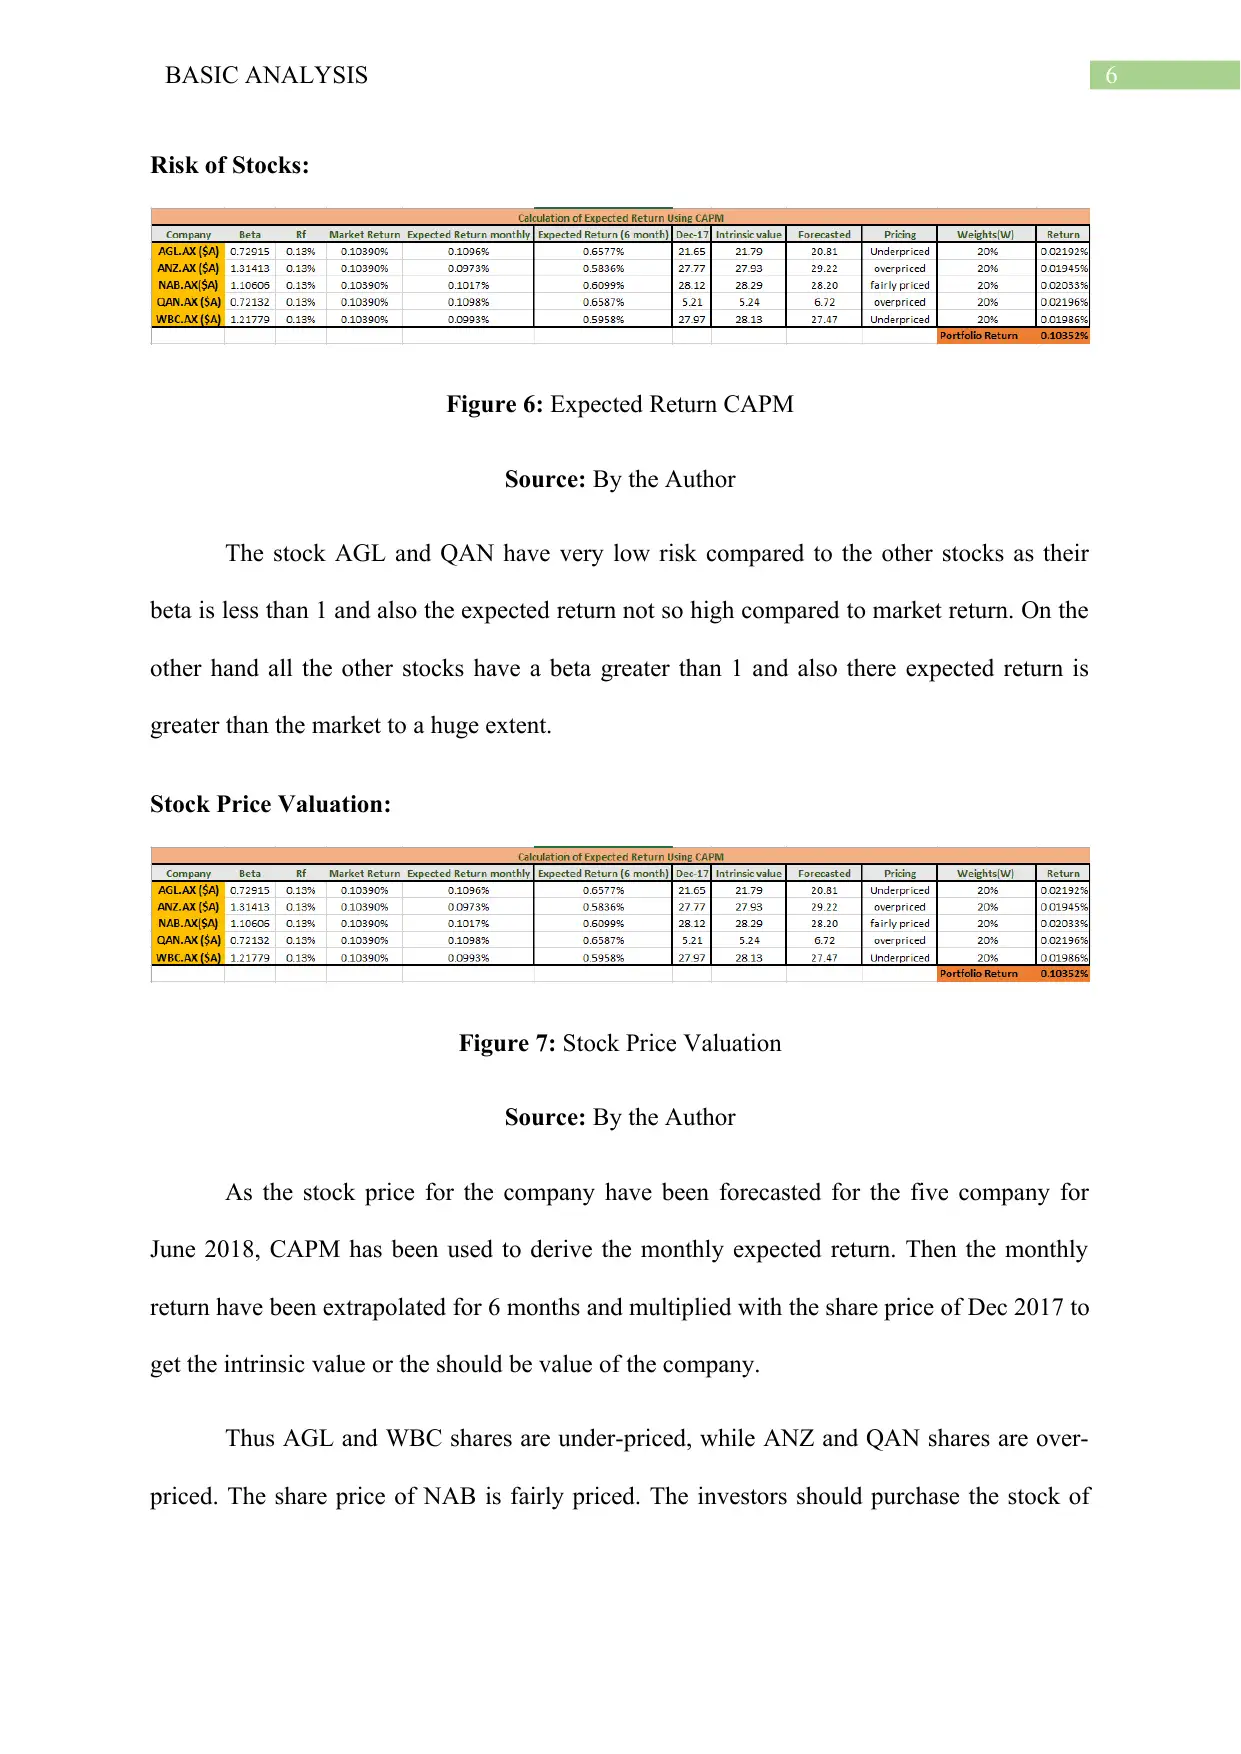
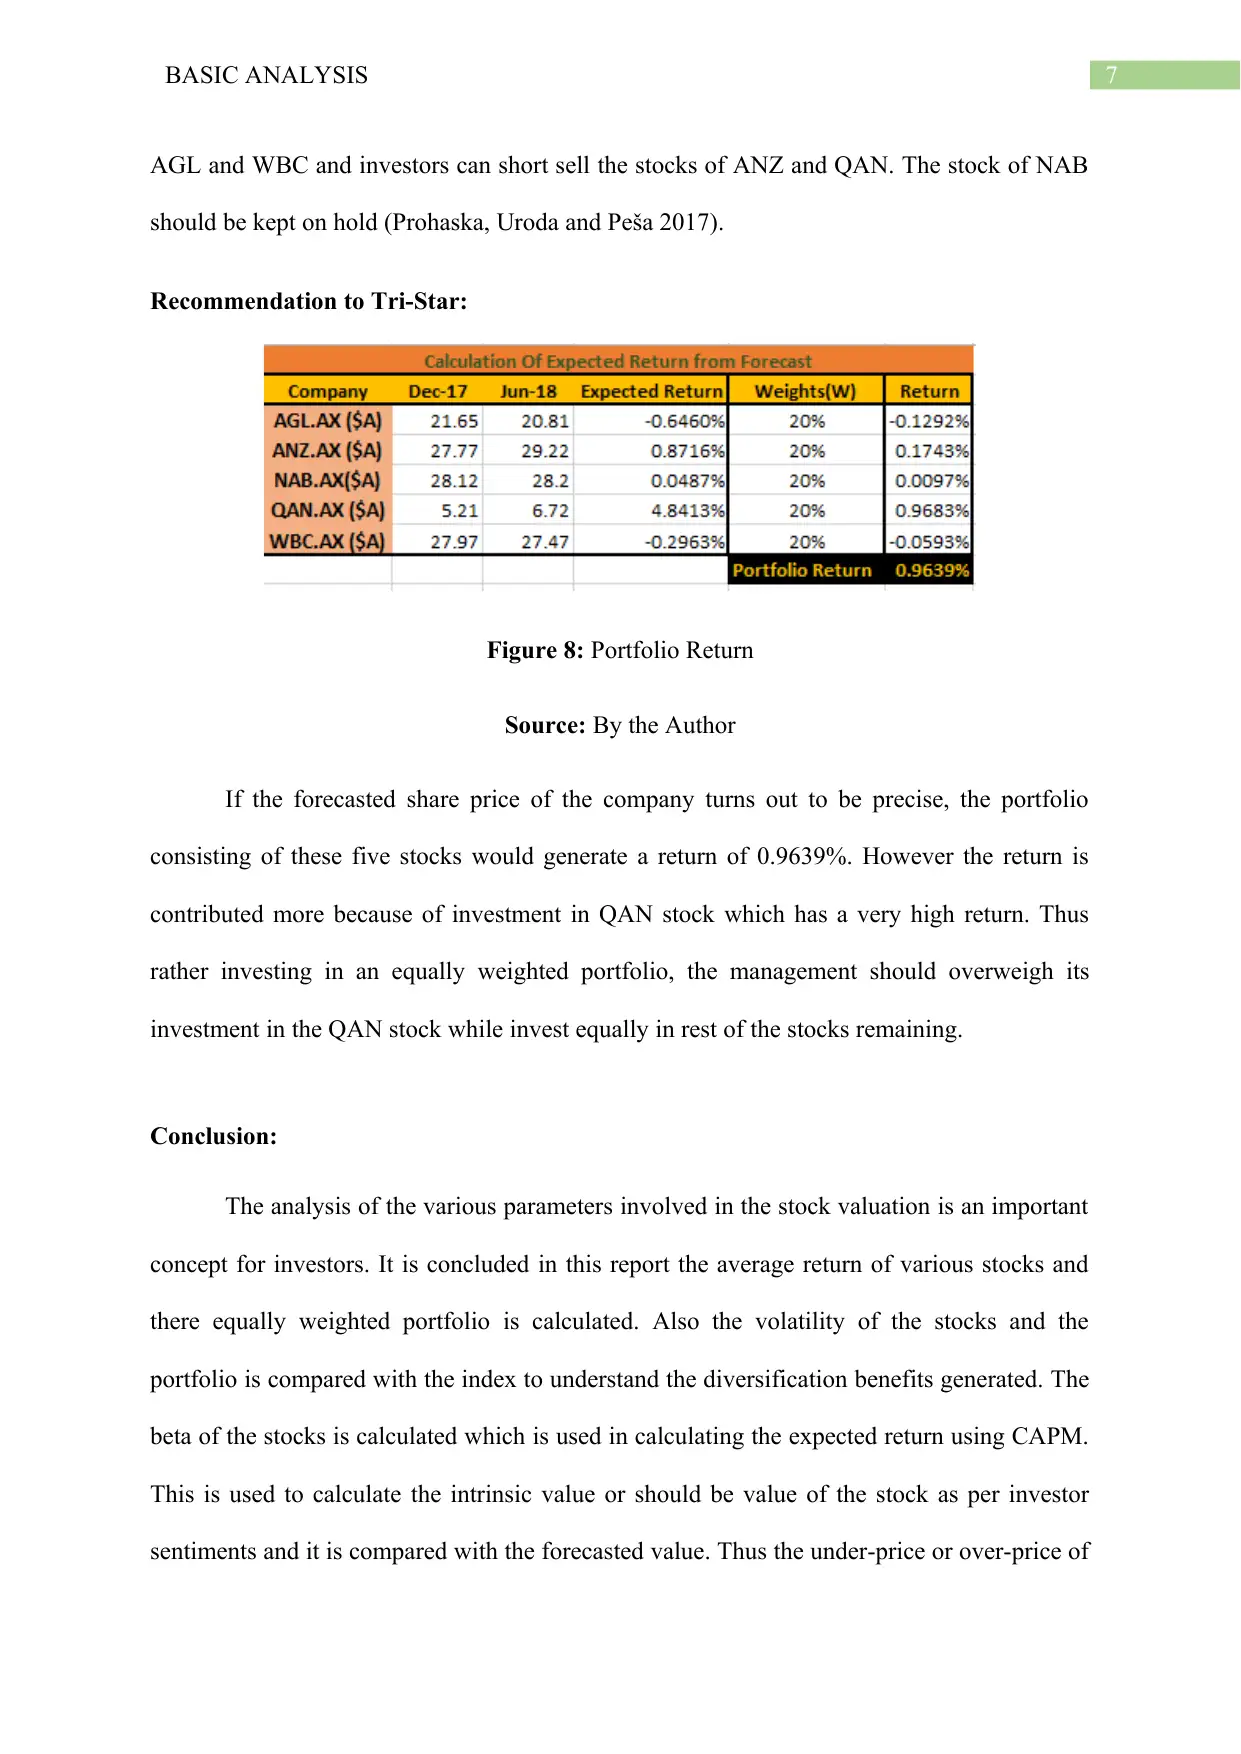
This report conducts a comprehensive financial analysis of five different stocks, focusing on average returns, portfolio returns, and volatility. It calculates and compares the volatility of individual stocks with the index and the portfolio to demonstrate diversification benefits. The beta of each stock is computed to measure its risk relative to the market, and the Capital Asset Pricing Model (CAPM) is utilized to determine expected returns. The report then forecasts stock prices and compares these with intrinsic values derived using CAPM, classifying stocks as underpriced, overpriced, or fairly priced. Finally, it offers specific investment recommendations to the management of Tri-Star based on portfolio analysis and potential returns, emphasizing the importance of weighted investments in the portfolio.
tabler-icon-diamond-filled.svg

Contribute Materials

Your contribution can guide someone’s learning journey. Share your documents today.
Document Page
Running head: BASIC ANALYSIS
Basic Analysis
Name of the Student:
Name of the University:
Author Note:
tabler-icon-diamond-filled.svg

Secure Best Marks with AI Grader

Need help grading? Try our AI Grader for instant feedback on your assignments.
Document Page
1BASIC ANALYSIS
Executive Summary:
Stocks of a company react to various news and generate various returns as per the market
sentiments and expected return. This is observed by calculating the average return a stock
generates over the analysis period. The risk which the stock has is observed by the standard
deviation of the stock. Also the beta which is a measure of risk of a company in respect to the
market is calculated. Thus a portfolio of the stocks along with an evaluation of their pricing is
analysed and an advice is provided to the management about the choice of the portfolio at the
end of the report.
Document Page
2BASIC ANALYSIS
Table of Contents
Introduction:...............................................................................................................................3
Discussion:.................................................................................................................................3
Average Return:.....................................................................................................................3
Portfolio Return:.....................................................................................................................3
Volatility:...............................................................................................................................4
Volatility of Portfolio:............................................................................................................4
Comparison of Volatility:......................................................................................................5
Beta:.......................................................................................................................................5
Beta Interpretation:.................................................................................................................5
Risk of Stocks:.......................................................................................................................6
Stock Price Valuation:............................................................................................................6
Recommendation to Tri-Star:.................................................................................................7
Conclusion:................................................................................................................................7
References and Bibliographies:..................................................................................................9
Document Page
3BASIC ANALYSIS
Introduction:
The report is aimed to calculate the average return, volatility, portfolio return and the
beta of five different stocks. The various calculation are done to provide a brief of the most
volatile and less volatile stock. Also along with it the forecasted stock price is compared with
the expected return calculated using CAPM and an analysis is conducted.
Discussion:
Average Return:
Figure 1: Average Return
Source: By the Author
The average return of the five stocks is calculated and only two stocks have average
return greater than the ASX 200 (Winston 2016).
Portfolio Return:
Figure 2: Portfolio Return
Source: By the Author
tabler-icon-diamond-filled.svg

Secure Best Marks with AI Grader

Need help grading? Try our AI Grader for instant feedback on your assignments.
Document Page
4BASIC ANALYSIS
The portfolio return of the five stocks in an equally weighted portfolio is about
0.8143%. The return is calculated by multiplying the stock weights with the average return
and thus the portfolio return is calculated (Wylie 2016).
Volatility:
Figure 3: Standard Deviation
Source: By the Author
The Standard deviation of the stocks and the index has been calculated in the table
above. These standard deviation shows the volatility in the price of the stocks, thus the risk
faced by investors who invest in the stock (Okonji and Mary 2017).
Volatility of Portfolio:
Figure 4: Portfolio Volatility
Source: By the Author
Document Page
5BASIC ANALYSIS
The volatility of the portfolio is low than the volatility of the shares of the five
company. This is attributed to the diversification benefit which arises when investing in a
portfolio (Moreira and Muir 2017).
Comparison of Volatility:
The Volatility of the index is low at 3.2523% compared to the shares of the five
company which almost have a volatility greater than 5%. However the volatility of the
portfolio of the five stocks is very less than the volatility of the index. This is due to the
diversification benefit of the portfolio.
Beta:
Figure 5: Beta
Source: By the Author
The above table shows the calculation of Beta of the stocks of the five company and
the value of beta is different for each stock.
Beta Interpretation:
Beta is a measure of risk of the stock of a company, which tells how much volatile the
stock of a company is in respect to the market. Thus the stocks which have beta less than 1
tend to less volatile than the market, which means if the market goes by 1%, they tend to rise
by less than 1%. This is the exact opposite if the beta of a stock is greater than 1 (Conant
2018).
Document Page
6BASIC ANALYSIS
Risk of Stocks:
Figure 6: Expected Return CAPM
Source: By the Author
The stock AGL and QAN have very low risk compared to the other stocks as their
beta is less than 1 and also the expected return not so high compared to market return. On the
other hand all the other stocks have a beta greater than 1 and also there expected return is
greater than the market to a huge extent.
Stock Price Valuation:
Figure 7: Stock Price Valuation
Source: By the Author
As the stock price for the company have been forecasted for the five company for
June 2018, CAPM has been used to derive the monthly expected return. Then the monthly
return have been extrapolated for 6 months and multiplied with the share price of Dec 2017 to
get the intrinsic value or the should be value of the company.
Thus AGL and WBC shares are under-priced, while ANZ and QAN shares are over-
priced. The share price of NAB is fairly priced. The investors should purchase the stock of
tabler-icon-diamond-filled.svg

Paraphrase This Document

Need a fresh take? Get an instant paraphrase of this document with our AI Paraphraser
Document Page
7BASIC ANALYSIS
AGL and WBC and investors can short sell the stocks of ANZ and QAN. The stock of NAB
should be kept on hold (Prohaska, Uroda and Peša 2017).
Recommendation to Tri-Star:
Figure 8: Portfolio Return
Source: By the Author
If the forecasted share price of the company turns out to be precise, the portfolio
consisting of these five stocks would generate a return of 0.9639%. However the return is
contributed more because of investment in QAN stock which has a very high return. Thus
rather investing in an equally weighted portfolio, the management should overweigh its
investment in the QAN stock while invest equally in rest of the stocks remaining.
Conclusion:
The analysis of the various parameters involved in the stock valuation is an important
concept for investors. It is concluded in this report the average return of various stocks and
there equally weighted portfolio is calculated. Also the volatility of the stocks and the
portfolio is compared with the index to understand the diversification benefits generated. The
beta of the stocks is calculated which is used in calculating the expected return using CAPM.
This is used to calculate the intrinsic value or should be value of the stock as per investor
sentiments and it is compared with the forecasted value. Thus the under-price or over-price of
Document Page
8BASIC ANALYSIS
the stocks are determined. Thus this report is concluded with the advice to the management to
invest in a portfolio of those stocks with variable weights.
Document Page
9BASIC ANALYSIS
References and Bibliographies:
Conant, D.D., 2018. Examining critical and near-critical paths: an Excel-based classroom
exercise. Journal of Education for Business, 93(6), pp.285-291.
Moreira, A. and Muir, T., 2017. Volatility‐Managed Portfolios. The Journal of
Finance, 72(4), pp.1611-1644.
Okonji, E.A. and Mary, Y.O., 2017. Forecasting Price Direction, Hedging and Spread
Options in Oil Volatility. Journal of Economic Behavior and Organization, 5(6), pp.114-123.
Prohaska, Z., Uroda, I. and Peša, A.R., 2017, May. Valuation of common stocks using the
dividend valuation approach and excel. In 2017 40th International Convention on
Information and Communication Technology, Electronics and Microelectronics
(MIPRO) (pp. 1481-1485). IEEE.
Winston, W., 2016. Microsoft Excel data analysis and business modeling. Microsoft press.
Wylie, G.M., 2016. The Effect of Mortgage Timeline on the Investor's Portfolio.
chevron_up_icon
1 out of 10
circle_padding
hide_on_mobile
zoom_out_icon
logo.png

Your All-in-One AI-Powered Toolkit for Academic Success.

Available 24*7 on WhatsApp / Email

[object Object]