Financial Management Assignment: Risk, Return, NPV, and Financing
VerifiedAdded on 2023/01/09
|8
|1263
|26
Report
AI Summary
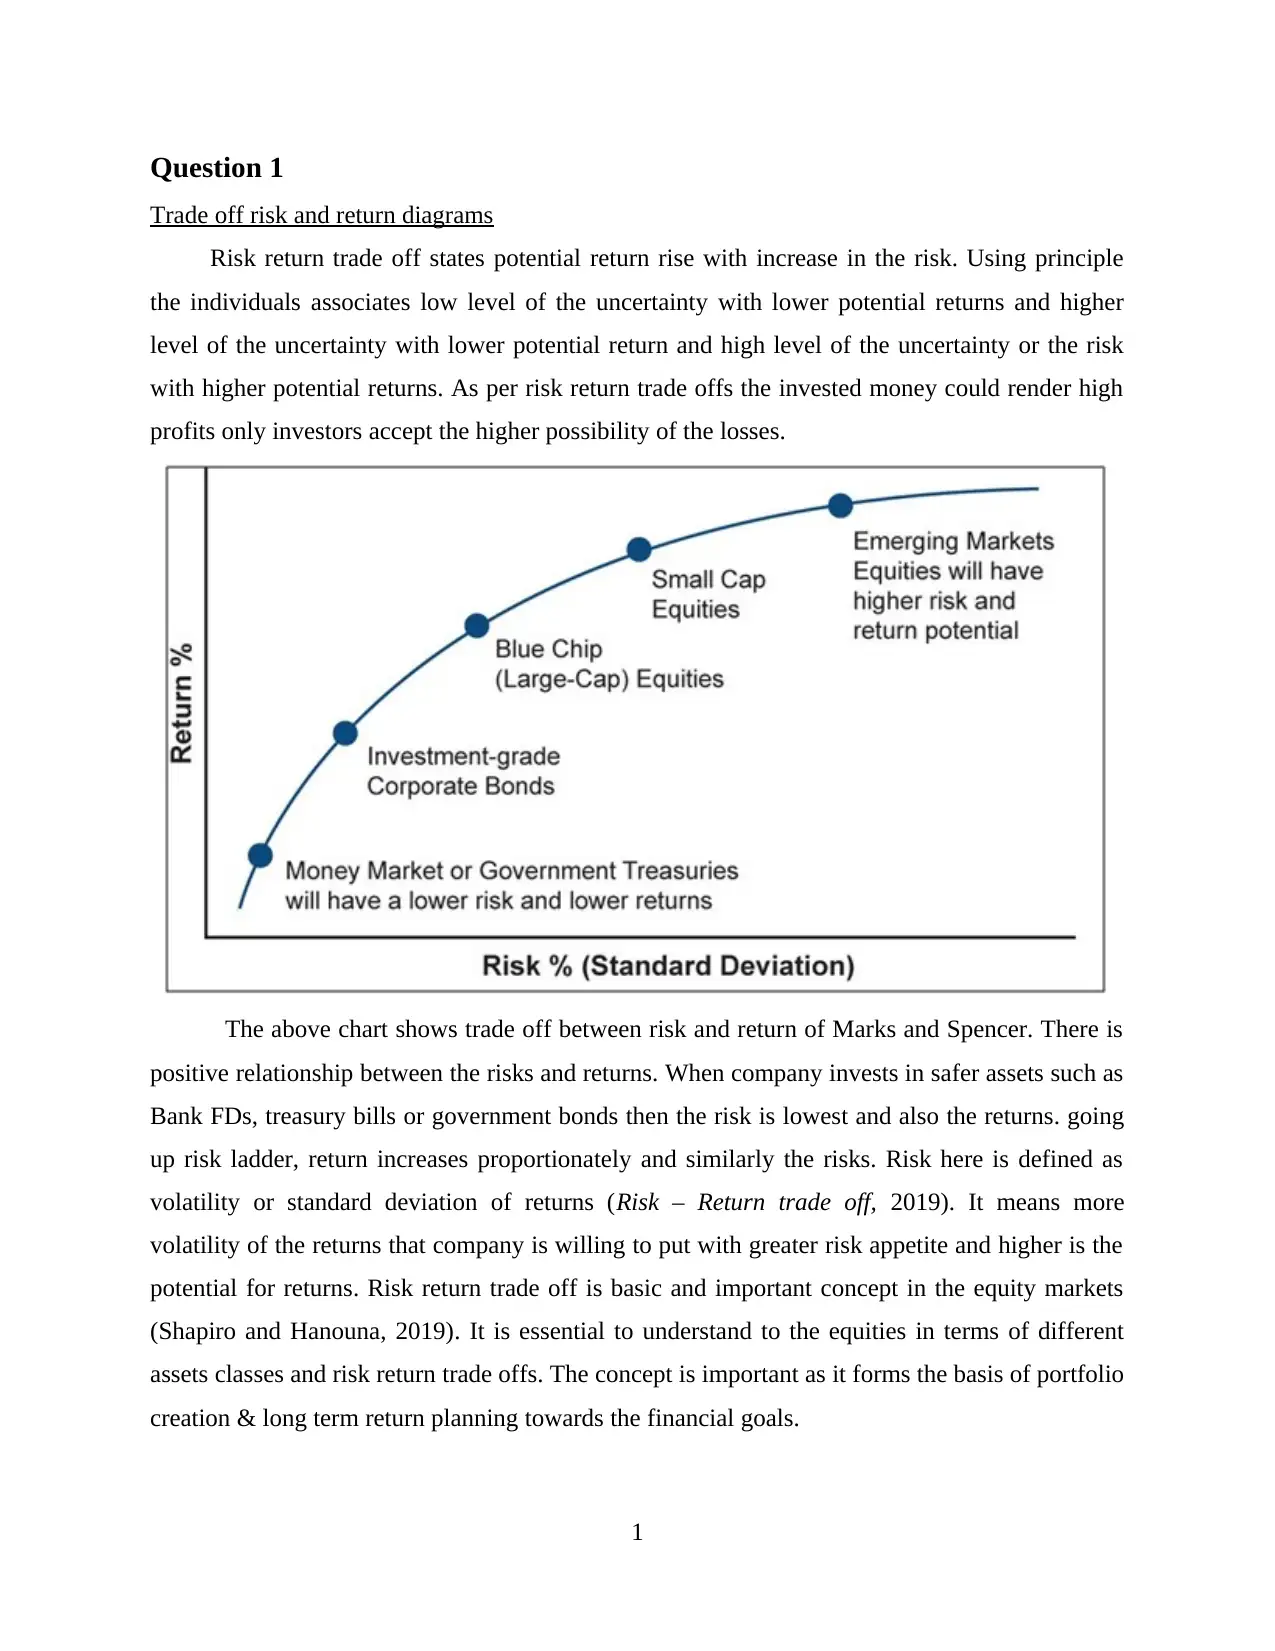
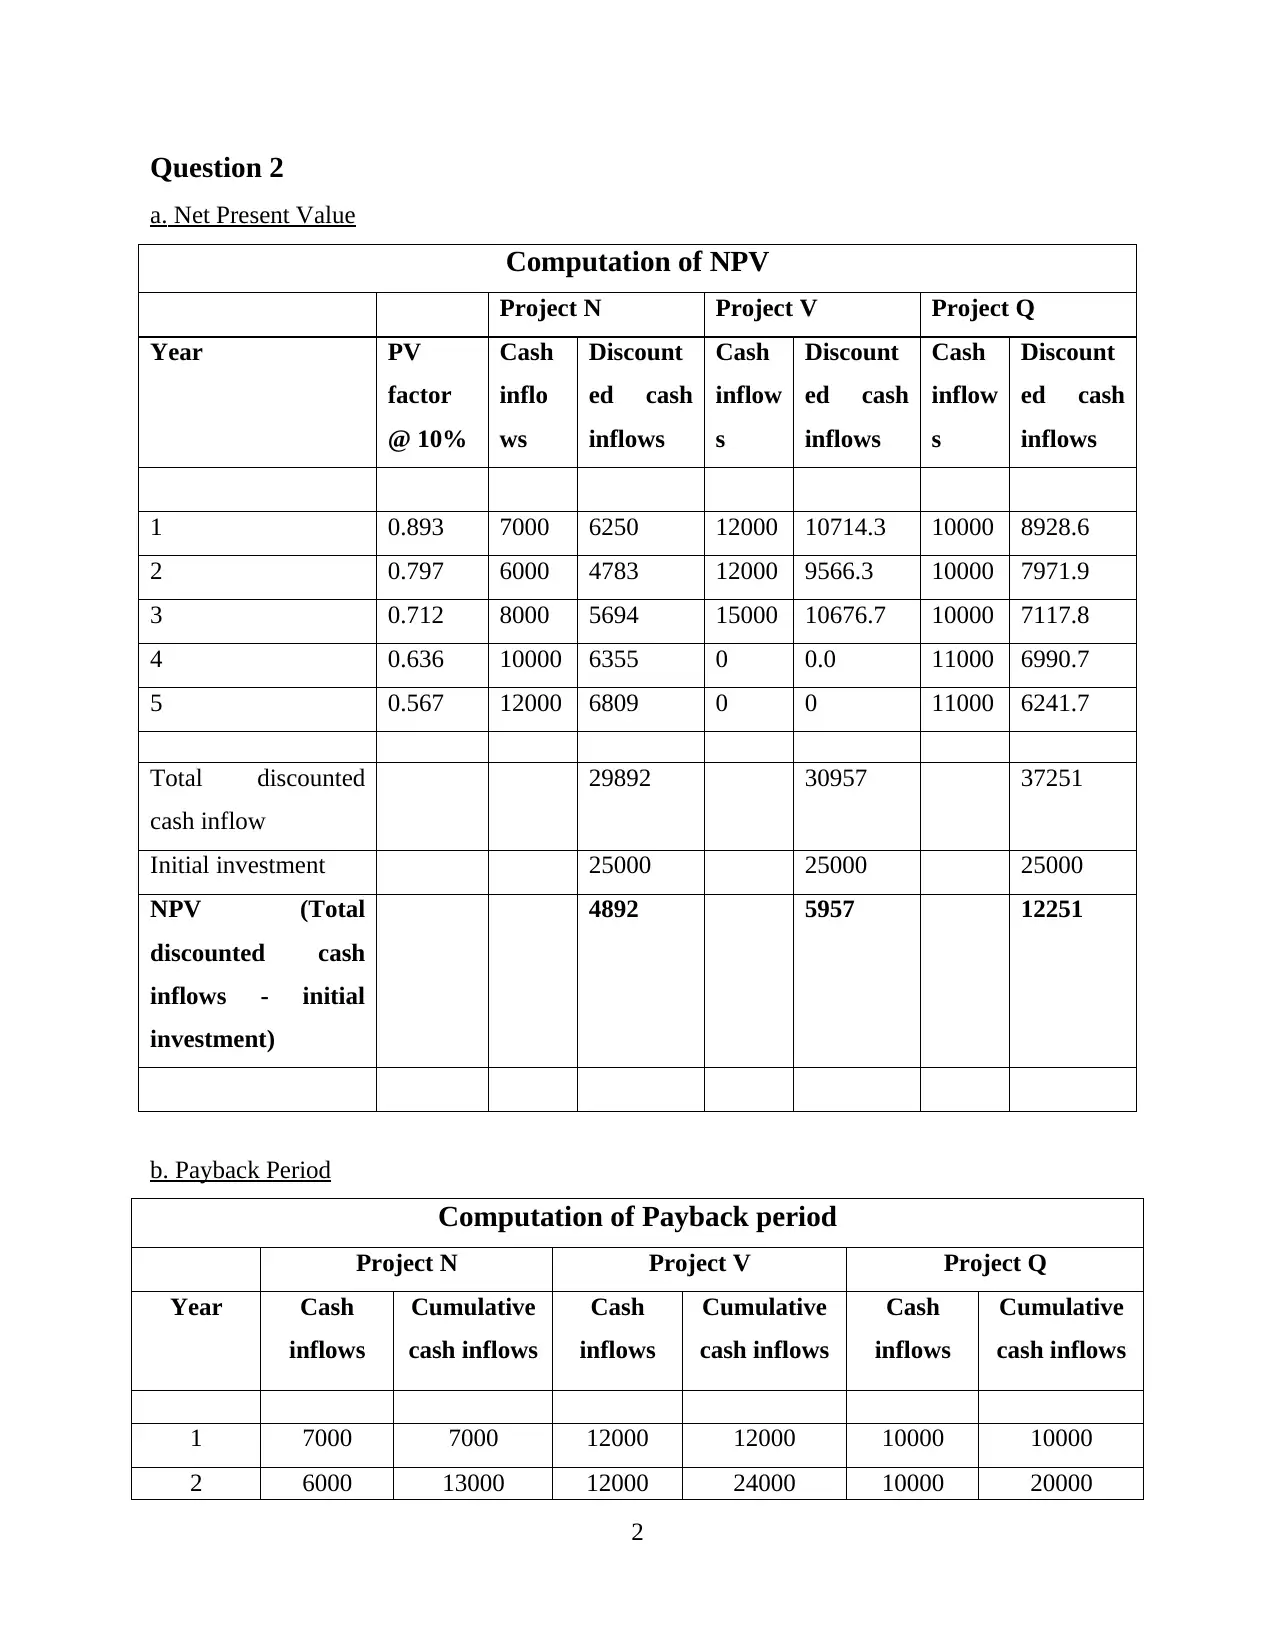
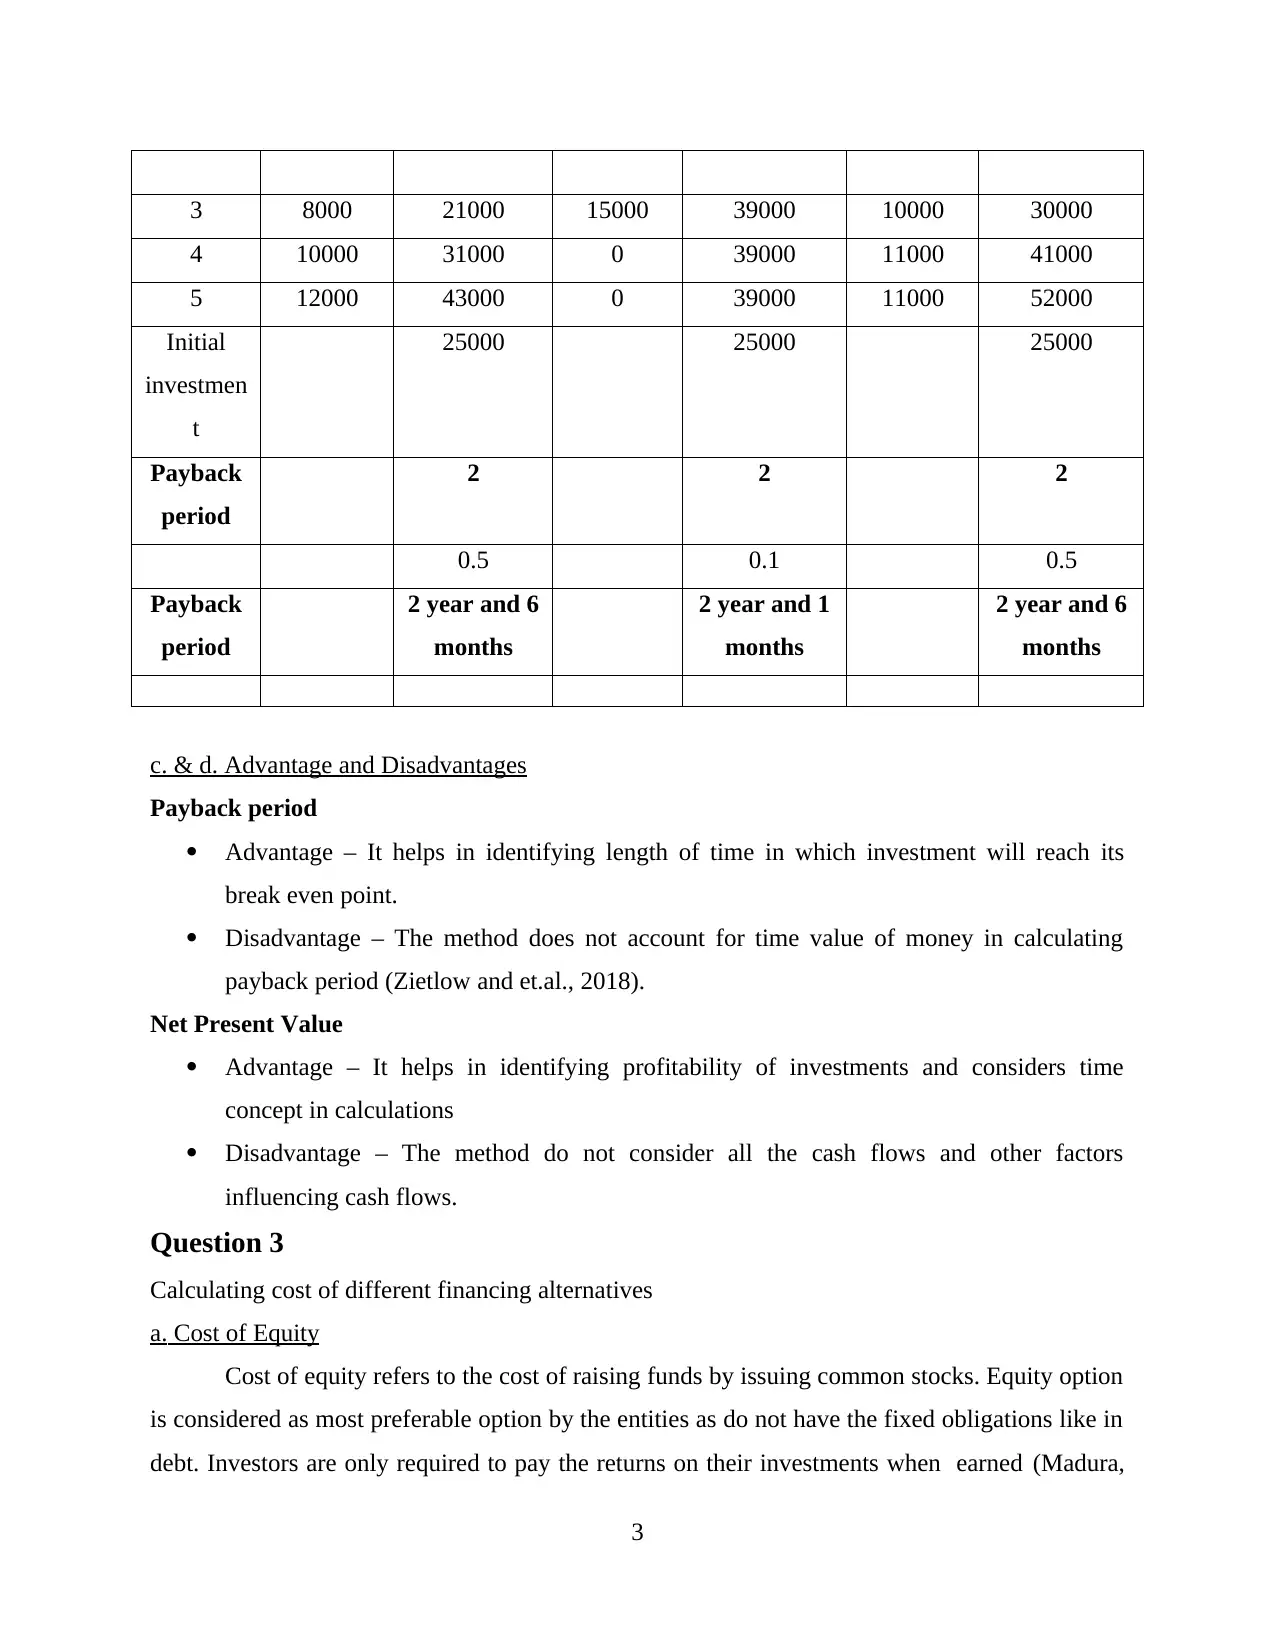
This financial management report comprehensively addresses key concepts in finance. It begins with an explanation of the risk-return trade-off using diagrams and a real-world example of Marks and Spencer, illustrating the positive relationship between risk and potential return. The report then delves into project evaluation techniques, calculating the Net Present Value (NPV) and Payback Period for three different projects (N, V, and Q), along with the advantages and disadvantages of each method. Furthermore, the assignment explores the cost of different financing alternatives, including the cost of equity, cost of debt, and cost of preferred stock, providing formulas and calculations for each. Finally, the report analyzes financing proposals, recommending the most suitable option based on the calculated costs and financial risks, concluding with a discussion on the advantages of issuing common stock over preferred stock. The report is well-referenced, using Harvard style citations throughout.

FINANCIAL MANAGEMENT
Paraphrase This Document
Need a fresh take? Get an instant paraphrase of this document with our AI Paraphraser

TABLE OF CONTENTS
TABLE OF CONTENTS................................................................................................................2
Question 1........................................................................................................................................1
Trade off risk and return diagrams..............................................................................................1
Question 2........................................................................................................................................2
a. Net Present Value....................................................................................................................2
b. Payback Period........................................................................................................................2
c. & d. Advantage and Disadvantages.........................................................................................3
Question 3........................................................................................................................................3
a. Cost of Equity..........................................................................................................................3
b. Cost of Debt.............................................................................................................................4
c. Cost of Preferred stocks...........................................................................................................4
Question 4........................................................................................................................................5
a. Cost of issuing common stocks................................................................................................5
b. Cost of issuing preferred stocks...............................................................................................5
c. Financing proposal to be accepted...........................................................................................5
REFERENCES................................................................................................................................6

Question 1
Trade off risk and return diagrams
Risk return trade off states potential return rise with increase in the risk. Using principle
the individuals associates low level of the uncertainty with lower potential returns and higher
level of the uncertainty with lower potential return and high level of the uncertainty or the risk
with higher potential returns. As per risk return trade offs the invested money could render high
profits only investors accept the higher possibility of the losses.
The above chart shows trade off between risk and return of Marks and Spencer. There is
positive relationship between the risks and returns. When company invests in safer assets such as
Bank FDs, treasury bills or government bonds then the risk is lowest and also the returns. going
up risk ladder, return increases proportionately and similarly the risks. Risk here is defined as
volatility or standard deviation of returns (Risk – Return trade off, 2019). It means more
volatility of the returns that company is willing to put with greater risk appetite and higher is the
potential for returns. Risk return trade off is basic and important concept in the equity markets
(Shapiro and Hanouna, 2019). It is essential to understand to the equities in terms of different
assets classes and risk return trade offs. The concept is important as it forms the basis of portfolio
creation & long term return planning towards the financial goals.
1
⊘ This is a preview!⊘
Do you want full access?
Subscribe today to unlock all pages.

Trusted by 1+ million students worldwide

Question 2
a. Net Present Value
Computation of NPV
Project N Project V Project Q
Year PV
factor
@ 10%
Cash
inflo
ws
Discount
ed cash
inflows
Cash
inflow
s
Discount
ed cash
inflows
Cash
inflow
s
Discount
ed cash
inflows
1 0.893 7000 6250 12000 10714.3 10000 8928.6
2 0.797 6000 4783 12000 9566.3 10000 7971.9
3 0.712 8000 5694 15000 10676.7 10000 7117.8
4 0.636 10000 6355 0 0.0 11000 6990.7
5 0.567 12000 6809 0 0 11000 6241.7
Total discounted
cash inflow
29892 30957 37251
Initial investment 25000 25000 25000
NPV (Total
discounted cash
inflows - initial
investment)
4892 5957 12251
b. Payback Period
Computation of Payback period
Project N Project V Project Q
Year Cash
inflows
Cumulative
cash inflows
Cash
inflows
Cumulative
cash inflows
Cash
inflows
Cumulative
cash inflows
1 7000 7000 12000 12000 10000 10000
2 6000 13000 12000 24000 10000 20000
2
Paraphrase This Document
Need a fresh take? Get an instant paraphrase of this document with our AI Paraphraser

3 8000 21000 15000 39000 10000 30000
4 10000 31000 0 39000 11000 41000
5 12000 43000 0 39000 11000 52000
Initial
investmen
t
25000 25000 25000
Payback
period
2 2 2
0.5 0.1 0.5
Payback
period
2 year and 6
months
2 year and 1
months
2 year and 6
months
c. & d. Advantage and Disadvantages
Payback period
Advantage – It helps in identifying length of time in which investment will reach its
break even point.
Disadvantage – The method does not account for time value of money in calculating
payback period (Zietlow and et.al., 2018).
Net Present Value
Advantage – It helps in identifying profitability of investments and considers time
concept in calculations
Disadvantage – The method do not consider all the cash flows and other factors
influencing cash flows.
Question 3
Calculating cost of different financing alternatives
a. Cost of Equity
Cost of equity refers to the cost of raising funds by issuing common stocks. Equity option
is considered as most preferable option by the entities as do not have the fixed obligations like in
debt. Investors are only required to pay the returns on their investments when earned (Madura,
3

2020). However, the cost of common stocks is highest as compared with other options as it is
considered to be most beneficial option.
Formula = (D1 / P ) + G
D1 = Dividend for next year
P = Price
G = Growth
= (3.5 / 50 ) + 0.10
= 0.17 or 17%
b. Cost of Debt
It is another source of raising capital used by the organisations. In this companies are
required to pay fixed amount of interest on the borrowed funds every year (Apte and Kapshe,
2020). Debt could be raised from bonds, debentures or bank loans.
Formula = Coupon rate * (1- tax rate)
= 8*(1-0.04)
= 4.8%
c. Cost of Preferred stocks
Companies also raise funds through preference stocks. These shares have preference
over equity. Company in such stocks have to pay fixed amount of dividend every year on the
agreed rate. if company does not have profits then the dividend gets accumulated over to next
year.
Formula = Dp / (MP –Fc)
Dp = Dividend in amount
MP = Market price
Fc = Floatation cost
= 13.5 / (140 - 2.7)
= 9.8 %
From the above alternatives the best and beneficial choice is raising funds through 8%
bonds. It has the lowest cost as compared with other options. The cost is lower as company gets
4
⊘ This is a preview!⊘
Do you want full access?
Subscribe today to unlock all pages.

Trusted by 1+ million students worldwide

tax benefits in debt sources which is not available in other options. Therefore it should raise
funds by issuing bonds.
Question 4
Financing alternatives
a. Cost of issuing common stocks
Cost of Equity = (D1 / P ) + G
D1 = Dividend for next year
P = Price
G = Growth
= (15 / 100) + 0.05
= 0.20 or 20 %
b. Cost of issuing preferred stocks
Cost of issuing preferred stocks = Dp / (MP –Fc)
Dp = Dividend in amount
MP = Market price
Fc = Floatation cost
= 6/50
= 0.12 or 12%
c. Financing proposal to be accepted
Company should adopt for common stock with cost of 20%. Company is not required to pay
dividends in case of inadequate or no profits. Also the preference stocks are to be redeemed after
a specific period of time which is not case in common stocks. Issuing common stock will also
lower the financial risk of the company. Therefore company should issue common stocks for
company.
5
Paraphrase This Document
Need a fresh take? Get an instant paraphrase of this document with our AI Paraphraser

REFERENCES
Books and Journals
Shapiro, A.C. and Hanouna, P., 2019. Multinational financial management. John Wiley & Sons.
Madura, J., 2020. International financial management. Cengage Learning.
Zietlow, J. an et.al., 2018. Financial management for nonprofit organizations: policies and
practices. John Wiley & Sons.
Apte, P.G. and Kapshe, S., 2020. International Financial Management|. McGraw-Hill
Education.
Online
Risk – Return trade off. 2019. [Online]. Available through : <https://finpeg.com/blog/risk-return-
tradeoff/>.
6
1 out of 8
Related Documents

Your All-in-One AI-Powered Toolkit for Academic Success.
+13062052269
info@desklib.com
Available 24*7 on WhatsApp / Email
Unlock your academic potential
Copyright © 2020–2025 A2Z Services. All Rights Reserved. Developed and managed by ZUCOL.