Financial Analysis Report: ACCY801 - Financial Statement Analysis
VerifiedAdded on 2022/09/16
|12
|1796
|16
Report
AI Summary
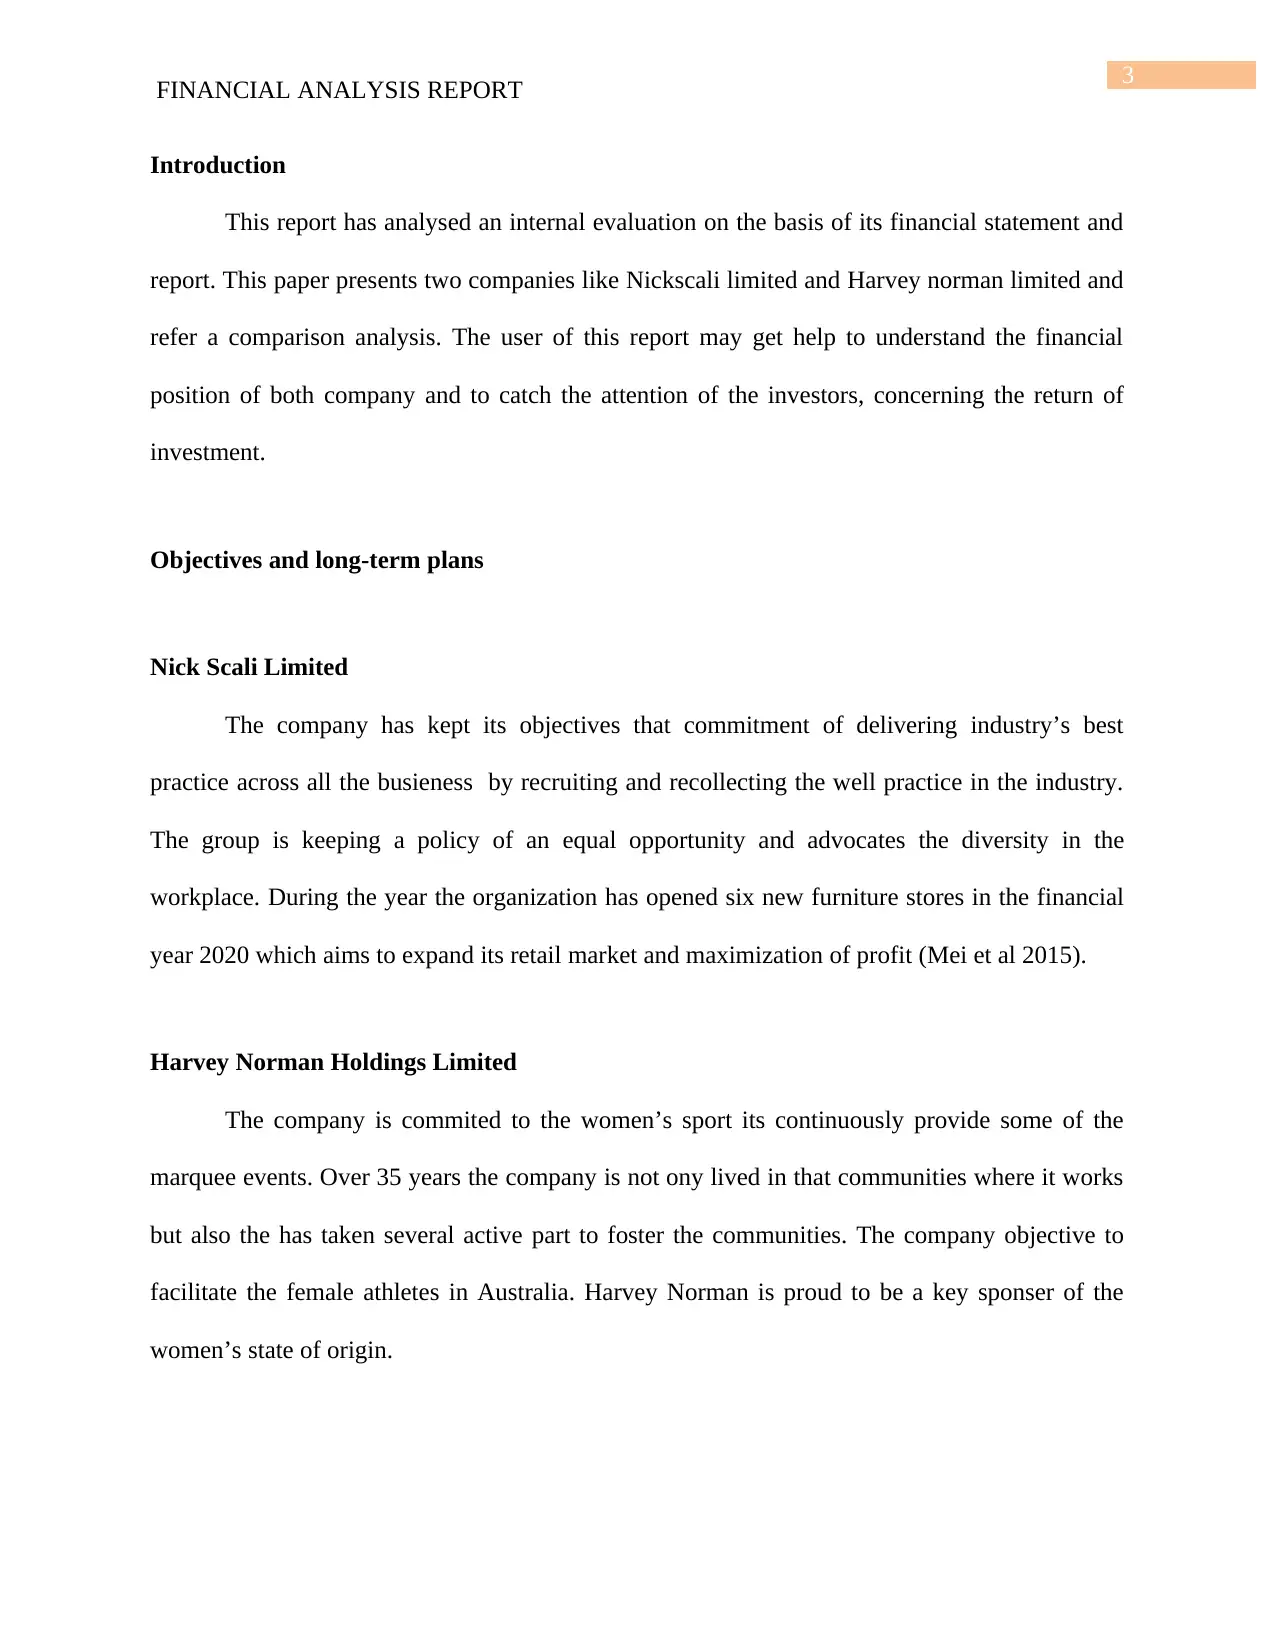
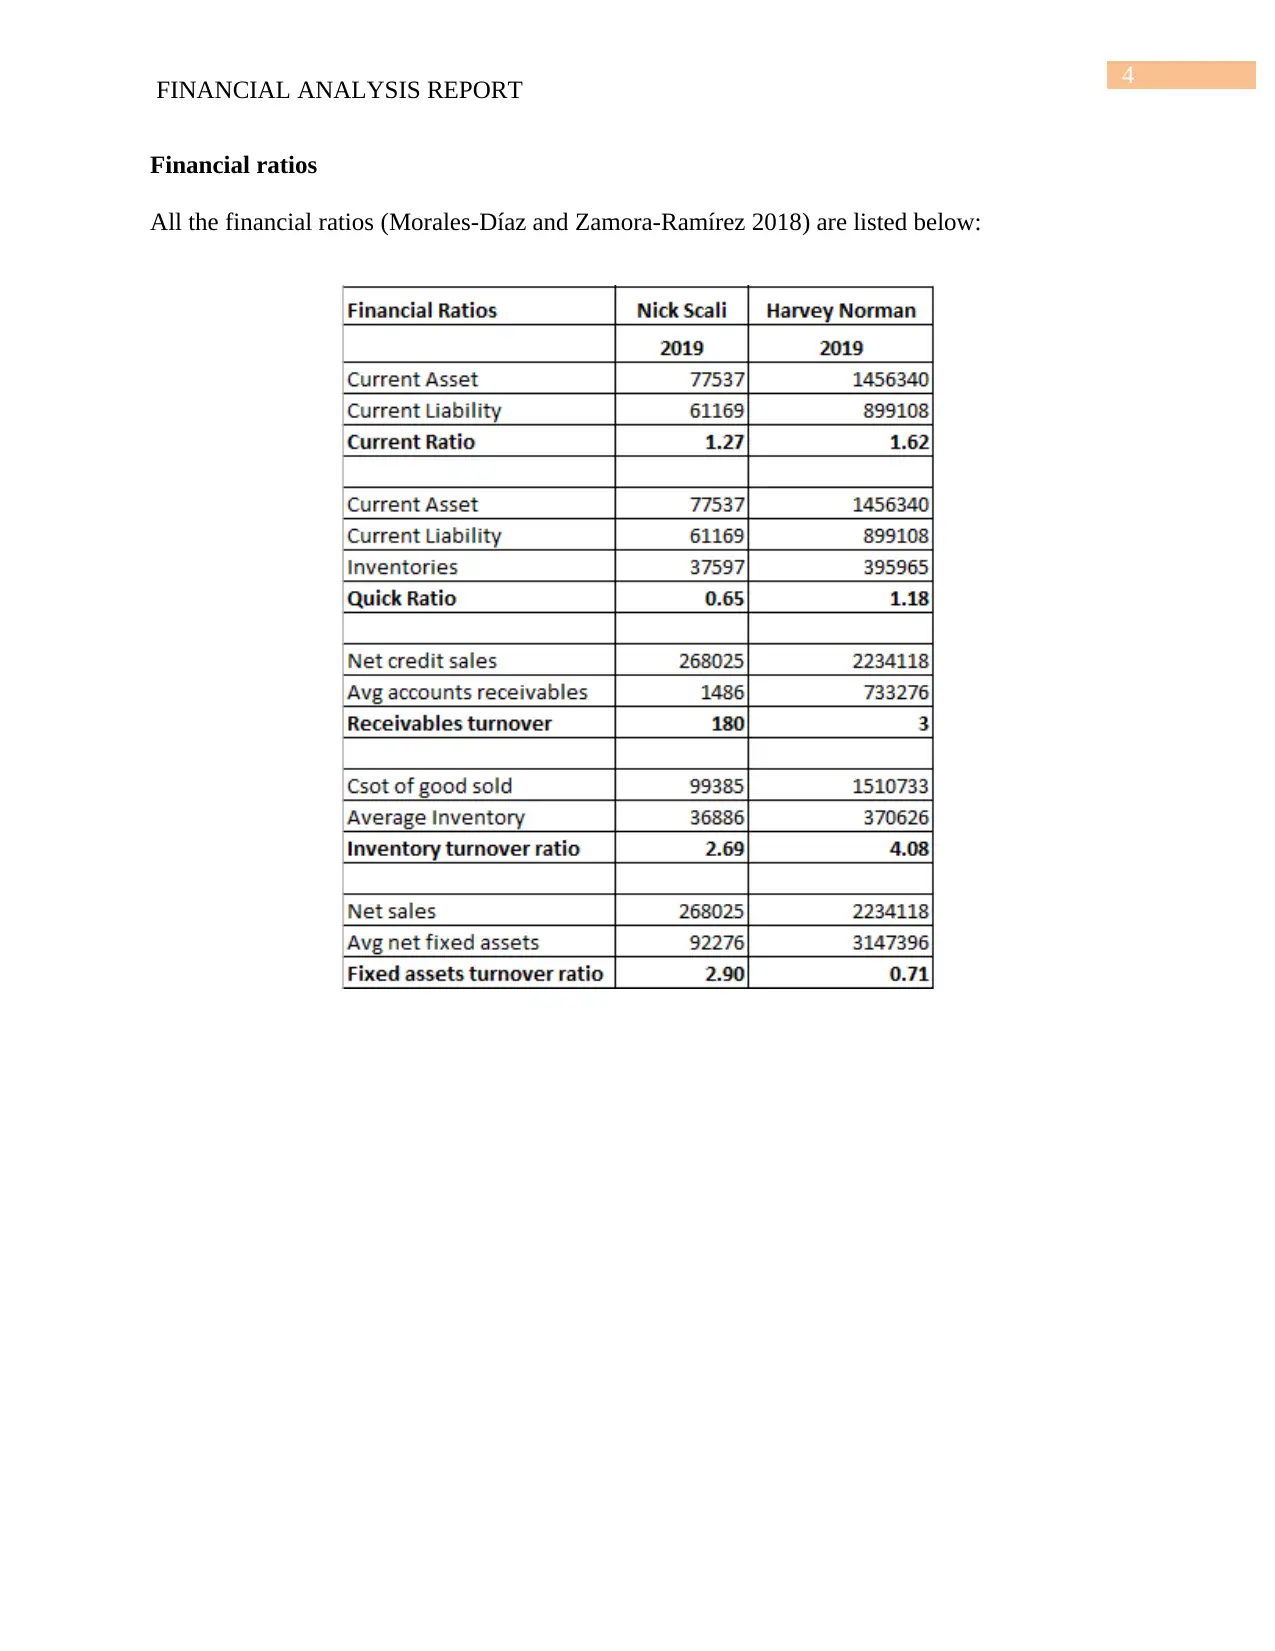
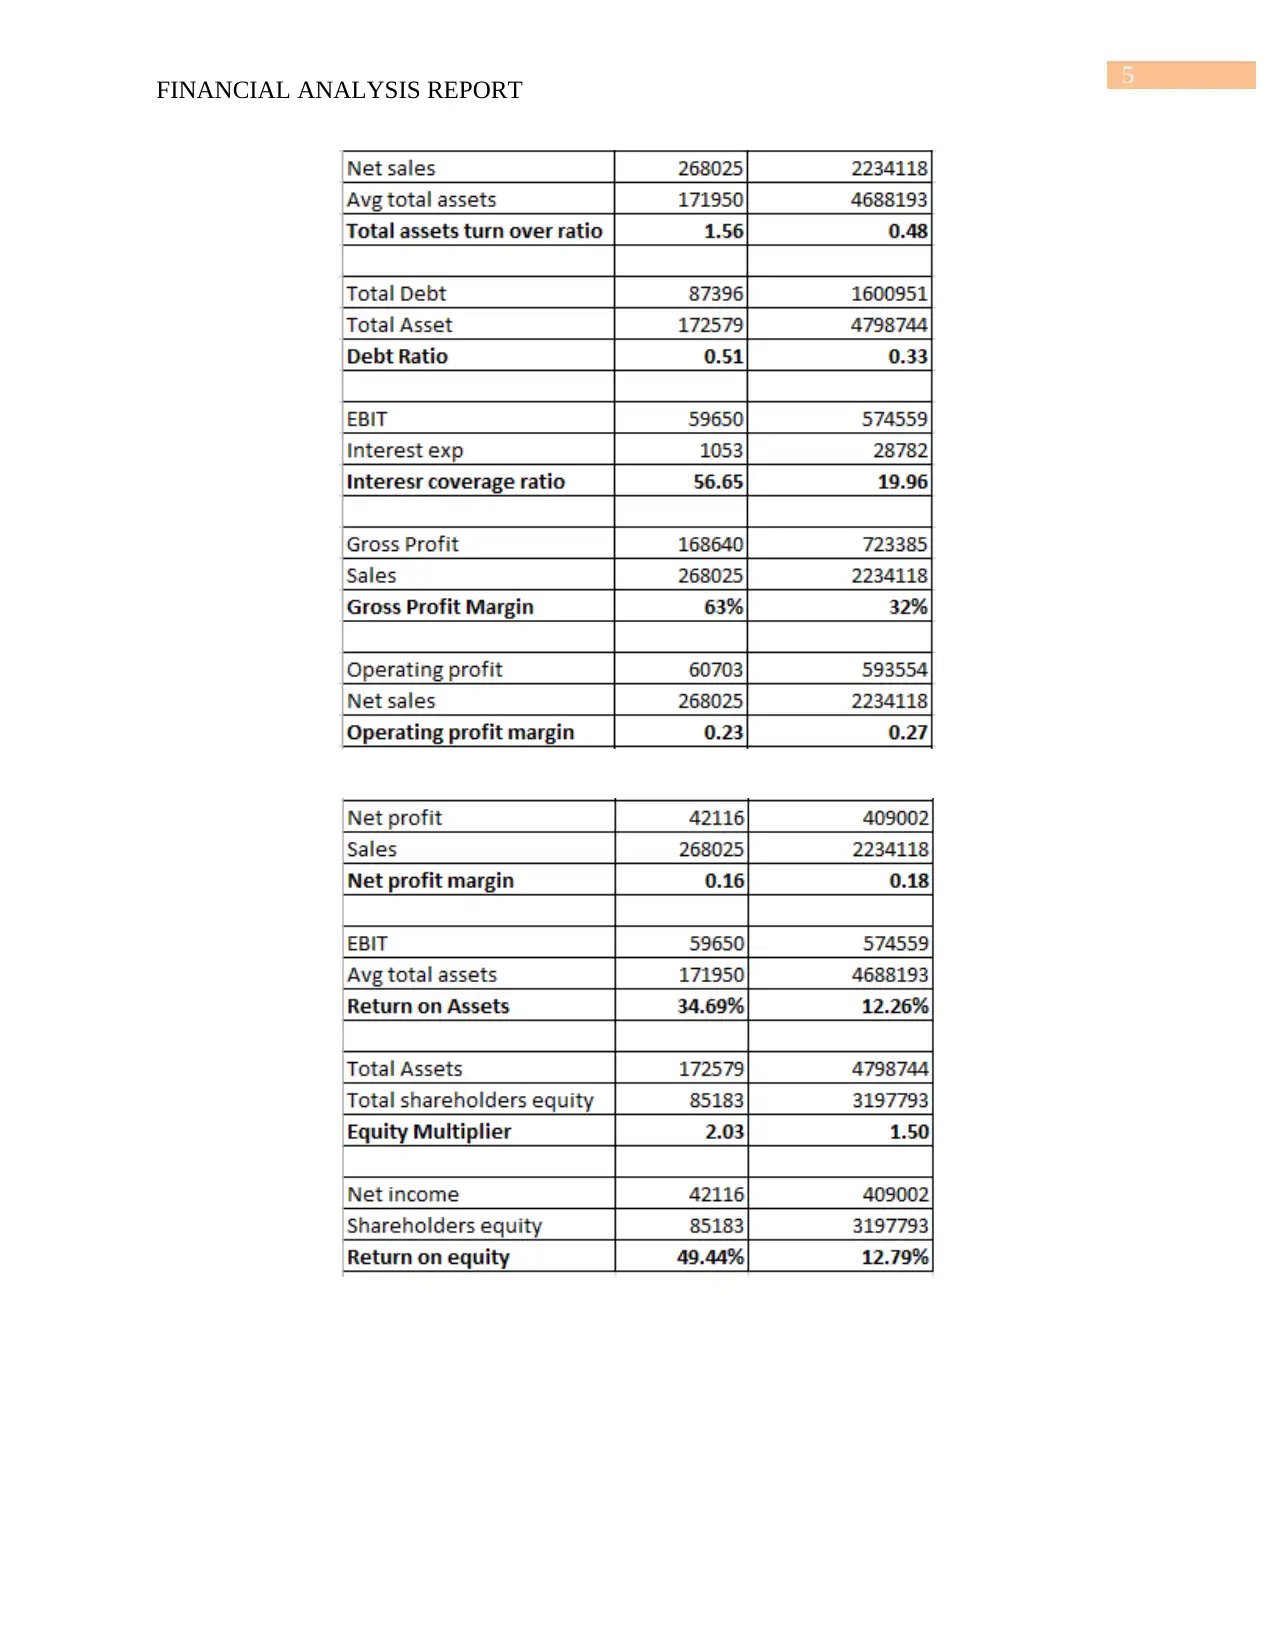
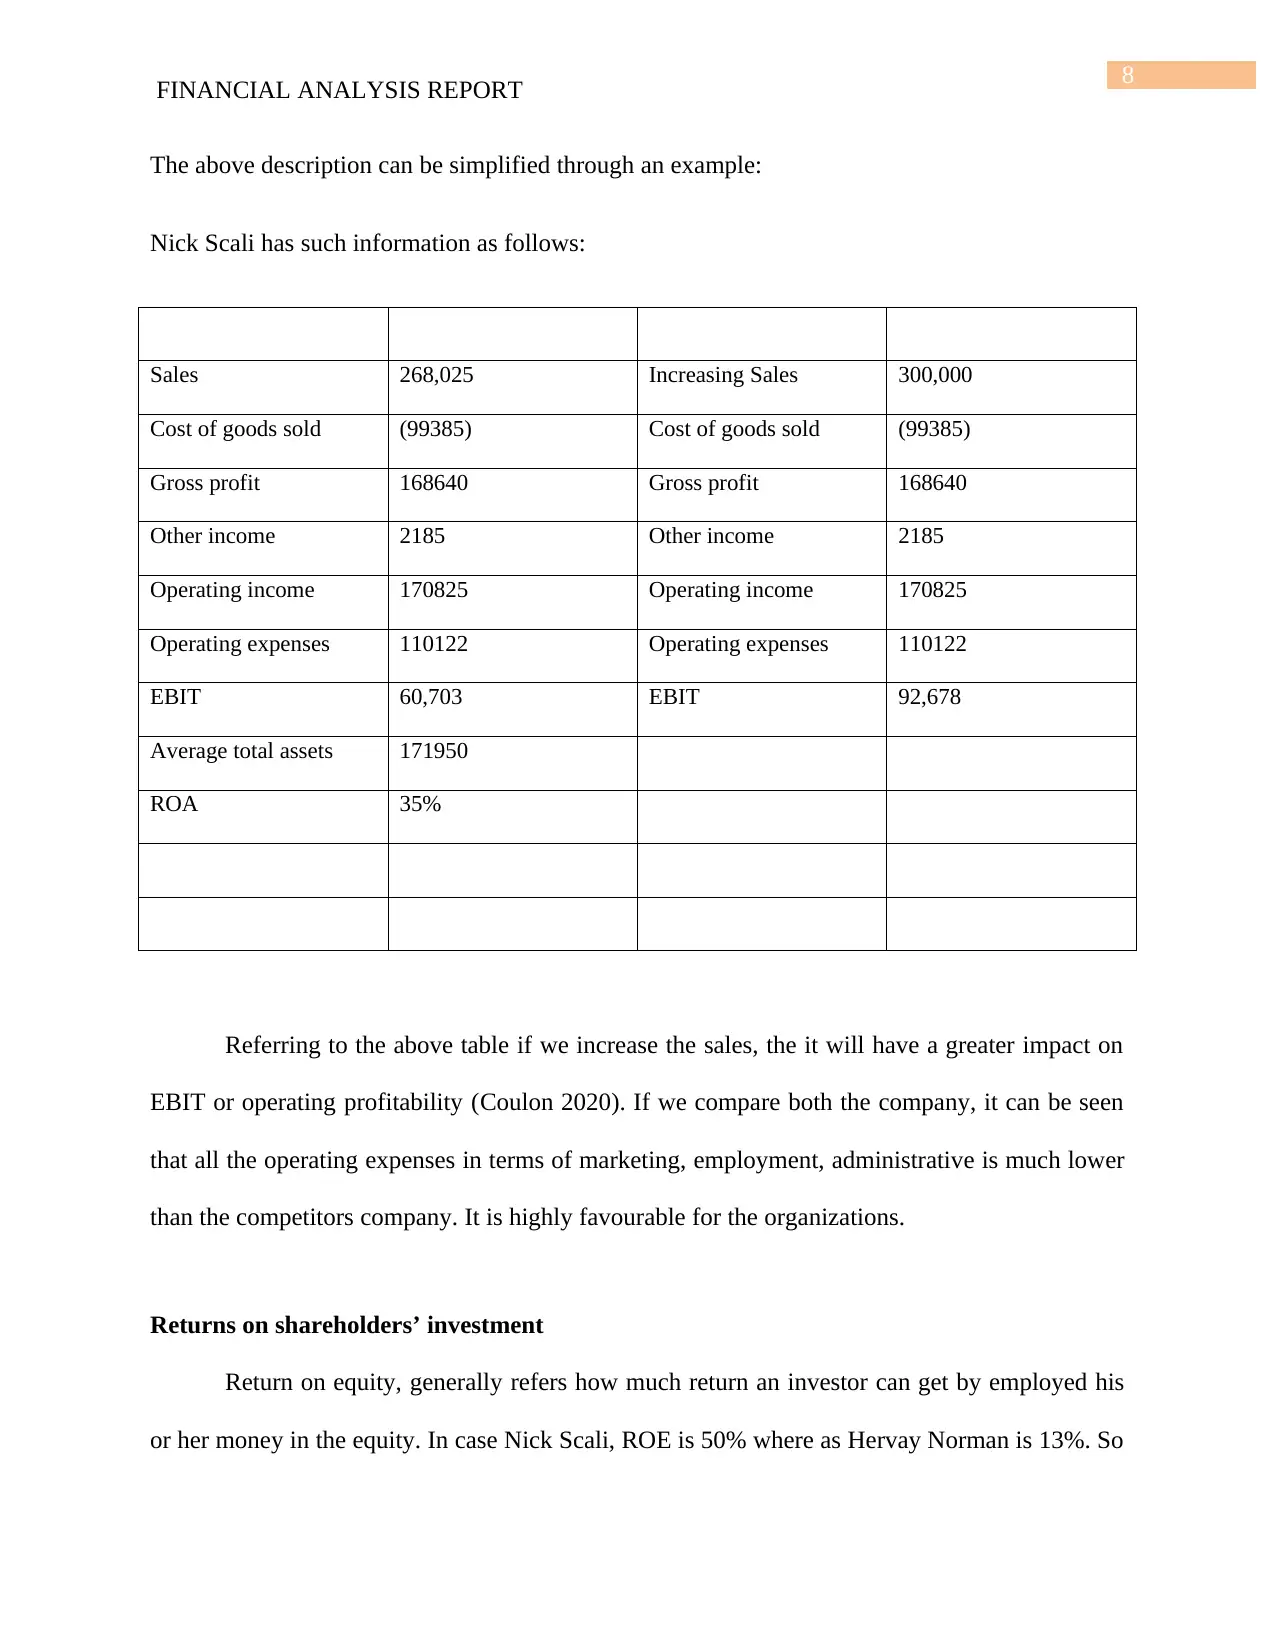
This report presents a comprehensive financial analysis of Nick Scali Limited and Harvey Norman Holdings Limited, comparing their performance based on 2019 annual reports. The analysis covers key financial aspects, including objectives, liquidity, capital structure, asset management efficiency, profitability, and capital expenditures. The report calculates and interprets financial ratios such as current ratio, quick ratio, ROA, ROE, and asset turnover to assess each company's financial health and operational effectiveness. The findings highlight Nick Scali's strong asset management and shareholder returns, while also acknowledging Harvey Norman's strengths. The report concludes with recommendations for management, emphasizing strategies to enhance revenue generation and overall financial performance. This analysis offers valuable insights for investors and stakeholders seeking to understand the financial positions and strategic decisions of these retail companies.
Contribute Materials
Your contribution can guide someone’s learning journey. Share your
documents today.

Running head: FINANCIAL ANALYSIS REPORT
Financial analysis report
Name of the student
Name of the university
Student ID
Author note
Financial analysis report
Name of the student
Name of the university
Student ID
Author note
Secure Best Marks with AI Grader
Need help grading? Try our AI Grader for instant feedback on your assignments.

1
FINANCIAL ANALYSIS REPORT
Executive summary
Many times the investors usually finds some relevant evidence or data about the company
where they want to invest. In that case financial statement analysis is an important port for
assessing a company. A well defined analysis can give better position to the investors. This paper
evaluates all the facts of the company named as Nick Scali Limited and Harvey Norman Limited,
and suggest which is the best option to invest. On the other part the company aslo responsible to
manage its operations keeps a viable financial position to make a growth. To evaluate the
company financial statement and performance of the concerned company, management will
analyse some key financial ratios like current ratio, ROA, ROE, Net Profit Margin etc. this
research paper describe how the company mange their operation financially and what is the key
factor which helps to maximize their profit even if they individually hold low ROA. This study
also frames a comparison of two companies by critically evaluates its financial statement.

2
FINANCIAL ANALYSIS REPORT
Table of Contents
Introduction......................................................................................................................................3
Objectives and long-term plans.......................................................................................................4
Nick Scali Limited...........................................................................................................................4
Harvey Norman Holdings Limited..................................................................................................4
Financial ratios.................................................................................................................................4
Liquidity, capital structure and asset management efficiency.........................................................7
Capital structure...............................................................................................................................7
Asset management efficiency..........................................................................................................8
Operating profitability.....................................................................................................................8
Returns on shareholders’ investment...............................................................................................9
Capital expenditures......................................................................................................................10
Conclusion and recommendations.................................................................................................10
Reference.......................................................................................................................................11

3
FINANCIAL ANALYSIS REPORT
Introduction
This report has analysed an internal evaluation on the basis of its financial statement and
report. This paper presents two companies like Nickscali limited and Harvey norman limited and
refer a comparison analysis. The user of this report may get help to understand the financial
position of both company and to catch the attention of the investors, concerning the return of
investment.
Objectives and long-term plans
Nick Scali Limited
The company has kept its objectives that commitment of delivering industry’s best
practice across all the busieness by recruiting and recollecting the well practice in the industry.
The group is keeping a policy of an equal opportunity and advocates the diversity in the
workplace. During the year the organization has opened six new furniture stores in the financial
year 2020 which aims to expand its retail market and maximization of profit (Mei et al 2015).
Harvey Norman Holdings Limited
The company is commited to the women’s sport its continuously provide some of the
marquee events. Over 35 years the company is not ony lived in that communities where it works
but also the has taken several active part to foster the communities. The company objective to
facilitate the female athletes in Australia. Harvey Norman is proud to be a key sponser of the
women’s state of origin.
Secure Best Marks with AI Grader
Need help grading? Try our AI Grader for instant feedback on your assignments.

4
FINANCIAL ANALYSIS REPORT
Financial ratios
All the financial ratios (Morales-Díaz and Zamora-Ramírez 2018) are listed below:
FINANCIAL ANALYSIS REPORT
Financial ratios
All the financial ratios (Morales-Díaz and Zamora-Ramírez 2018) are listed below:

5
FINANCIAL ANALYSIS REPORT

6
FINANCIAL ANALYSIS REPORT
Liquidity, capital structure and asset management efficiency
In case of liquidity (Alshatti 2015), it refers how the company’s assets are easily
converted into cash and meet the short term obiligations. Most usually the company uses two
basic ratio like current ratio and quick ratio to measure the liquidity position. Here, in this study
current ratio of Nick Scali Limited is 1.27 and for Harvey Norman Limited is 1.62, so both the
companies do have desirable liquidity position as it is greater than 1. But Harvey Norman is
much better to have liquidity.
As per the quick ratio (Rahayu and Hari 2016), Nick Scali shows less, whereas the
Norman Harvey is much better position.
Nick Scali Limited= 0.65 <1 not desirable
Norman Harvey Limited= 1.18 < 1 Desirable
Capital structure
The capital structure usually defines by the company as equity and debt used by the
company for financing
Nick Scali limited used equity of 85,183 and debts of 87,396, so here we called it is
described as debt financing (Yazdanfar and Öhman 2015).
On the other hand, Harvey Norman shows equity as 31,97,793 and debts are 16,00,95, so
it is called as equity financing (Nguyen and Rugman 2015).
Paraphrase This Document
Need a fresh take? Get an instant paraphrase of this document with our AI Paraphraser

7
FINANCIAL ANALYSIS REPORT
Asset management efficiency
This concepts refers how the organizations manage its assets to convert into sales. Higher
the ratio is better for the organizations, that implies the company can generates revenue from the
assets.
Nick Scali has fixed assets turnover ratio (Warrad and Rania 2015) is 1.56, better as
compare to Harvey Norman as it has 0.66. which implies the Nick is performing well to generate
revenue from its assets.
Looking into the total assets turnover ratio Nick has 1.56, whereas Harvey shows 0.48.
Better situation for Nick Scali Limited for asset management.
Return on assets (ROA) also indicates to an manager or investors that how the company
efficiently managed to use its assets for generating its revenue. Nick Scali has return on assets is
approximately 35% where as Harvey Norman has 12%. In addition to this return on equity
(Ichsani and Suhardi 2015) for the Nick Scali is 49.44% but in Harvey Norman is 13%.
Therefore the Nick Scali limited is highly managed their assets to generate revenue.
Operating profitability
As discussed above in case of Nick Scali, Return on assets much better as compare to its
competitor, Harvey Norman. But with the Low retun on assets, the company also improve their
operating profitability by increasing their sales or less spending. Decreasing the production cost
is simultaneously bringing the extra revenue. Therefor its increase the operating profitability.
Tracking the business expenses and create an economic sacle in the business operations
involves a maximization of opeartiong profit margin.

8
FINANCIAL ANALYSIS REPORT
The above description can be simplified through an example:
Nick Scali has such information as follows:
Sales 268,025 Increasing Sales 300,000
Cost of goods sold (99385) Cost of goods sold (99385)
Gross profit 168640 Gross profit 168640
Other income 2185 Other income 2185
Operating income 170825 Operating income 170825
Operating expenses 110122 Operating expenses 110122
EBIT 60,703 EBIT 92,678
Average total assets 171950
ROA 35%
Referring to the above table if we increase the sales, the it will have a greater impact on
EBIT or operating profitability (Coulon 2020). If we compare both the company, it can be seen
that all the operating expenses in terms of marketing, employment, administrative is much lower
than the competitors company. It is highly favourable for the organizations.
Returns on shareholders’ investment
Return on equity, generally refers how much return an investor can get by employed his
or her money in the equity. In case Nick Scali, ROE is 50% where as Hervay Norman is 13%. So

9
FINANCIAL ANALYSIS REPORT
in Nick’s stock deliver higher percentage of return to the investors. Therefore this stock normally
attract the investros to invest money in this organization. Return on equity measures how
effective management is using by the company to create revenue.
For an illustrative example, if an investor invest 1 lac in Nick Scali Limited he or she
may get approximately 50% return that menas 50000 whereas if another investor invest 100000,
then may get 13% that is 13000. So Nick Scalin will be the best profitable company for
inveators.
Capital expenditures
Capital expenditure are commonly known as CAPEX, which is used to acquire physical
assets such as property, buildings.
In the case of Nick Scali, the capital expenditure is 185,328 where as Harvey Norman
maintains its capital expenditure 696,207 after adding all of its net value. Since the wide spread
business of Harvey Norman, it incurred more capital expenditure at their property, plant and
equipment.
Conclusion and recommendations
After analysisng all the points and critically evaluate the financial statements, it can be
conclude that Nick Scali performs better rather than Harvey Norman in casse of their respective
retail sector. Though the company has low liquidity ratio, but it delivers a good return to the
investors. As per analysis of the finanacial report internally, it will be recommended to the
manangemnt, that the company will give more pressure to extract revenue by increasing sales,
otherwise the growth of the company will get hamper
Secure Best Marks with AI Grader
Need help grading? Try our AI Grader for instant feedback on your assignments.

10
FINANCIAL ANALYSIS REPORT
Reference
Alshatti, A.S., 2015. The effect of the liquidity management on profitability in the Jordanian
commercial banks. International Journal of Business and Management, 10(1), p.62.
Coulon, Y., 2020. Profitability and Performance Ratios. In Rational Investing with Ratios (pp.
85-104). Palgrave Pivot, Cham.
Ichsani, S. and Suhardi, A.R., 2015. The effect of return on equity (ROE) and return on
investment (ROI) on trading volume. Procedia-Social and Behavioral Sciences, 211, pp.896-
902.
Mei, J., Li, K., Ouyang, A. and Li, K., 2015. A profit maximization scheme with guaranteed
quality of service in cloud computing. IEEE Transactions on Computers, 64(11), pp.3064-3078.
Morales-Díaz, J. and Zamora-Ramírez, C., 2018. The impact of IFRS 16 on key financial ratios:
a new methodological approach. Accounting in Europe, 15(1), pp.105-133.
Nguyen, Q.T. and Rugman, A.M., 2015. Internal equity financing and the performance of
multinational subsidiaries in emerging economies. Journal of International Business
Studies, 46(4), pp.468-490.
Rahayu, A.S. and Hari, M., 2016. Pengaruh Current Ratio dan Quick Ratio terhadap Kebijakan
Dividen Melalui Return On Equity Pada Perusahaan Manufaktur yang Terdaftar di BEI Tahun
2014. Ekonomi Bisnis, 21(2), pp.231-240.
Warrad, L. and Rania, A.O., 2015. The Impact of Activity Ratio among Industrial Sectors’
Performance: Jordanian Case. Research Journal of Finance and Accounting, 6(6), pp.173-178.

11
FINANCIAL ANALYSIS REPORT
Yazdanfar, D. and Öhman, P., 2015. Debt financing and firm performance: an empirical study
based on Swedish data. The Journal of Risk Finance.
FINANCIAL ANALYSIS REPORT
Yazdanfar, D. and Öhman, P., 2015. Debt financing and firm performance: an empirical study
based on Swedish data. The Journal of Risk Finance.
1 out of 12
Related Documents

Your All-in-One AI-Powered Toolkit for Academic Success.
+13062052269
info@desklib.com
Available 24*7 on WhatsApp / Email
Unlock your academic potential
© 2024 | Zucol Services PVT LTD | All rights reserved.