Financial Statement Analysis: AE Multi Holdings Berhad & Muda Holdings
VerifiedAdded on 2023/01/19
|15
|3161
|45
Report
AI Summary
This report presents a financial statement analysis of AE Multi Holdings Berhad and Muda Holdings Berhad, both listed on Bursa Malaysia, for the years 2017 and 2018. The analysis includes a detailed examination of their income statements, balance sheets, and cash flow statements. The report highlights key financial metrics such as revenue, cost of sales, gross profit, operating income, and net income, comparing the performance of both companies over the two-year period. It also assesses their financial positions, including assets, liabilities, and equity, along with an evaluation of their liquidity and profitability. The report utilizes vertical analysis and financial ratios to provide a comprehensive understanding of the companies' financial health and trends, offering insights into their operational efficiency and overall financial performance, supported by charts and graphs to visualize the data and facilitate a comparative analysis.
Financial
Statement
Analysis
Statement
Analysis
Paraphrase This Document
Need a fresh take? Get an instant paraphrase of this document with our AI Paraphraser
Table of Contents
INTRODUCTION...........................................................................................................................1
MAIN BODY...................................................................................................................................1
Financial statement Analysis.......................................................................................................1
CONCLUSION..............................................................................................................................10
REFERENCES..............................................................................................................................12
INTRODUCTION
Financial statement analysis is the procedure of determining the organisation's financial
statements for decision making process (Kewo & Afiah, 2017) . The analysis conduct by the
external stakeholders to understand the financial position of the organisation, performance and
business value. In the financial statements consist of cash flow, income statement, balance sheet
of the company. These statements are producing for particular period of time. The users of
statement analysis such as creditors, regulatory authorities, investors etc. There are taking two
organisation that listed into Bursa Malaysia. First one AE multi Holdings Berhad is an
investment based holding company. It is providing services to their subsidiaries such as printed
circuit boards, investment holding and electronic products. Second one Muda Holdings Berhad
which is an investment holding company. It is operating business in manufacturing and trading.
In the report analysis the income statement of 2017 & 2018 and identify the changes in the
financial statement.
MAIN BODY
Financial statement Analysis
AE Multi Holdings Berhad company invest into different services and provide guidance
to their subsidiaries. It is categorised into different segment such as electronic product, printed
circuit and investment holding. Printed circuit boards are manufacturing by the company and
selling them and other related products (Jang & Rho, 2016). The electronic products is
assembling by the company and trading the accessories. There are analysing the financial
statement of the year 2017 & 2018.
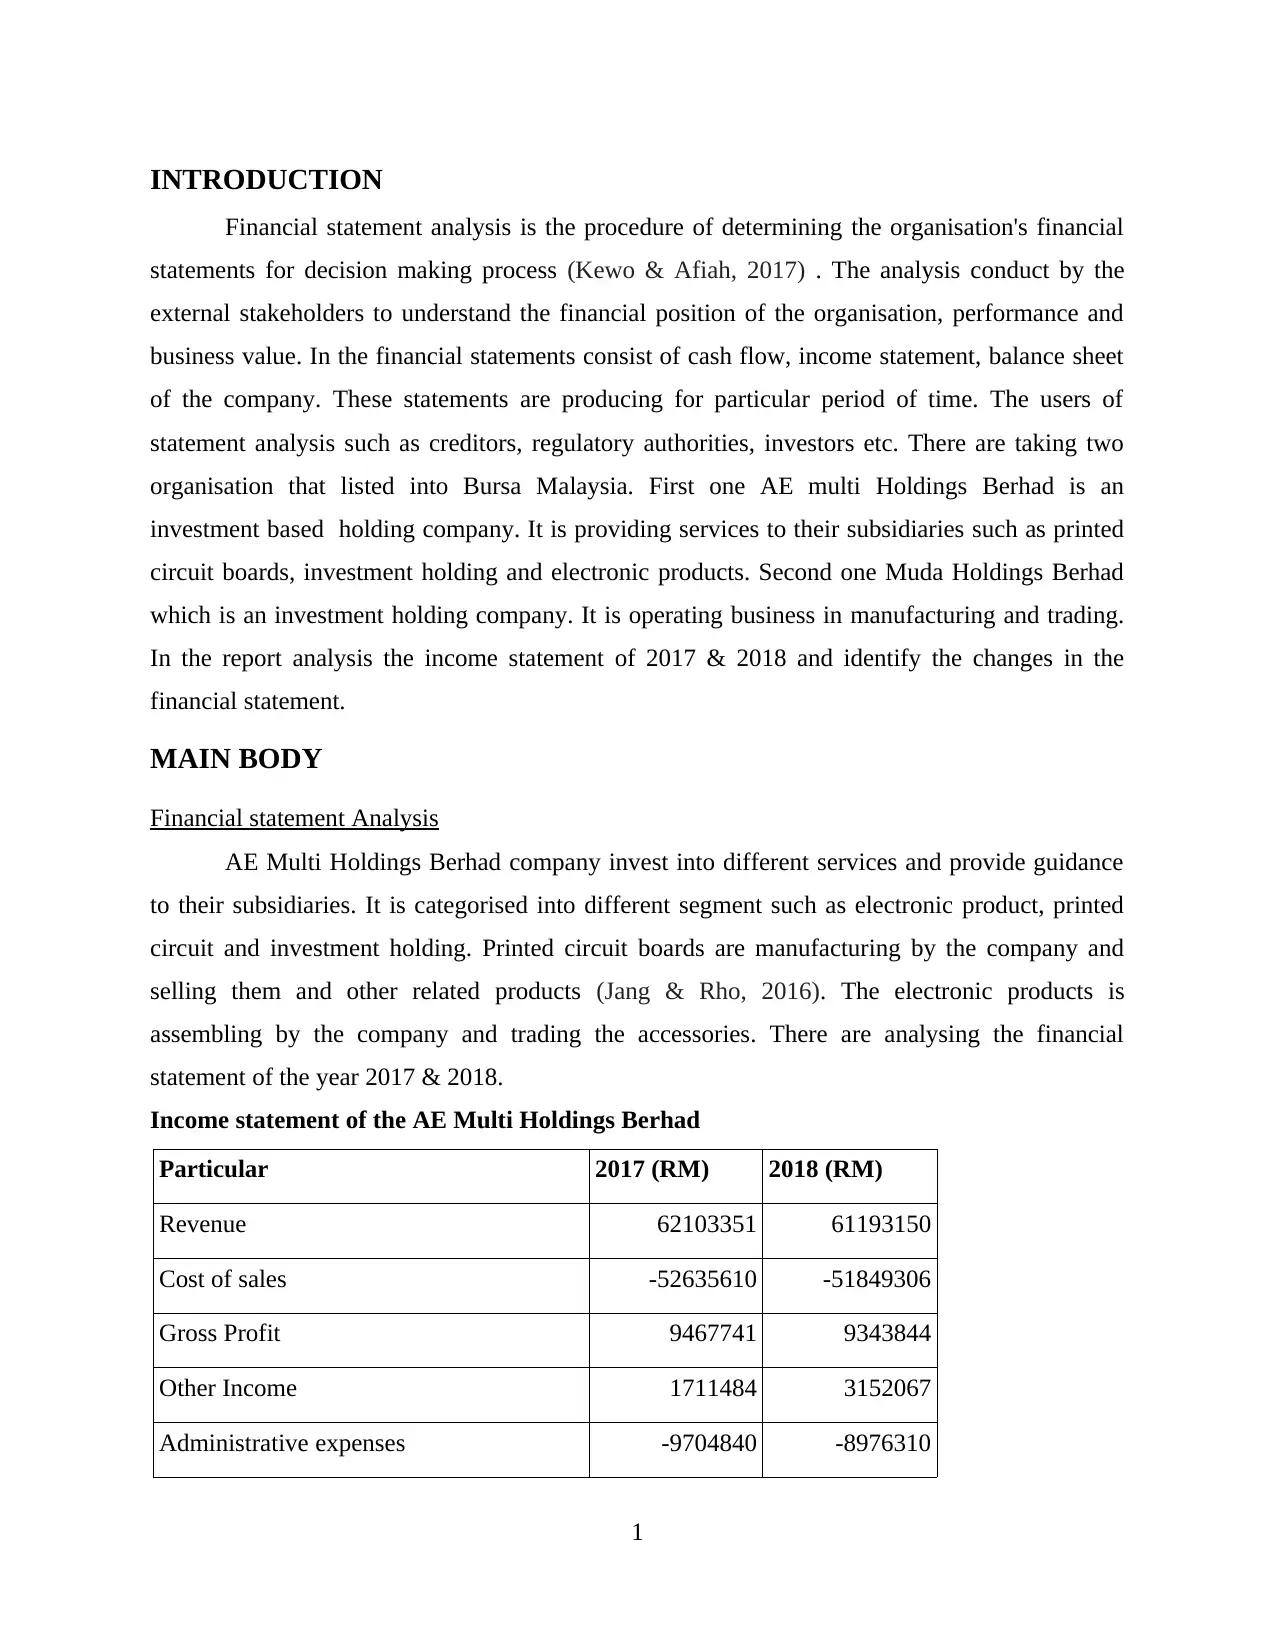
Income statement of the AE Multi Holdings Berhad
Particular 2017 (RM) 2018 (RM)
Revenue 62103351 61193150
Cost of sales -52635610 -51849306
Gross Profit 9467741 9343844
Other Income 1711484 3152067
Administrative expenses -9704840 -8976310
1
Financial statement analysis is the procedure of determining the organisation's financial
statements for decision making process (Kewo & Afiah, 2017) . The analysis conduct by the
external stakeholders to understand the financial position of the organisation, performance and
business value. In the financial statements consist of cash flow, income statement, balance sheet
of the company. These statements are producing for particular period of time. The users of
statement analysis such as creditors, regulatory authorities, investors etc. There are taking two
organisation that listed into Bursa Malaysia. First one AE multi Holdings Berhad is an
investment based holding company. It is providing services to their subsidiaries such as printed
circuit boards, investment holding and electronic products. Second one Muda Holdings Berhad
which is an investment holding company. It is operating business in manufacturing and trading.
In the report analysis the income statement of 2017 & 2018 and identify the changes in the
financial statement.
MAIN BODY
Financial statement Analysis
AE Multi Holdings Berhad company invest into different services and provide guidance
to their subsidiaries. It is categorised into different segment such as electronic product, printed
circuit and investment holding. Printed circuit boards are manufacturing by the company and
selling them and other related products (Jang & Rho, 2016). The electronic products is
assembling by the company and trading the accessories. There are analysing the financial
statement of the year 2017 & 2018.
Income statement of the AE Multi Holdings Berhad
Particular 2017 (RM) 2018 (RM)
Revenue 62103351 61193150
Cost of sales -52635610 -51849306
Gross Profit 9467741 9343844
Other Income 1711484 3152067
Administrative expenses -9704840 -8976310
1
⊘ This is a preview!⊘
Do you want full access?
Subscribe today to unlock all pages.
Trusted by 1+ million students worldwide
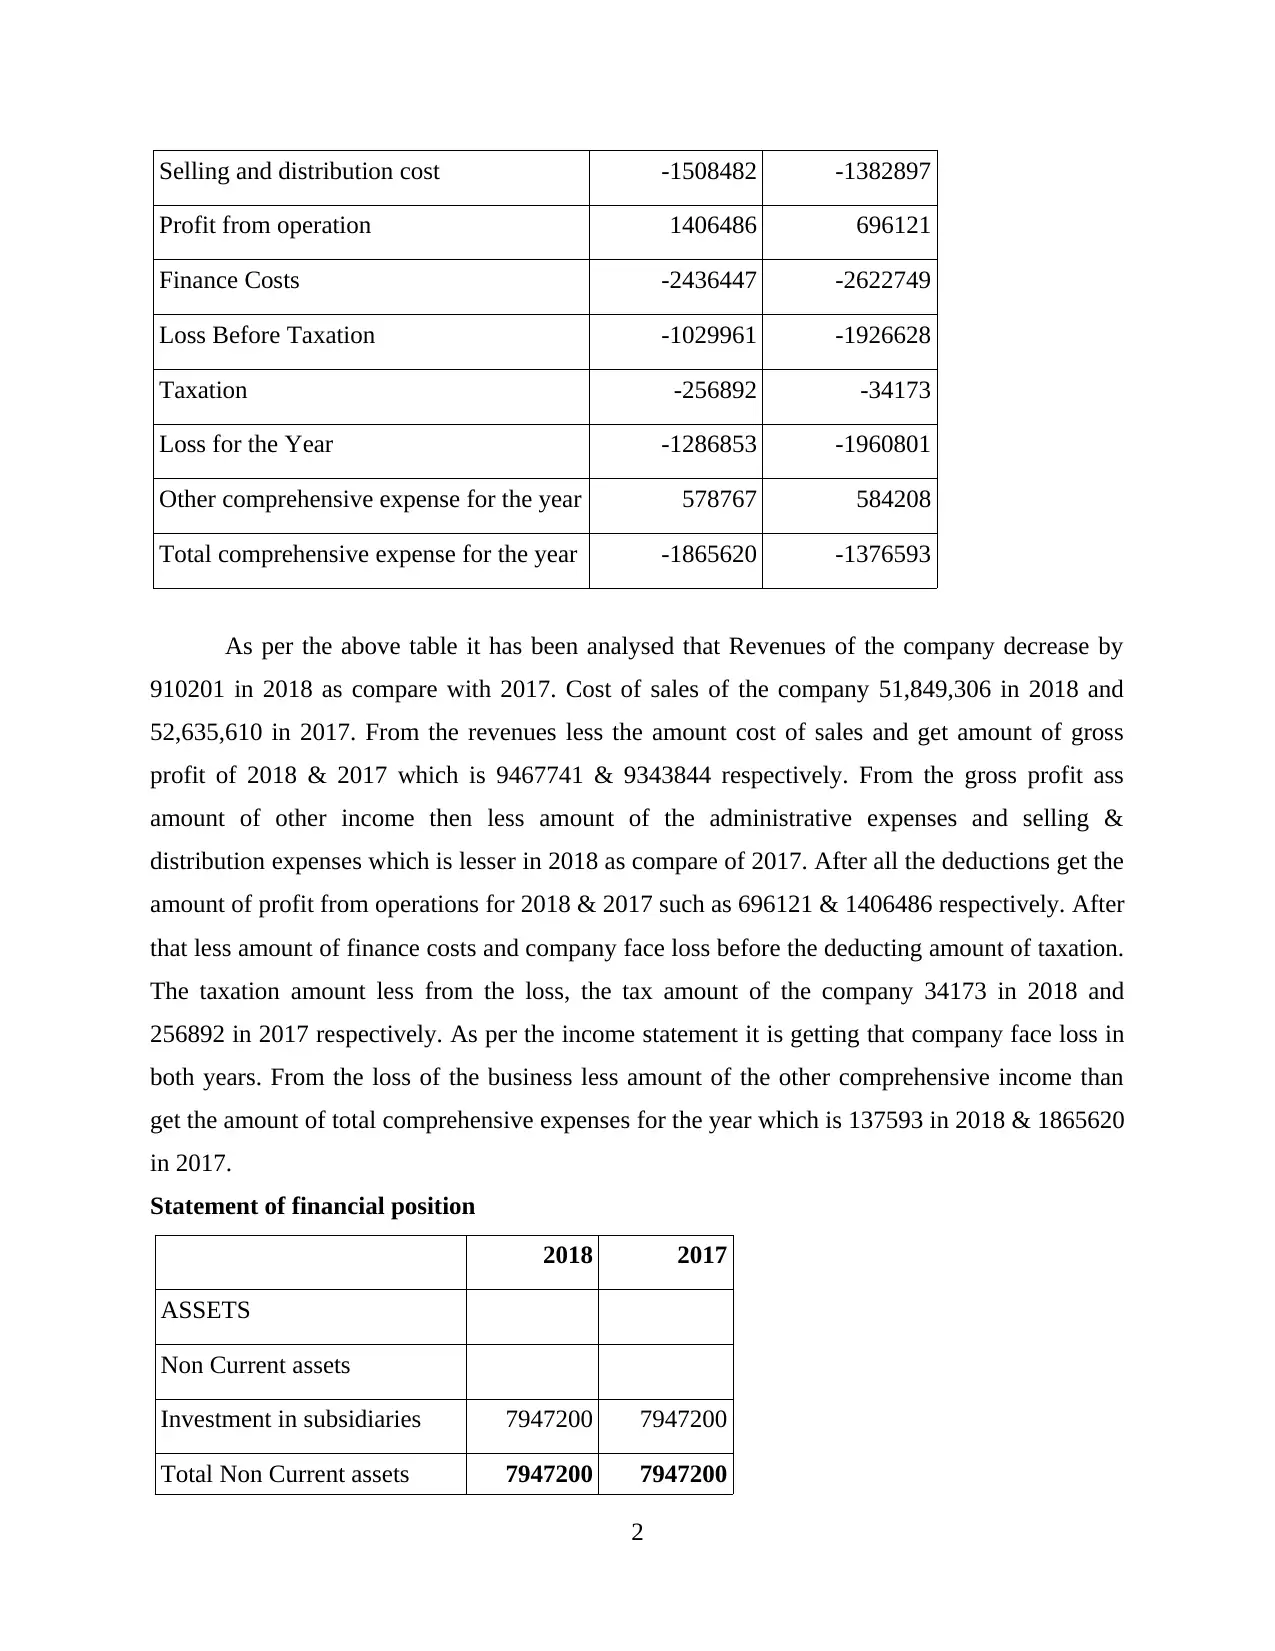
Selling and distribution cost -1508482 -1382897
Profit from operation 1406486 696121
Finance Costs -2436447 -2622749
Loss Before Taxation -1029961 -1926628
Taxation -256892 -34173
Loss for the Year -1286853 -1960801
Other comprehensive expense for the year 578767 584208
Total comprehensive expense for the year -1865620 -1376593
As per the above table it has been analysed that Revenues of the company decrease by
910201 in 2018 as compare with 2017. Cost of sales of the company 51,849,306 in 2018 and
52,635,610 in 2017. From the revenues less the amount cost of sales and get amount of gross
profit of 2018 & 2017 which is 9467741 & 9343844 respectively. From the gross profit ass
amount of other income then less amount of the administrative expenses and selling &
distribution expenses which is lesser in 2018 as compare of 2017. After all the deductions get the
amount of profit from operations for 2018 & 2017 such as 696121 & 1406486 respectively. After
that less amount of finance costs and company face loss before the deducting amount of taxation.
The taxation amount less from the loss, the tax amount of the company 34173 in 2018 and
256892 in 2017 respectively. As per the income statement it is getting that company face loss in
both years. From the loss of the business less amount of the other comprehensive income than
get the amount of total comprehensive expenses for the year which is 137593 in 2018 & 1865620
in 2017.
Statement of financial position
2018 2017
ASSETS
Non Current assets
Investment in subsidiaries 7947200 7947200
Total Non Current assets 7947200 7947200
2
Paraphrase This Document
Need a fresh take? Get an instant paraphrase of this document with our AI Paraphraser
Current Assets
Amount due from
subsidiaries 41863695 44357559
Cash and cash equivalents 239835 15219
44262130 44372778
Total Assets 52209330 52319978
Equity
Share capital 40288780 40288780
Reserves 16442888 16442888
Accumulated losses -4866040 -4849329
Total Equity 51865628 51882339
Current liabilities
Trade and other payables 163962 257899
Amount due to subsidiaries 179740 179740
Total current liabilities 343702 437639
Total liabilities 343702 437639
Total equity and liabilities 52209330 52319978
3
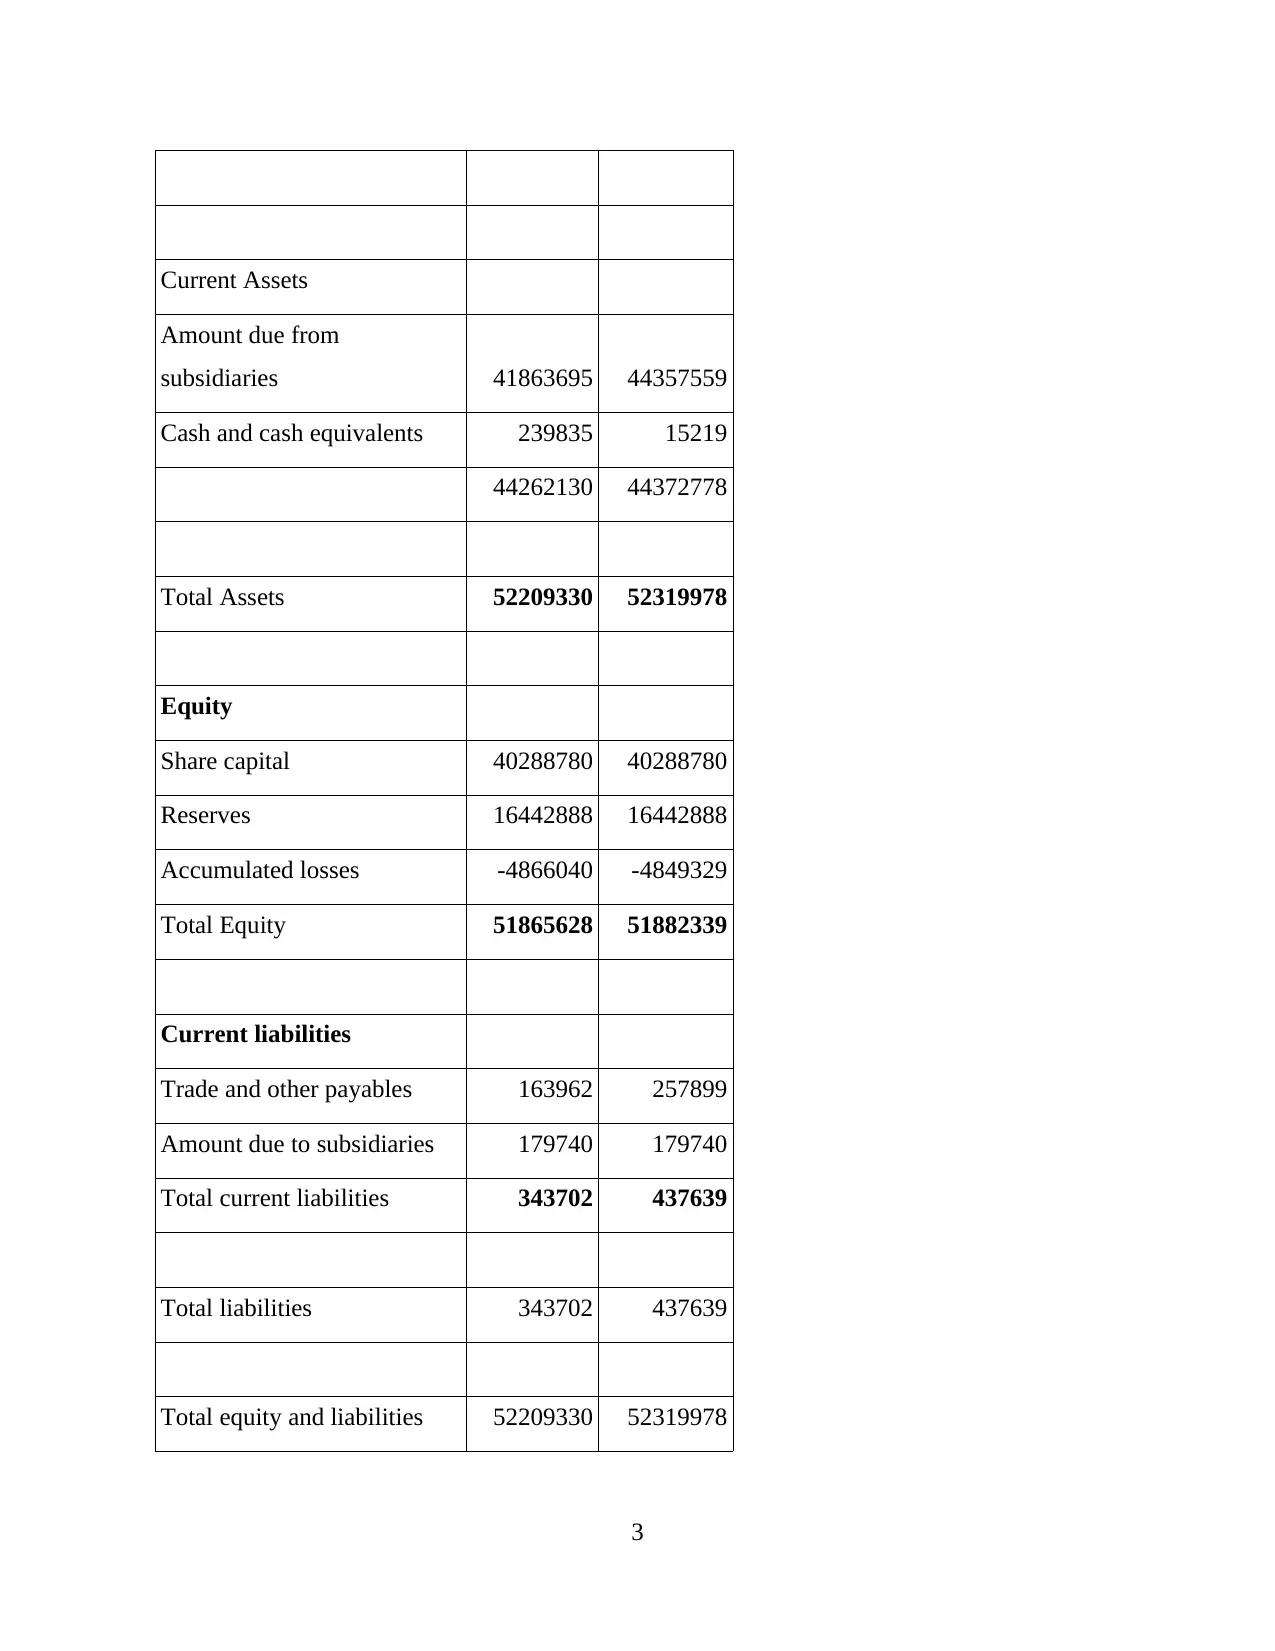
From the above table it has been compared that in the year 2018 assets do not increase &
decrease, it remain same as 2017. The non current assets of the AE Multi Holdings Berhad in
2018, 7,947,200 and also in 2017, 7,947,200. In the current assets section cash & cash
equivalents increase by 2,383,216 in 2018. It shows company have good liquid position and able
to pay off their liabilities. The total current assets of the company 44,262,130 in 2018 &
44,372,778 in 2017. Herein total assets of the company 44,262,130 in 2018 and 44,372,778 in
2017. After that calculate liability and equity of the company for both years. Share capital &
reserves of the company remain same in both years. From these amounts less accumulated losses
and get amount of total equity such as 4,866,040 in 2018 & 4,849,329 in 2017. The Current
liabilities of the business 1,63,962 in 2018 & 2,57,899 in 2017. So at the end get amount of total
liabilities then add amount of total liabilities and equity which is equal of total assets. After allthe
assessment it is compared that the amount of assets and liabilities do not increase & decrease in
2018 as compare with 2017.
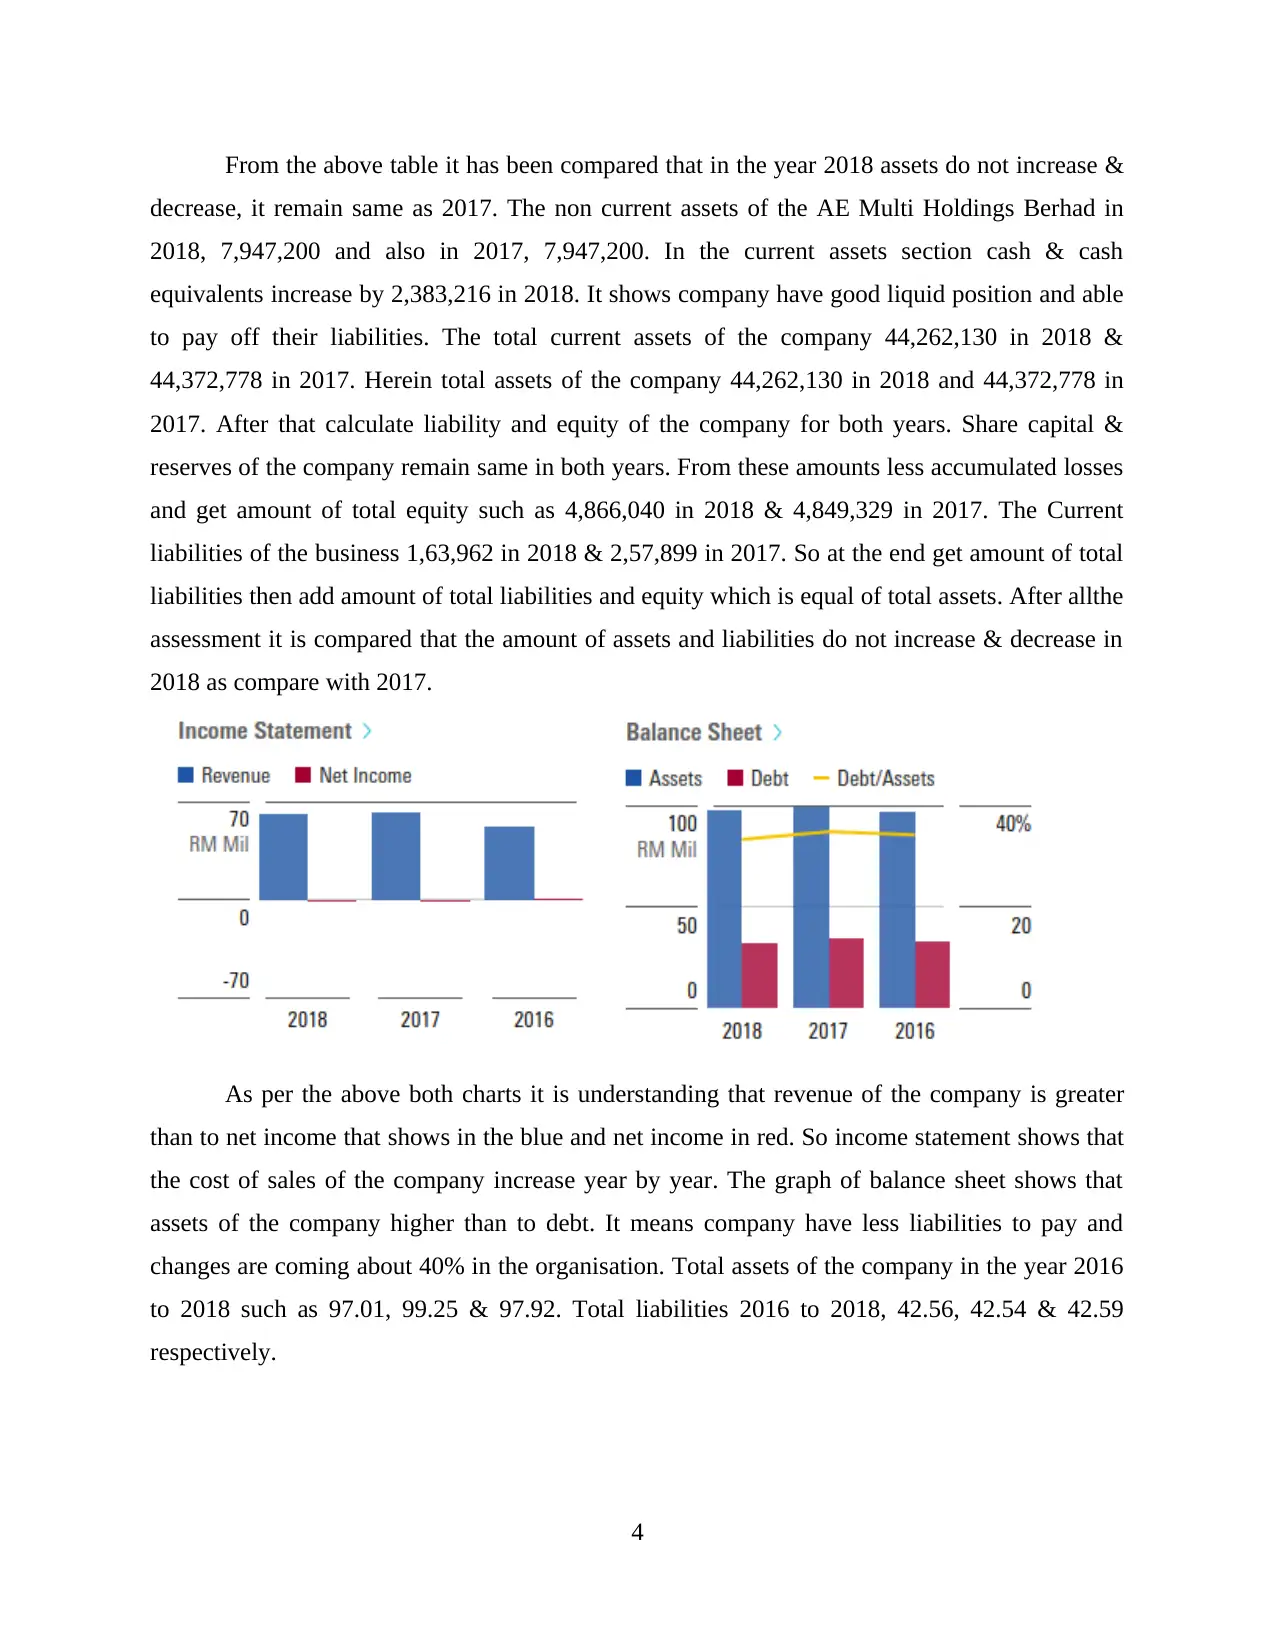
As per the above both charts it is understanding that revenue of the company is greater
than to net income that shows in the blue and net income in red. So income statement shows that
the cost of sales of the company increase year by year. The graph of balance sheet shows that
assets of the company higher than to debt. It means company have less liabilities to pay and
changes are coming about 40% in the organisation. Total assets of the company in the year 2016
to 2018 such as 97.01, 99.25 & 97.92. Total liabilities 2016 to 2018, 42.56, 42.54 & 42.59
respectively.
4
decrease, it remain same as 2017. The non current assets of the AE Multi Holdings Berhad in
2018, 7,947,200 and also in 2017, 7,947,200. In the current assets section cash & cash
equivalents increase by 2,383,216 in 2018. It shows company have good liquid position and able
to pay off their liabilities. The total current assets of the company 44,262,130 in 2018 &
44,372,778 in 2017. Herein total assets of the company 44,262,130 in 2018 and 44,372,778 in
2017. After that calculate liability and equity of the company for both years. Share capital &
reserves of the company remain same in both years. From these amounts less accumulated losses
and get amount of total equity such as 4,866,040 in 2018 & 4,849,329 in 2017. The Current
liabilities of the business 1,63,962 in 2018 & 2,57,899 in 2017. So at the end get amount of total
liabilities then add amount of total liabilities and equity which is equal of total assets. After allthe
assessment it is compared that the amount of assets and liabilities do not increase & decrease in
2018 as compare with 2017.
As per the above both charts it is understanding that revenue of the company is greater
than to net income that shows in the blue and net income in red. So income statement shows that
the cost of sales of the company increase year by year. The graph of balance sheet shows that
assets of the company higher than to debt. It means company have less liabilities to pay and
changes are coming about 40% in the organisation. Total assets of the company in the year 2016
to 2018 such as 97.01, 99.25 & 97.92. Total liabilities 2016 to 2018, 42.56, 42.54 & 42.59
respectively.
4
⊘ This is a preview!⊘
Do you want full access?
Subscribe today to unlock all pages.
Trusted by 1+ million students worldwide
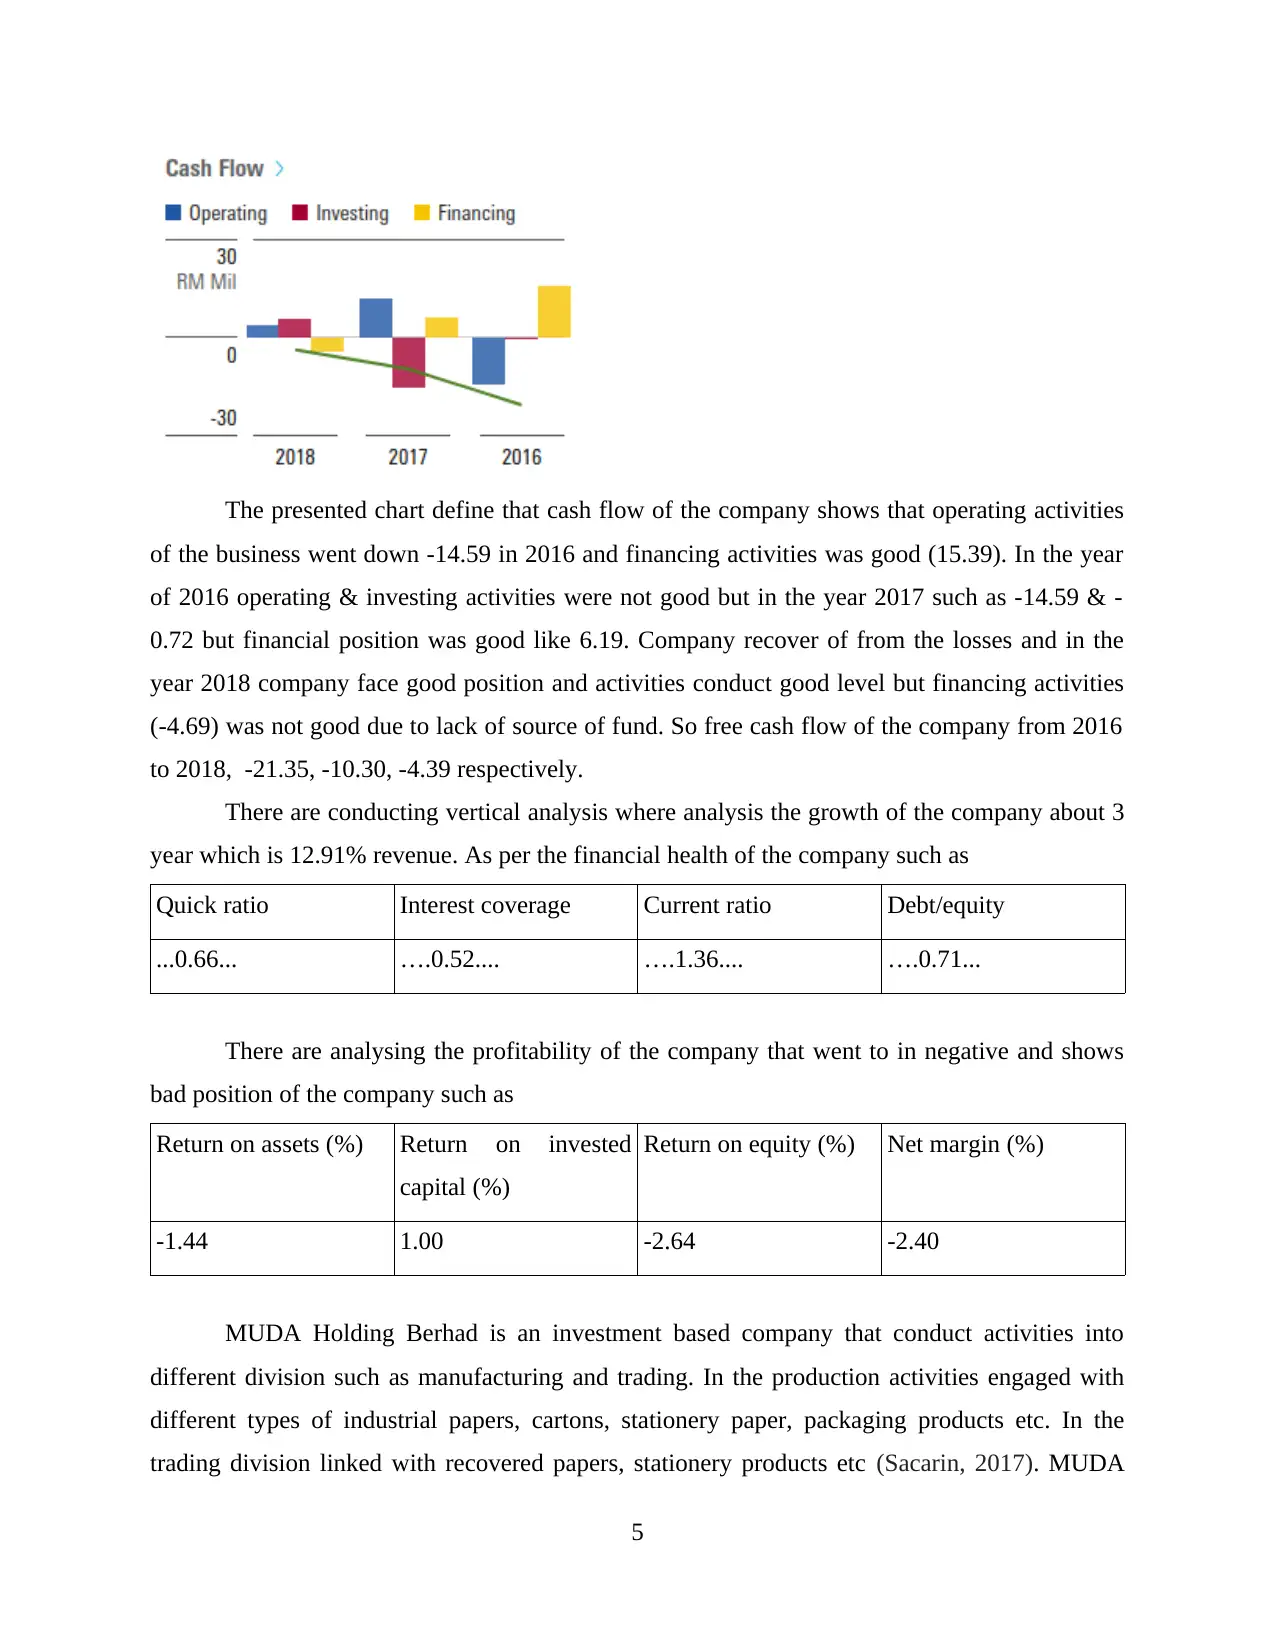
The presented chart define that cash flow of the company shows that operating activities
of the business went down -14.59 in 2016 and financing activities was good (15.39). In the year
of 2016 operating & investing activities were not good but in the year 2017 such as -14.59 & -
0.72 but financial position was good like 6.19. Company recover of from the losses and in the
year 2018 company face good position and activities conduct good level but financing activities
(-4.69) was not good due to lack of source of fund. So free cash flow of the company from 2016
to 2018, -21.35, -10.30, -4.39 respectively.
There are conducting vertical analysis where analysis the growth of the company about 3
year which is 12.91% revenue. As per the financial health of the company such as
Quick ratio Interest coverage Current ratio Debt/equity
...0.66... ….0.52.... ….1.36.... ….0.71...
There are analysing the profitability of the company that went to in negative and shows
bad position of the company such as
Return on assets (%) Return on invested
capital (%)
Return on equity (%) Net margin (%)
-1.44 1.00 -2.64 -2.40
MUDA Holding Berhad is an investment based company that conduct activities into
different division such as manufacturing and trading. In the production activities engaged with
different types of industrial papers, cartons, stationery paper, packaging products etc. In the
trading division linked with recovered papers, stationery products etc (Sacarin, 2017). MUDA
5
Paraphrase This Document
Need a fresh take? Get an instant paraphrase of this document with our AI Paraphraser
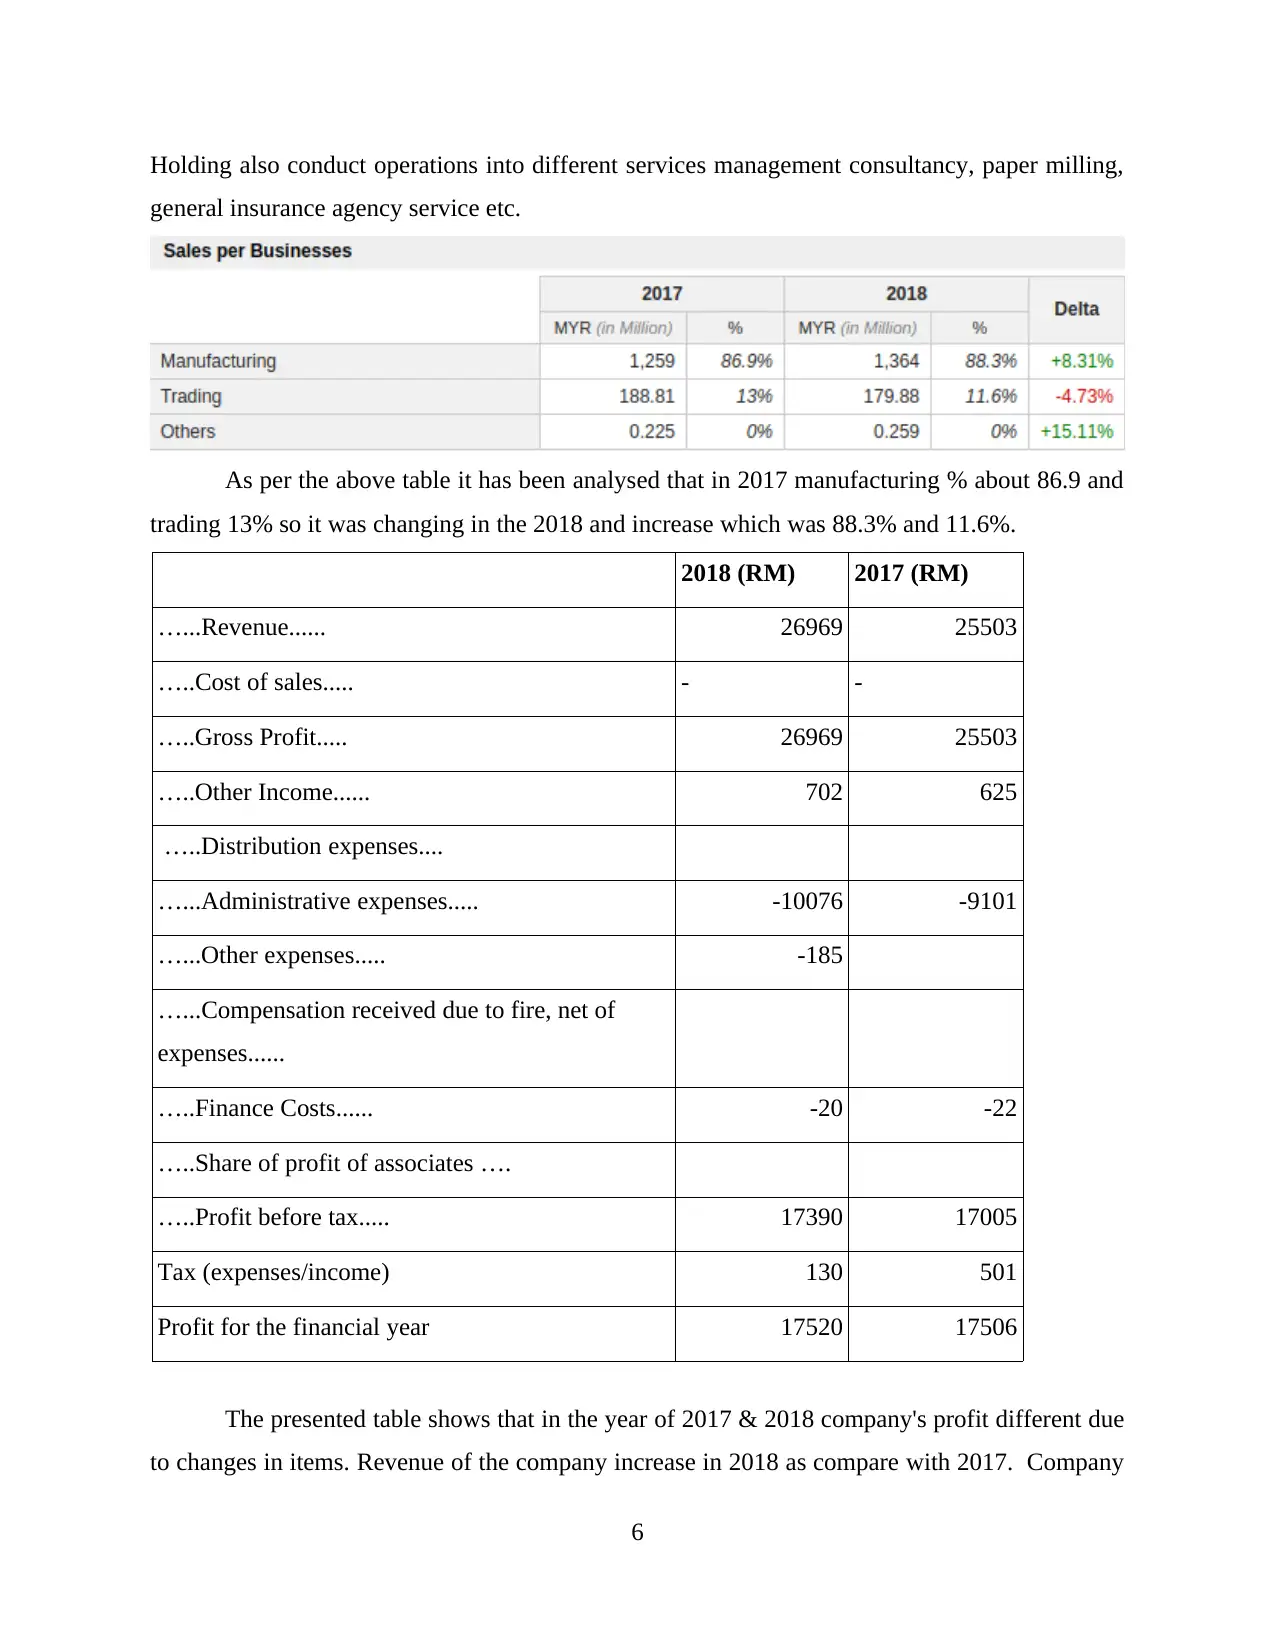
Holding also conduct operations into different services management consultancy, paper milling,
general insurance agency service etc.
As per the above table it has been analysed that in 2017 manufacturing % about 86.9 and
trading 13% so it was changing in the 2018 and increase which was 88.3% and 11.6%.
2018 (RM) 2017 (RM)
…...Revenue...... 26969 25503
…..Cost of sales..... - -
…..Gross Profit..... 26969 25503
…..Other Income...... 702 625
…..Distribution expenses....
…...Administrative expenses..... -10076 -9101
…...Other expenses..... -185
…...Compensation received due to fire, net of
expenses......
…..Finance Costs...... -20 -22
…..Share of profit of associates ….
…..Profit before tax..... 17390 17005
Tax (expenses/income) 130 501
Profit for the financial year 17520 17506
The presented table shows that in the year of 2017 & 2018 company's profit different due
to changes in items. Revenue of the company increase in 2018 as compare with 2017. Company
6
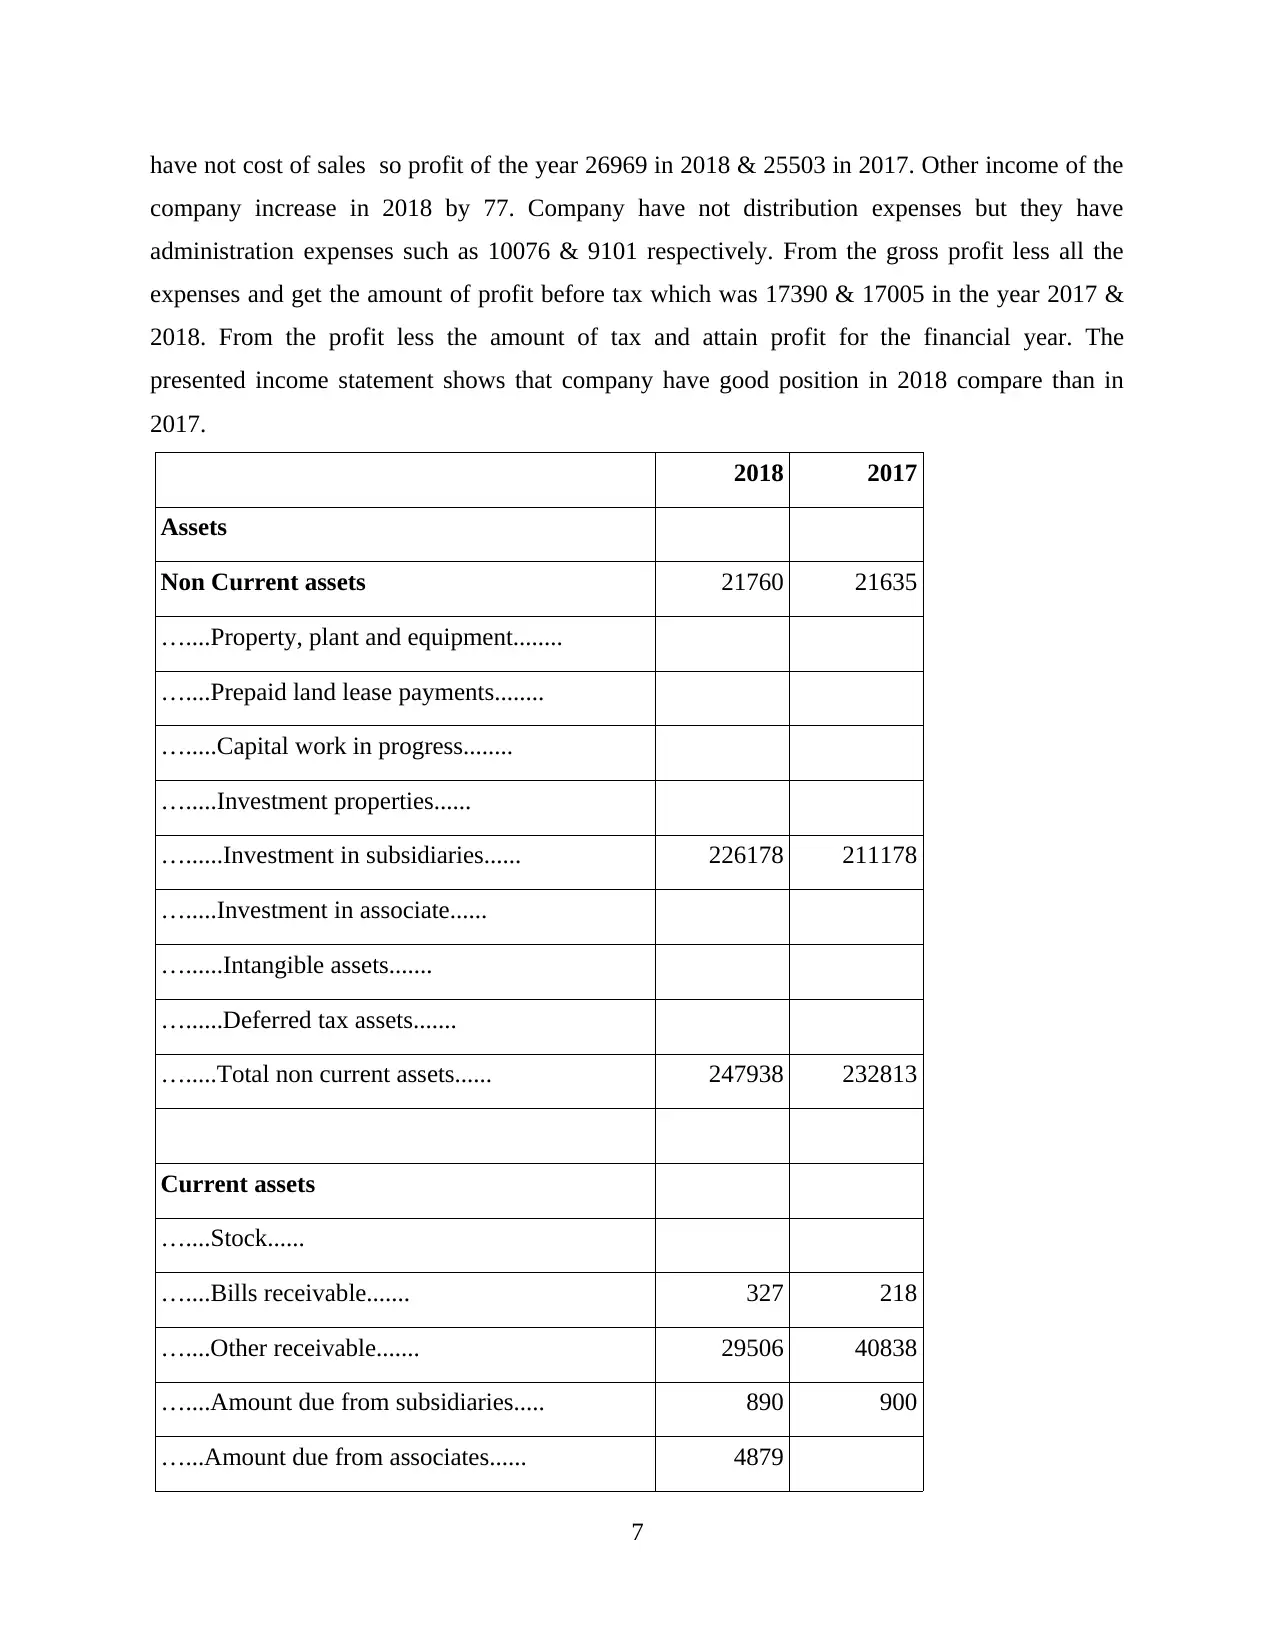
have not cost of sales so profit of the year 26969 in 2018 & 25503 in 2017. Other income of the
company increase in 2018 by 77. Company have not distribution expenses but they have
administration expenses such as 10076 & 9101 respectively. From the gross profit less all the
expenses and get the amount of profit before tax which was 17390 & 17005 in the year 2017 &
2018. From the profit less the amount of tax and attain profit for the financial year. The
presented income statement shows that company have good position in 2018 compare than in
2017.
2018 2017
Assets
Non Current assets 21760 21635
…....Property, plant and equipment........
…....Prepaid land lease payments........
….....Capital work in progress........
….....Investment properties......
…......Investment in subsidiaries...... 226178 211178
….....Investment in associate......
…......Intangible assets.......
…......Deferred tax assets.......
….....Total non current assets...... 247938 232813
Current assets
…....Stock......
…....Bills receivable....... 327 218
…....Other receivable....... 29506 40838
…....Amount due from subsidiaries..... 890 900
…...Amount due from associates...... 4879
7
⊘ This is a preview!⊘
Do you want full access?
Subscribe today to unlock all pages.
Trusted by 1+ million students worldwide
…...Financial assets at fair value through profit
or loss........ 4835
…...Held for trading investments......
…...Tax recoverable....... 1221 1193
…...Cash & cash equivalents....... 9309 5894
…..Total current assets...... 46132 53878
…...Assets consist in disposal group as held for
sale...... - -
TOTAL ASSETS 294070 286691
Equity and Liabilities
Equity
…....Share Capital...... 159471 159471
…...Reserves....... 16828 17052
…...Retained earnings..... 107932 100884
…...Total equity attributable to owners of the
company...... 284231 277407
…..Non controlling interest......
…...Total equity....... 284231 277407
…...Non current liabilities......
…..Finance lease liabilities...... 841 273
…..Borrowings......
8
Paraphrase This Document
Need a fresh take? Get an instant paraphrase of this document with our AI Paraphraser
…...Provision for retirement benefit...... 5936 5997
…...Deferred tax liabilities...... 782 966
…..Total non current liabilities..... 7559 7236
…....Current liabilities.....
…..Trade Payable.......
…...Other payable....... 2040 1908
…...Amount due to subsidiaries..... 12 3
…..Amount due to associate......
…...Derivative financial instruments.....
…...Financial lease liabilities...... 228 137
…...Borrowings......
…..Bank Overdrafts.....
…..Tax payable.....
…..Total Current liabilities...... 2280 2048
…...Total liabilities..... 9839 9284
…..Total equity and liabilities...... 294070 286691
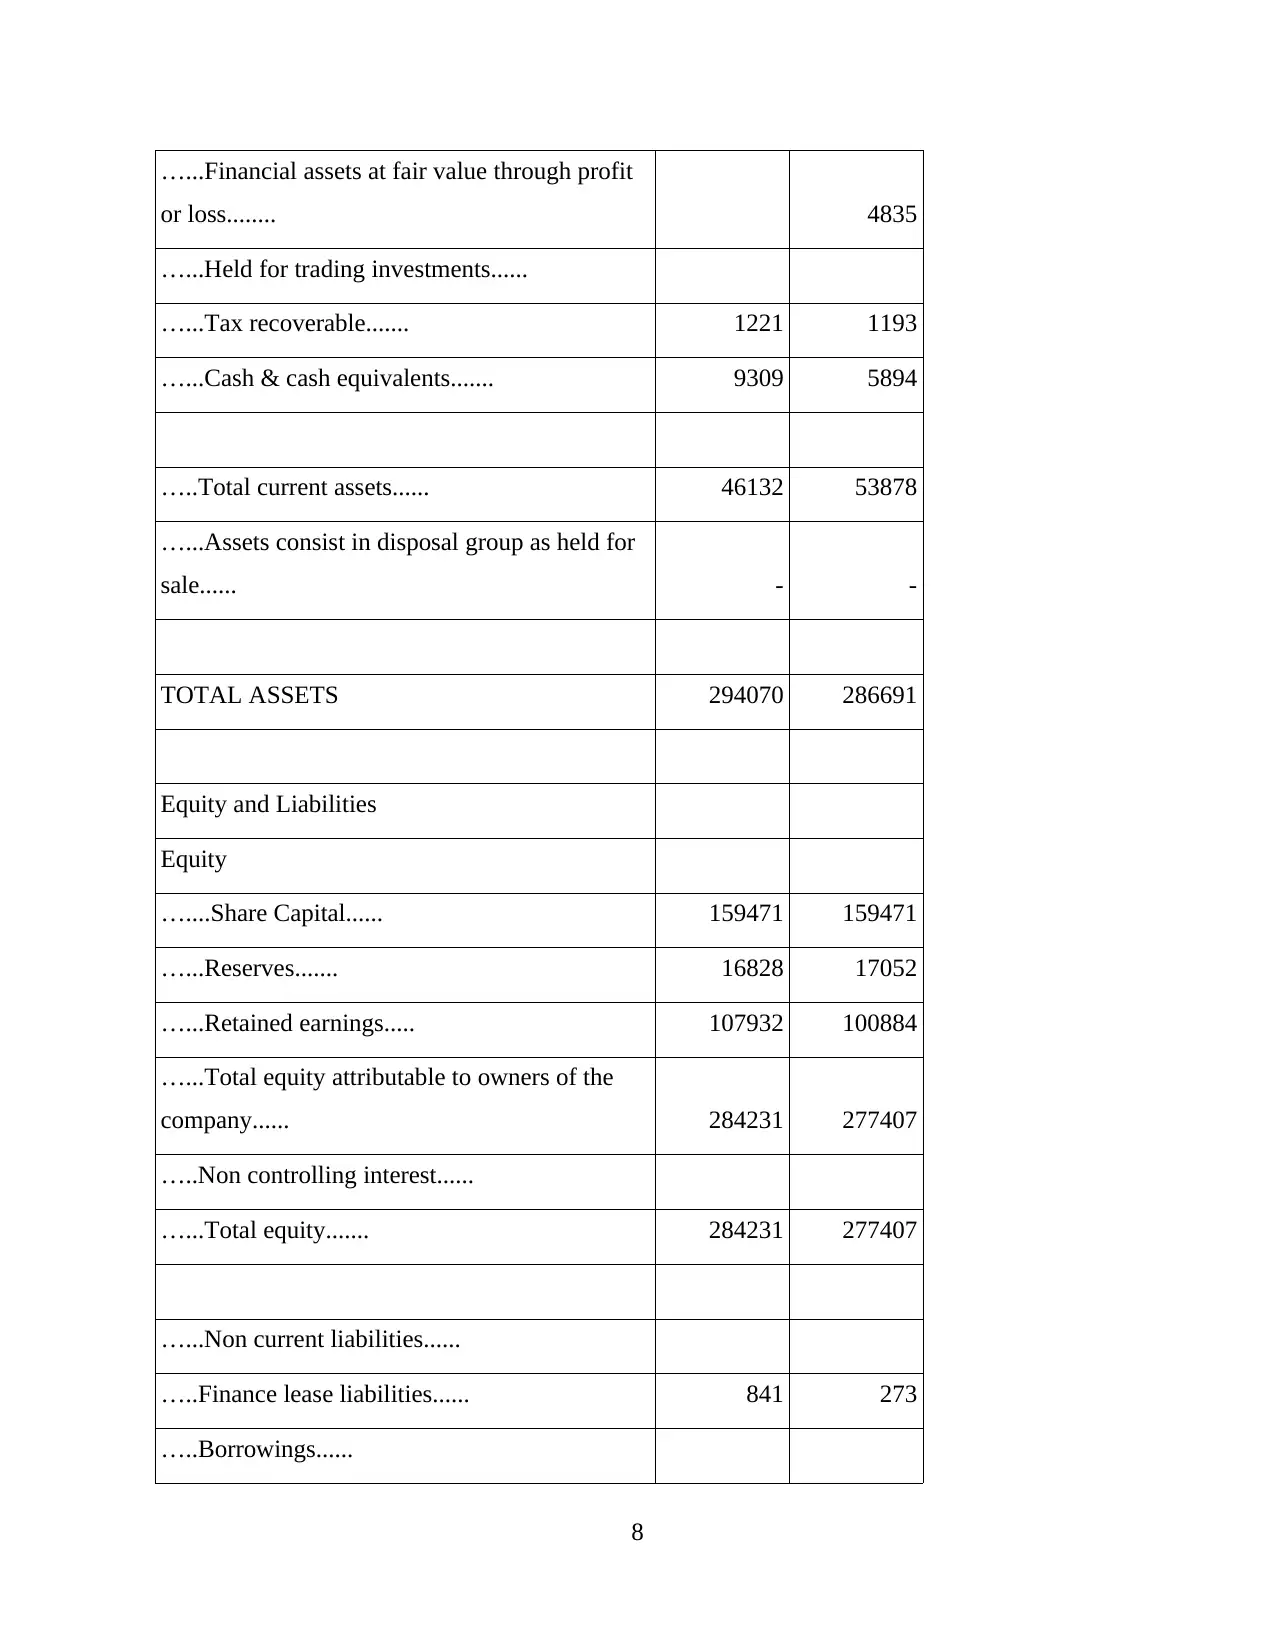
As per the above table it has been analysed that property, plant and equipment of the
company increase in the 2018 due to purchase more. Company invest into subsidiaries in 2018
more than 2017 to achieve more profit. So total non current assets of the organisation such as
247939 in 2018 & 23813 in 2017. The current assets business include bills receivable, other
receivable, amount due from subsidiaries, financial assets at fair value, tax recoverable, cash &
cash equivalents. The other receivable decrease in the 2018 as compare of 2017 that impact on
9
…...Deferred tax liabilities...... 782 966
…..Total non current liabilities..... 7559 7236
…....Current liabilities.....
…..Trade Payable.......
…...Other payable....... 2040 1908
…...Amount due to subsidiaries..... 12 3
…..Amount due to associate......
…...Derivative financial instruments.....
…...Financial lease liabilities...... 228 137
…...Borrowings......
…..Bank Overdrafts.....
…..Tax payable.....
…..Total Current liabilities...... 2280 2048
…...Total liabilities..... 9839 9284
…..Total equity and liabilities...... 294070 286691
As per the above table it has been analysed that property, plant and equipment of the
company increase in the 2018 due to purchase more. Company invest into subsidiaries in 2018
more than 2017 to achieve more profit. So total non current assets of the organisation such as
247939 in 2018 & 23813 in 2017. The current assets business include bills receivable, other
receivable, amount due from subsidiaries, financial assets at fair value, tax recoverable, cash &
cash equivalents. The other receivable decrease in the 2018 as compare of 2017 that impact on
9
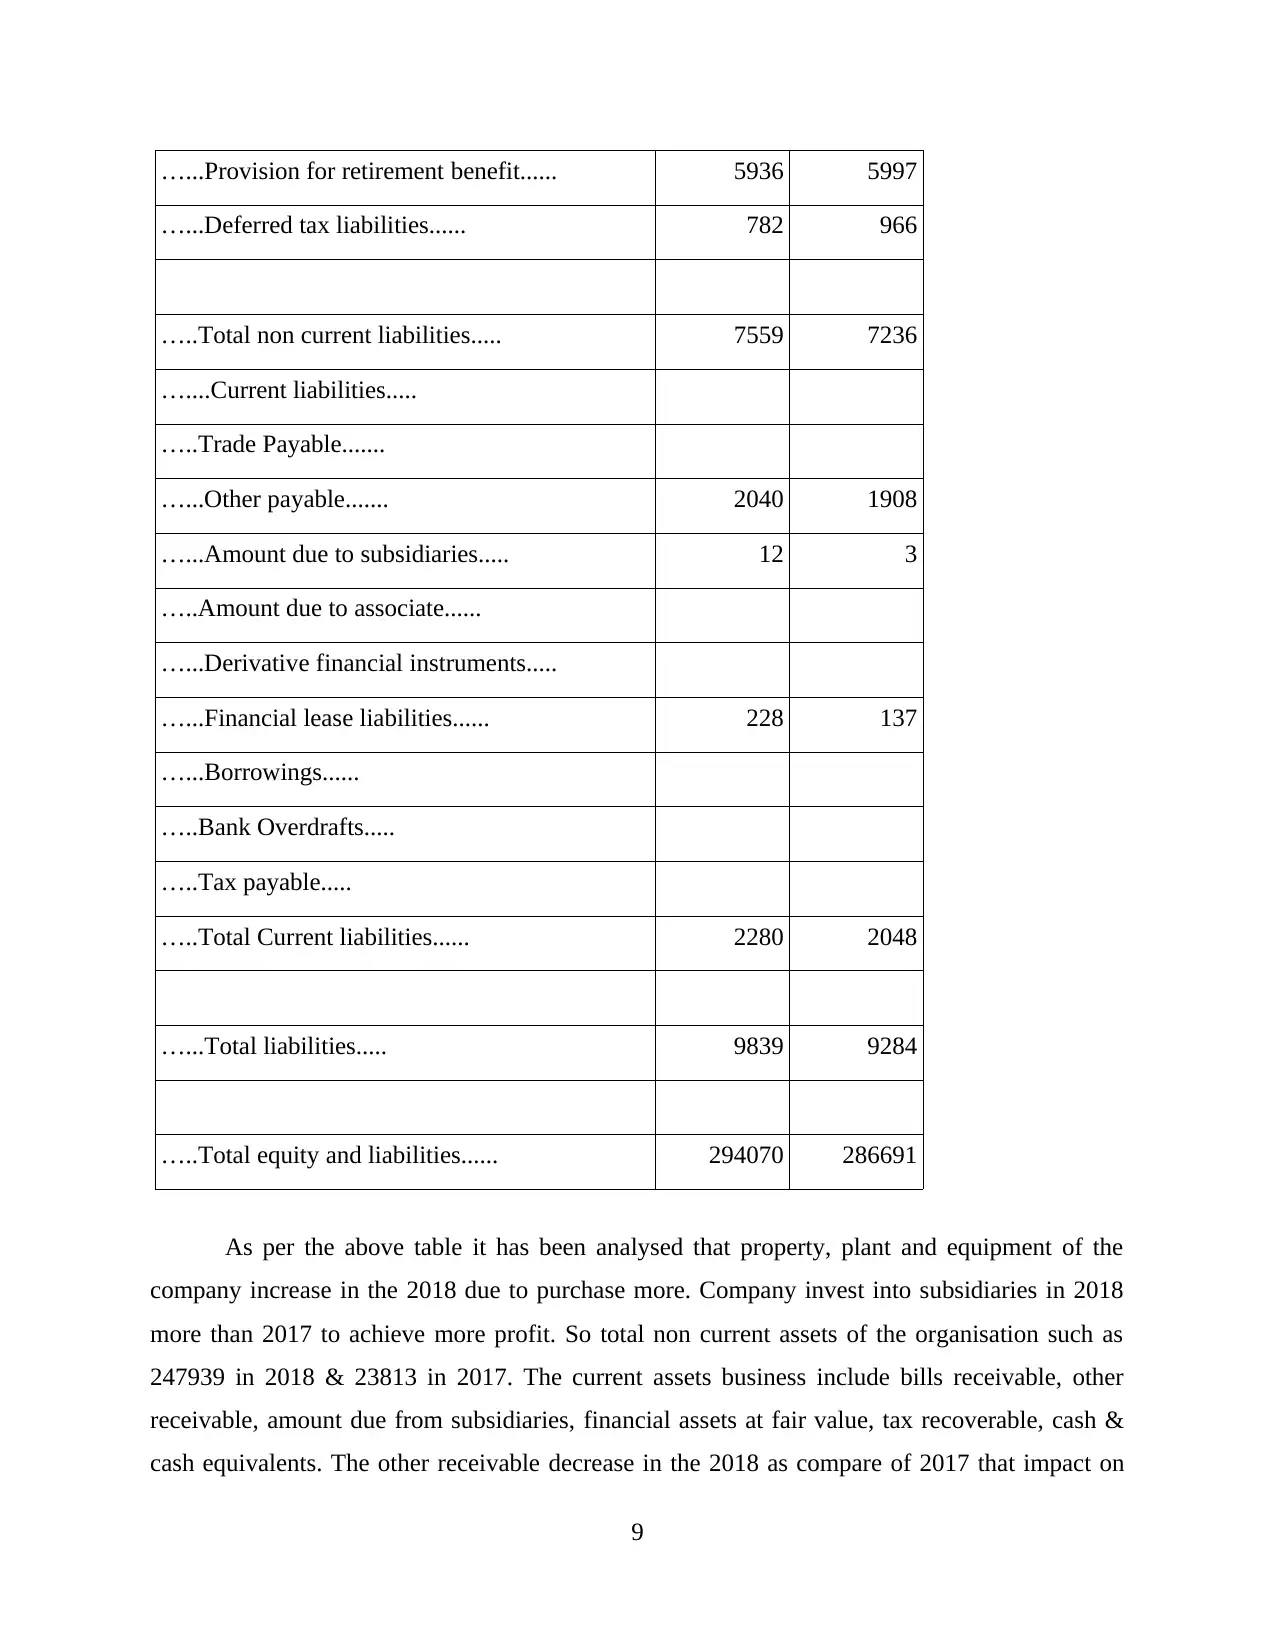
the performance of the organisation. This item become reason of lesser than the total current
assets 7746 less in 2018 after comparison of 2017. So total current assets of the company 294070
& 286691 in 2018 & 2017 respectively. In the section of equity and liabilities share capital
remain same it means does company did not issue any type of shares. Reserves of the business
decrease due to invest any other things. Retained earning increase by 7048 which is profitable of
the organisation. So company have total equity such as 284231 & 277407 respectively. In the
non current liabilities includes other payables which increase as well as amount due to
subsidiaries also increase. Financial lease liabilities of the company increase by the 91 that
impact on the efficiency of the MUDA Holdings. So company have total equity and liabilities in
the year 2018 & 2017, 294070 & 286691 respectively.
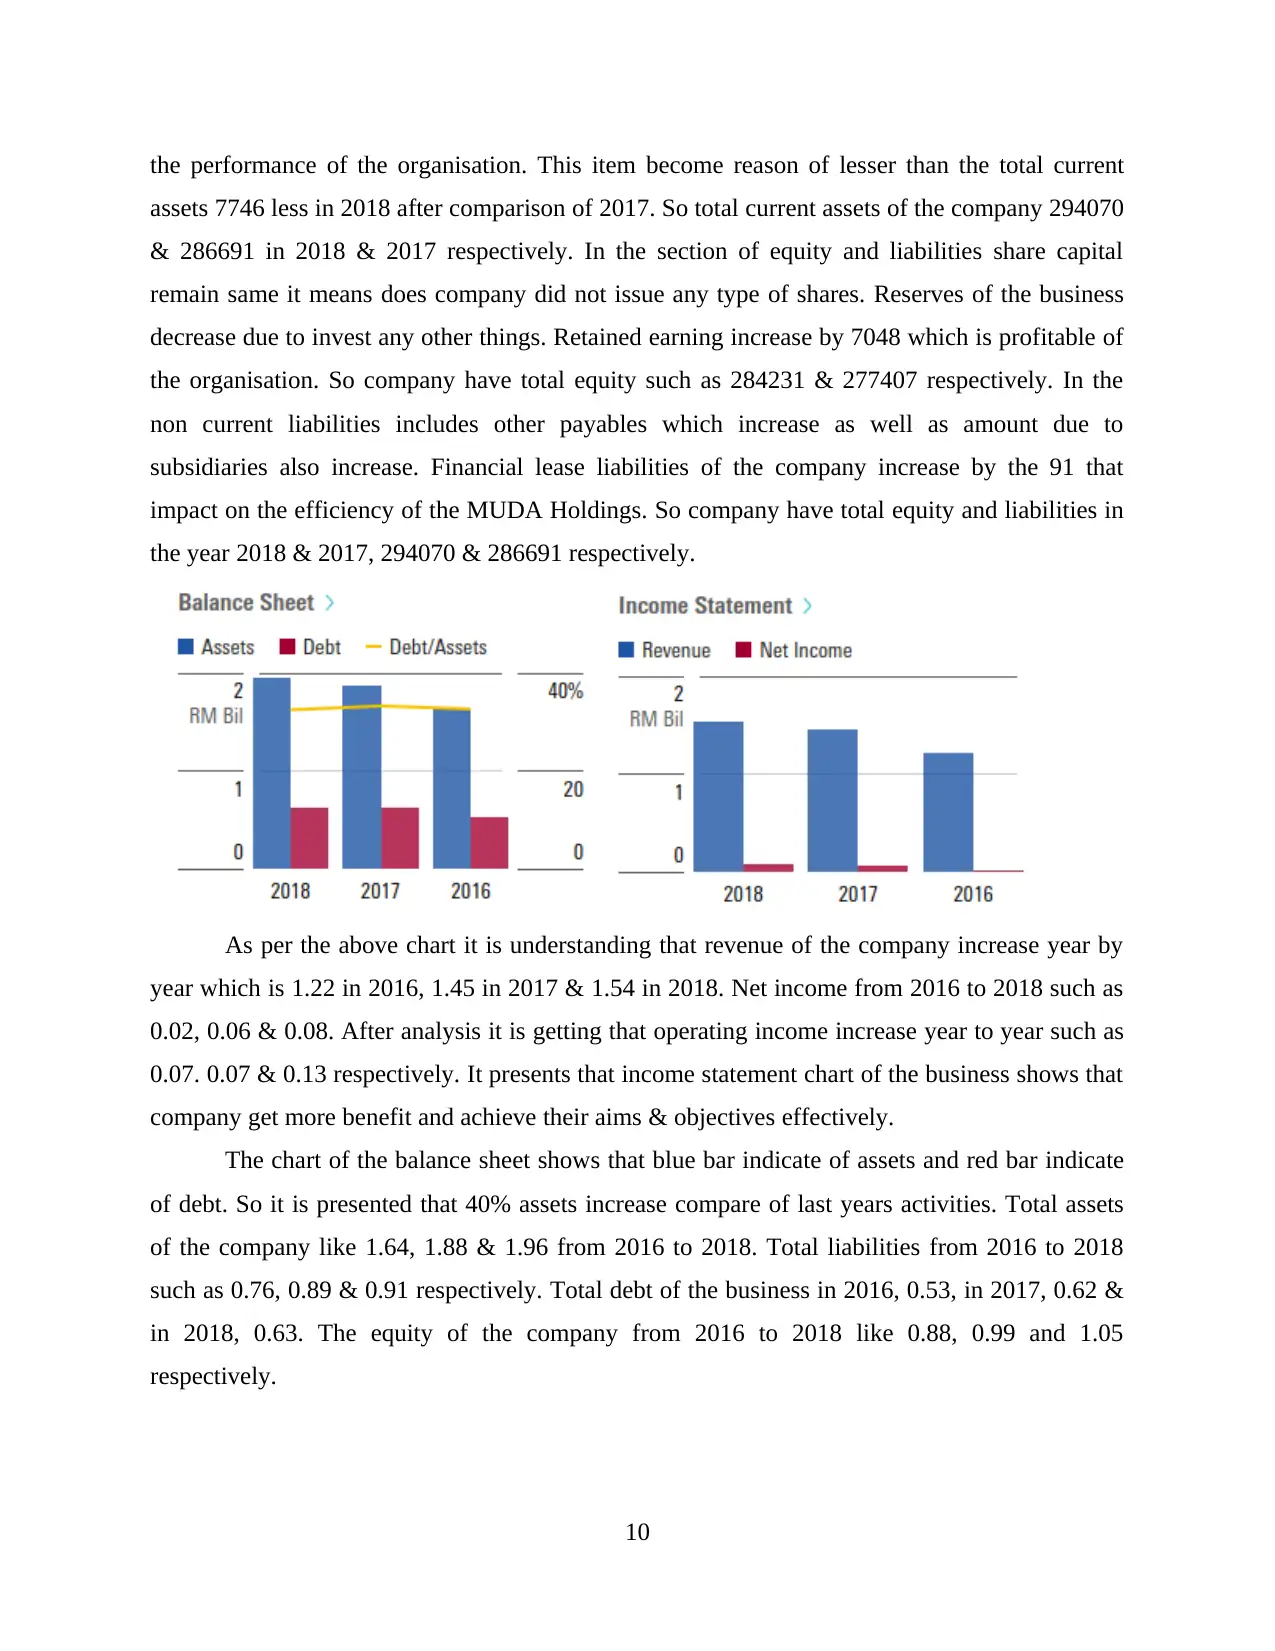
As per the above chart it is understanding that revenue of the company increase year by
year which is 1.22 in 2016, 1.45 in 2017 & 1.54 in 2018. Net income from 2016 to 2018 such as
0.02, 0.06 & 0.08. After analysis it is getting that operating income increase year to year such as
0.07. 0.07 & 0.13 respectively. It presents that income statement chart of the business shows that
company get more benefit and achieve their aims & objectives effectively.
The chart of the balance sheet shows that blue bar indicate of assets and red bar indicate
of debt. So it is presented that 40% assets increase compare of last years activities. Total assets
of the company like 1.64, 1.88 & 1.96 from 2016 to 2018. Total liabilities from 2016 to 2018
such as 0.76, 0.89 & 0.91 respectively. Total debt of the business in 2016, 0.53, in 2017, 0.62 &
in 2018, 0.63. The equity of the company from 2016 to 2018 like 0.88, 0.99 and 1.05
respectively.
10
assets 7746 less in 2018 after comparison of 2017. So total current assets of the company 294070
& 286691 in 2018 & 2017 respectively. In the section of equity and liabilities share capital
remain same it means does company did not issue any type of shares. Reserves of the business
decrease due to invest any other things. Retained earning increase by 7048 which is profitable of
the organisation. So company have total equity such as 284231 & 277407 respectively. In the
non current liabilities includes other payables which increase as well as amount due to
subsidiaries also increase. Financial lease liabilities of the company increase by the 91 that
impact on the efficiency of the MUDA Holdings. So company have total equity and liabilities in
the year 2018 & 2017, 294070 & 286691 respectively.
As per the above chart it is understanding that revenue of the company increase year by
year which is 1.22 in 2016, 1.45 in 2017 & 1.54 in 2018. Net income from 2016 to 2018 such as
0.02, 0.06 & 0.08. After analysis it is getting that operating income increase year to year such as
0.07. 0.07 & 0.13 respectively. It presents that income statement chart of the business shows that
company get more benefit and achieve their aims & objectives effectively.
The chart of the balance sheet shows that blue bar indicate of assets and red bar indicate
of debt. So it is presented that 40% assets increase compare of last years activities. Total assets
of the company like 1.64, 1.88 & 1.96 from 2016 to 2018. Total liabilities from 2016 to 2018
such as 0.76, 0.89 & 0.91 respectively. Total debt of the business in 2016, 0.53, in 2017, 0.62 &
in 2018, 0.63. The equity of the company from 2016 to 2018 like 0.88, 0.99 and 1.05
respectively.
10
⊘ This is a preview!⊘
Do you want full access?
Subscribe today to unlock all pages.
Trusted by 1+ million students worldwide
1 out of 15
Related Documents


Your All-in-One AI-Powered Toolkit for Academic Success.
+13062052269
info@desklib.com
Available 24*7 on WhatsApp / Email
![[object Object]](/_next/static/media/star-bottom.7253800d.svg)
Unlock your academic potential
Copyright © 2020–2026 A2Z Services. All Rights Reserved. Developed and managed by ZUCOL.