Financial Analysis Report: ABC Ltd. - Capital Budgeting Techniques
VerifiedAdded on 2021/06/17
|14
|1707
|49
Report
AI Summary
This report provides a financial analysis of ABC Ltd., focusing on capital budgeting techniques for project selection. It explores methods like Annual Worth, Present Worth, Internal Rate of Return, and Benefit/Cost analysis to evaluate investment options. The report delves into Net Present Value (NPV), Minimum Acceptable Rate of Return (MARR), and Equivalent Annual Cost calculations for machinery selection. It also discusses the gaps in Life Cycle Costing, which considers costs throughout a product's lifespan, and offers recommendations to improve benefit/cost analysis and risk management. The student analyzes various aspects of financial decision-making, including the importance of capital structure and risk assessment in investment strategies. The report provides valuable insights into financial analysis and its application in real-world business scenarios.
Running head: FINANCIAL ANALYSIS
FINANCIAL ANALYSIS
Name of the Student:
Name of the University:
Author’s Note:
FINANCIAL ANALYSIS
Name of the Student:
Name of the University:
Author’s Note:
Paraphrase This Document
Need a fresh take? Get an instant paraphrase of this document with our AI Paraphraser
1
FINANCIAL ANALYSIS
Table of Contents
Answer to Question 1......................................................................................................................2
Answer to Question 2......................................................................................................................6
Answer to Question 3......................................................................................................................7
Answer to Question 4......................................................................................................................8
Answer to Question 5......................................................................................................................9
Introduction..................................................................................................................................9
Gaps in Life Cycle Costing..........................................................................................................9
Recommendations......................................................................................................................11
Reference.......................................................................................................................................13
2
FINANCIAL ANALYSIS
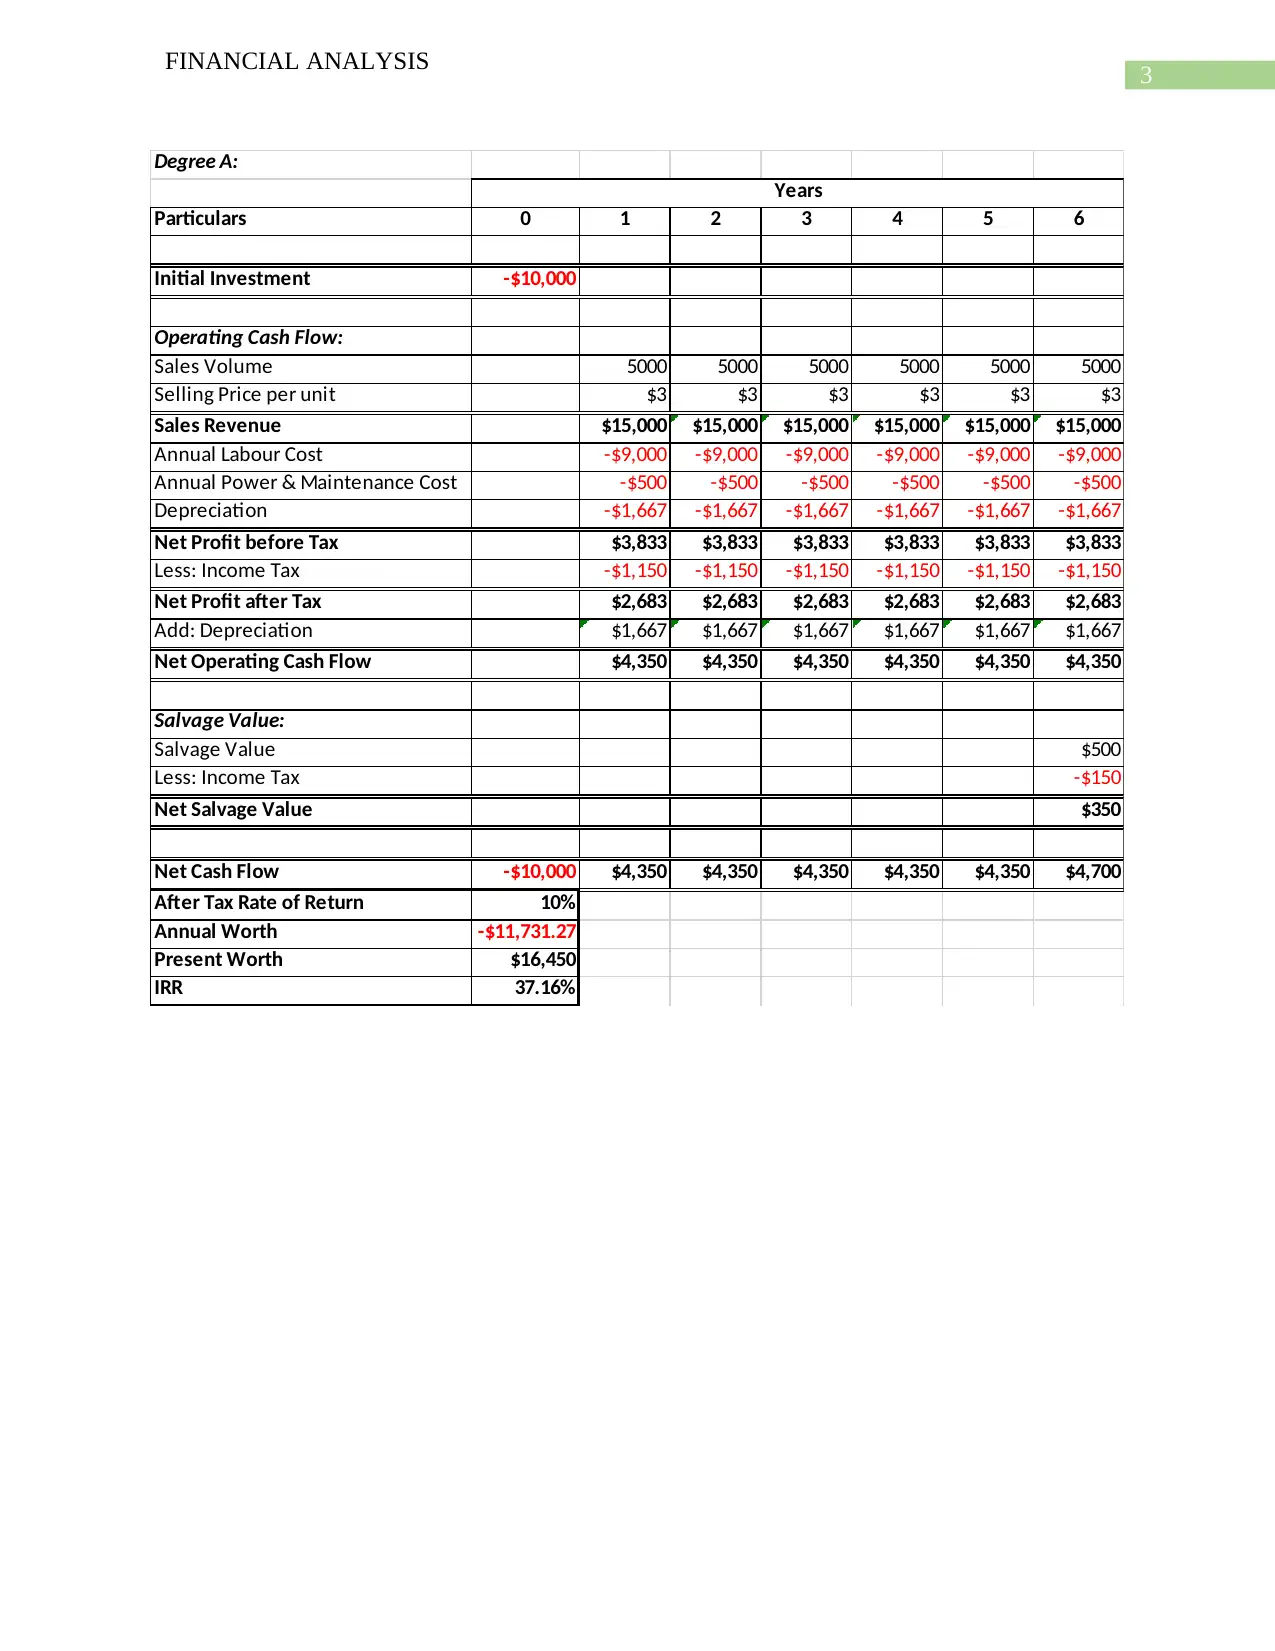
Answer to Question 1
The annual worth of the company represents the annual equivalent value of all cash
inflows and cash outflows of the alternatives options (2). This method is usually used for making
comparison between the viability of two projects. In this method only one life cycle of the
project is to be evaluated. Present worth is used to estimate the future cash inflows from a project
and is normally used in capital budgeting techniques. Internal Rate of Return is the rate at which
the present value of the cash inflows and cash outflows becomes zero (4).
Capital Investment decision are often based on the analysis of Annual Worth, Present
Worth and Internal rate of return. The annual worth of the projects helps the business in making
comparison between alternative projects with the proposed projects. The present worth of the
project is used by businesses to determine the present value of cash inflows which the business
can expect from the project (3). The IRR of the project determines the minimum rate of return
which the company needs to earn. These are important factors which are needed to be considered
while taking investment decisions.
FINANCIAL ANALYSIS
Answer to Question 1
The annual worth of the company represents the annual equivalent value of all cash
inflows and cash outflows of the alternatives options (2). This method is usually used for making
comparison between the viability of two projects. In this method only one life cycle of the
project is to be evaluated. Present worth is used to estimate the future cash inflows from a project
and is normally used in capital budgeting techniques. Internal Rate of Return is the rate at which
the present value of the cash inflows and cash outflows becomes zero (4).
Capital Investment decision are often based on the analysis of Annual Worth, Present
Worth and Internal rate of return. The annual worth of the projects helps the business in making
comparison between alternative projects with the proposed projects. The present worth of the
project is used by businesses to determine the present value of cash inflows which the business
can expect from the project (3). The IRR of the project determines the minimum rate of return
which the company needs to earn. These are important factors which are needed to be considered
while taking investment decisions.
⊘ This is a preview!⊘
Do you want full access?
Subscribe today to unlock all pages.
Trusted by 1+ million students worldwide
3
FINANCIAL ANALYSIS
Degree A:
Particulars 0 1 2 3 4 5 6
Initial Investment -$10,000
Operating Cash Flow:
Sales Volume 5000 5000 5000 5000 5000 5000
Selling Price per unit $3 $3 $3 $3 $3 $3
Sales Revenue $15,000 $15,000 $15,000 $15,000 $15,000 $15,000
Annual Labour Cost -$9,000 -$9,000 -$9,000 -$9,000 -$9,000 -$9,000
Annual Power & Maintenance Cost -$500 -$500 -$500 -$500 -$500 -$500
Depreciation -$1,667 -$1,667 -$1,667 -$1,667 -$1,667 -$1,667
Net Profit before Tax $3,833 $3,833 $3,833 $3,833 $3,833 $3,833
Less: Income Tax -$1,150 -$1,150 -$1,150 -$1,150 -$1,150 -$1,150
Net Profit after Tax $2,683 $2,683 $2,683 $2,683 $2,683 $2,683
Add: Depreciation $1,667 $1,667 $1,667 $1,667 $1,667 $1,667
Net Operating Cash Flow $4,350 $4,350 $4,350 $4,350 $4,350 $4,350
Salvage Value:
Salvage Value $500
Less: Income Tax -$150
Net Salvage Value $350
Net Cash Flow -$10,000 $4,350 $4,350 $4,350 $4,350 $4,350 $4,700
After Tax Rate of Return 10%
Annual Worth -$11,731.27
Present Worth $16,450
IRR 37.16%
Years
Paraphrase This Document
Need a fresh take? Get an instant paraphrase of this document with our AI Paraphraser
4
FINANCIAL ANALYSIS
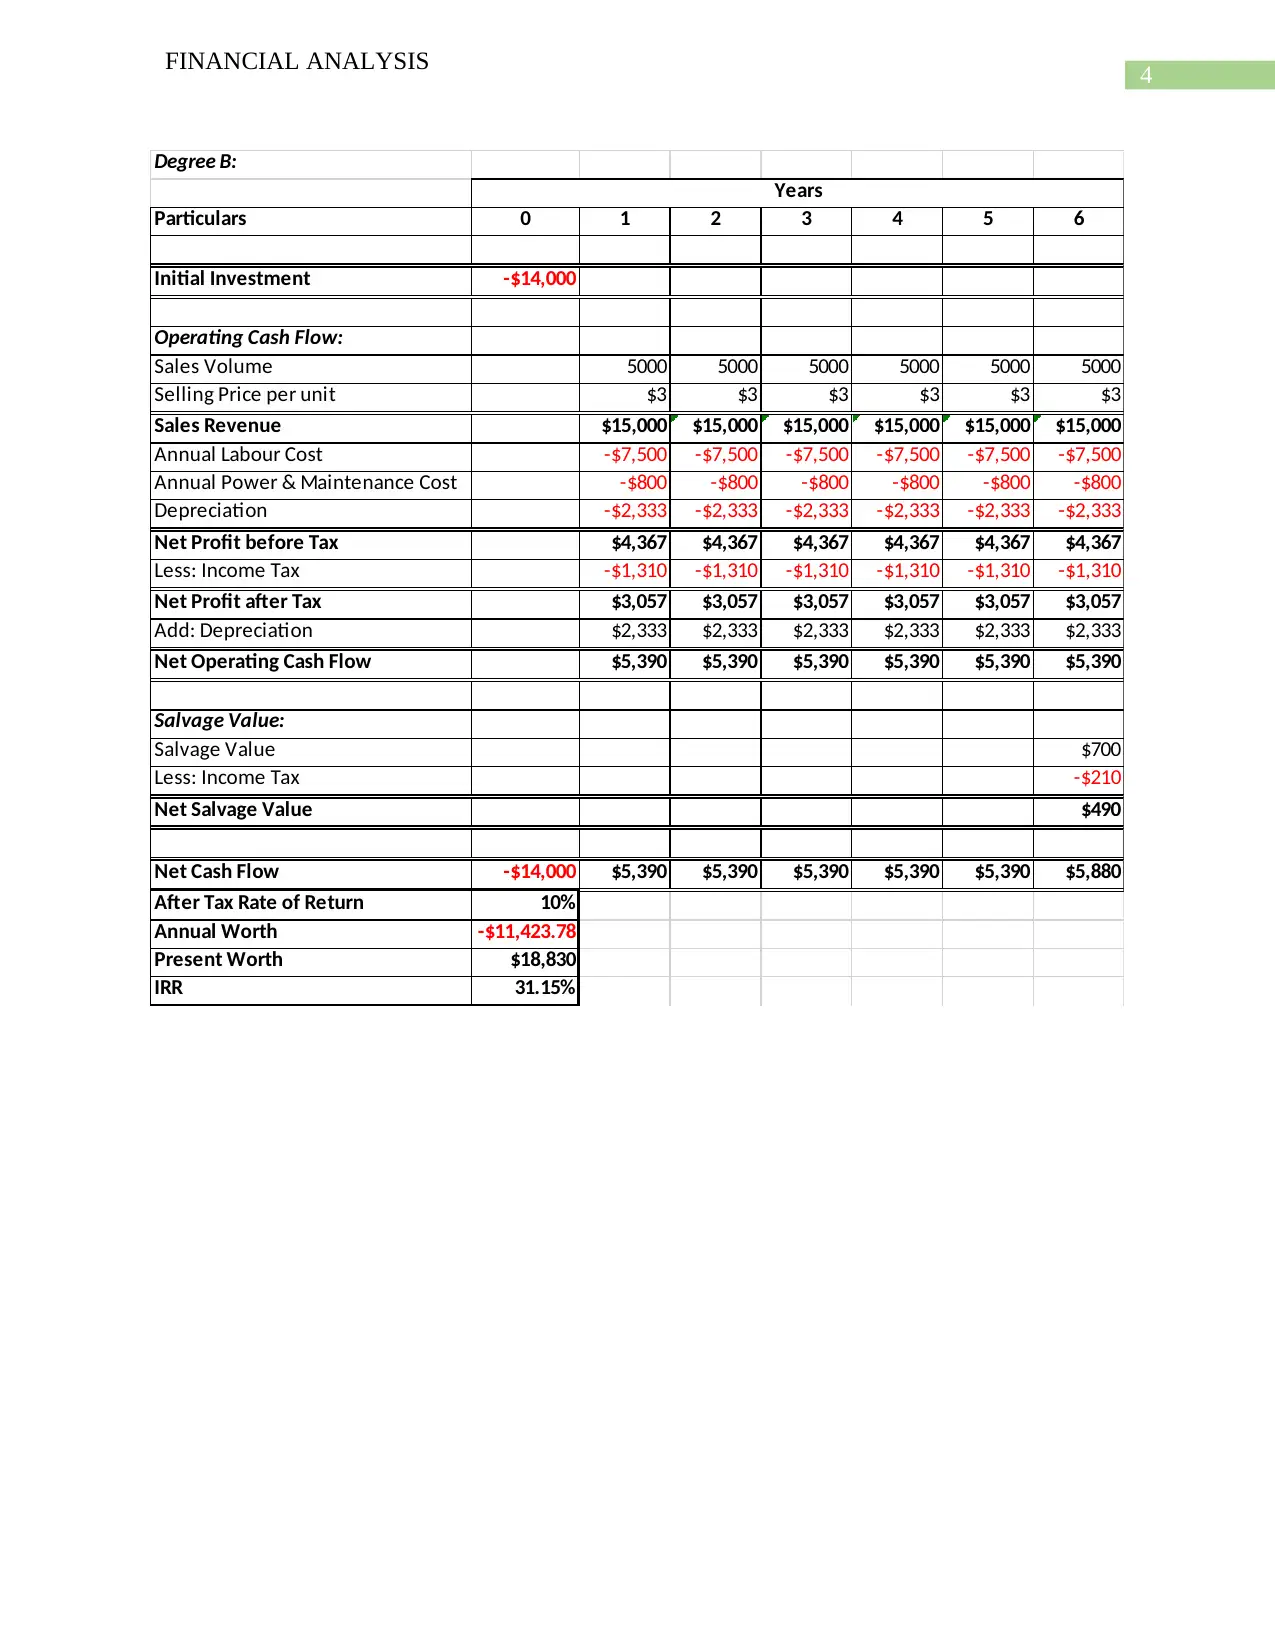
Degree B:
Particulars 0 1 2 3 4 5 6
Initial Investment -$14,000
Operating Cash Flow:
Sales Volume 5000 5000 5000 5000 5000 5000
Selling Price per unit $3 $3 $3 $3 $3 $3
Sales Revenue $15,000 $15,000 $15,000 $15,000 $15,000 $15,000
Annual Labour Cost -$7,500 -$7,500 -$7,500 -$7,500 -$7,500 -$7,500
Annual Power & Maintenance Cost -$800 -$800 -$800 -$800 -$800 -$800
Depreciation -$2,333 -$2,333 -$2,333 -$2,333 -$2,333 -$2,333
Net Profit before Tax $4,367 $4,367 $4,367 $4,367 $4,367 $4,367
Less: Income Tax -$1,310 -$1,310 -$1,310 -$1,310 -$1,310 -$1,310
Net Profit after Tax $3,057 $3,057 $3,057 $3,057 $3,057 $3,057
Add: Depreciation $2,333 $2,333 $2,333 $2,333 $2,333 $2,333
Net Operating Cash Flow $5,390 $5,390 $5,390 $5,390 $5,390 $5,390
Salvage Value:
Salvage Value $700
Less: Income Tax -$210
Net Salvage Value $490
Net Cash Flow -$14,000 $5,390 $5,390 $5,390 $5,390 $5,390 $5,880
After Tax Rate of Return 10%
Annual Worth -$11,423.78
Present Worth $18,830
IRR 31.15%
Years
FINANCIAL ANALYSIS
Degree B:
Particulars 0 1 2 3 4 5 6
Initial Investment -$14,000
Operating Cash Flow:
Sales Volume 5000 5000 5000 5000 5000 5000
Selling Price per unit $3 $3 $3 $3 $3 $3
Sales Revenue $15,000 $15,000 $15,000 $15,000 $15,000 $15,000
Annual Labour Cost -$7,500 -$7,500 -$7,500 -$7,500 -$7,500 -$7,500
Annual Power & Maintenance Cost -$800 -$800 -$800 -$800 -$800 -$800
Depreciation -$2,333 -$2,333 -$2,333 -$2,333 -$2,333 -$2,333
Net Profit before Tax $4,367 $4,367 $4,367 $4,367 $4,367 $4,367
Less: Income Tax -$1,310 -$1,310 -$1,310 -$1,310 -$1,310 -$1,310
Net Profit after Tax $3,057 $3,057 $3,057 $3,057 $3,057 $3,057
Add: Depreciation $2,333 $2,333 $2,333 $2,333 $2,333 $2,333
Net Operating Cash Flow $5,390 $5,390 $5,390 $5,390 $5,390 $5,390
Salvage Value:
Salvage Value $700
Less: Income Tax -$210
Net Salvage Value $490
Net Cash Flow -$14,000 $5,390 $5,390 $5,390 $5,390 $5,390 $5,880
After Tax Rate of Return 10%
Annual Worth -$11,423.78
Present Worth $18,830
IRR 31.15%
Years
5
FINANCIAL ANALYSIS
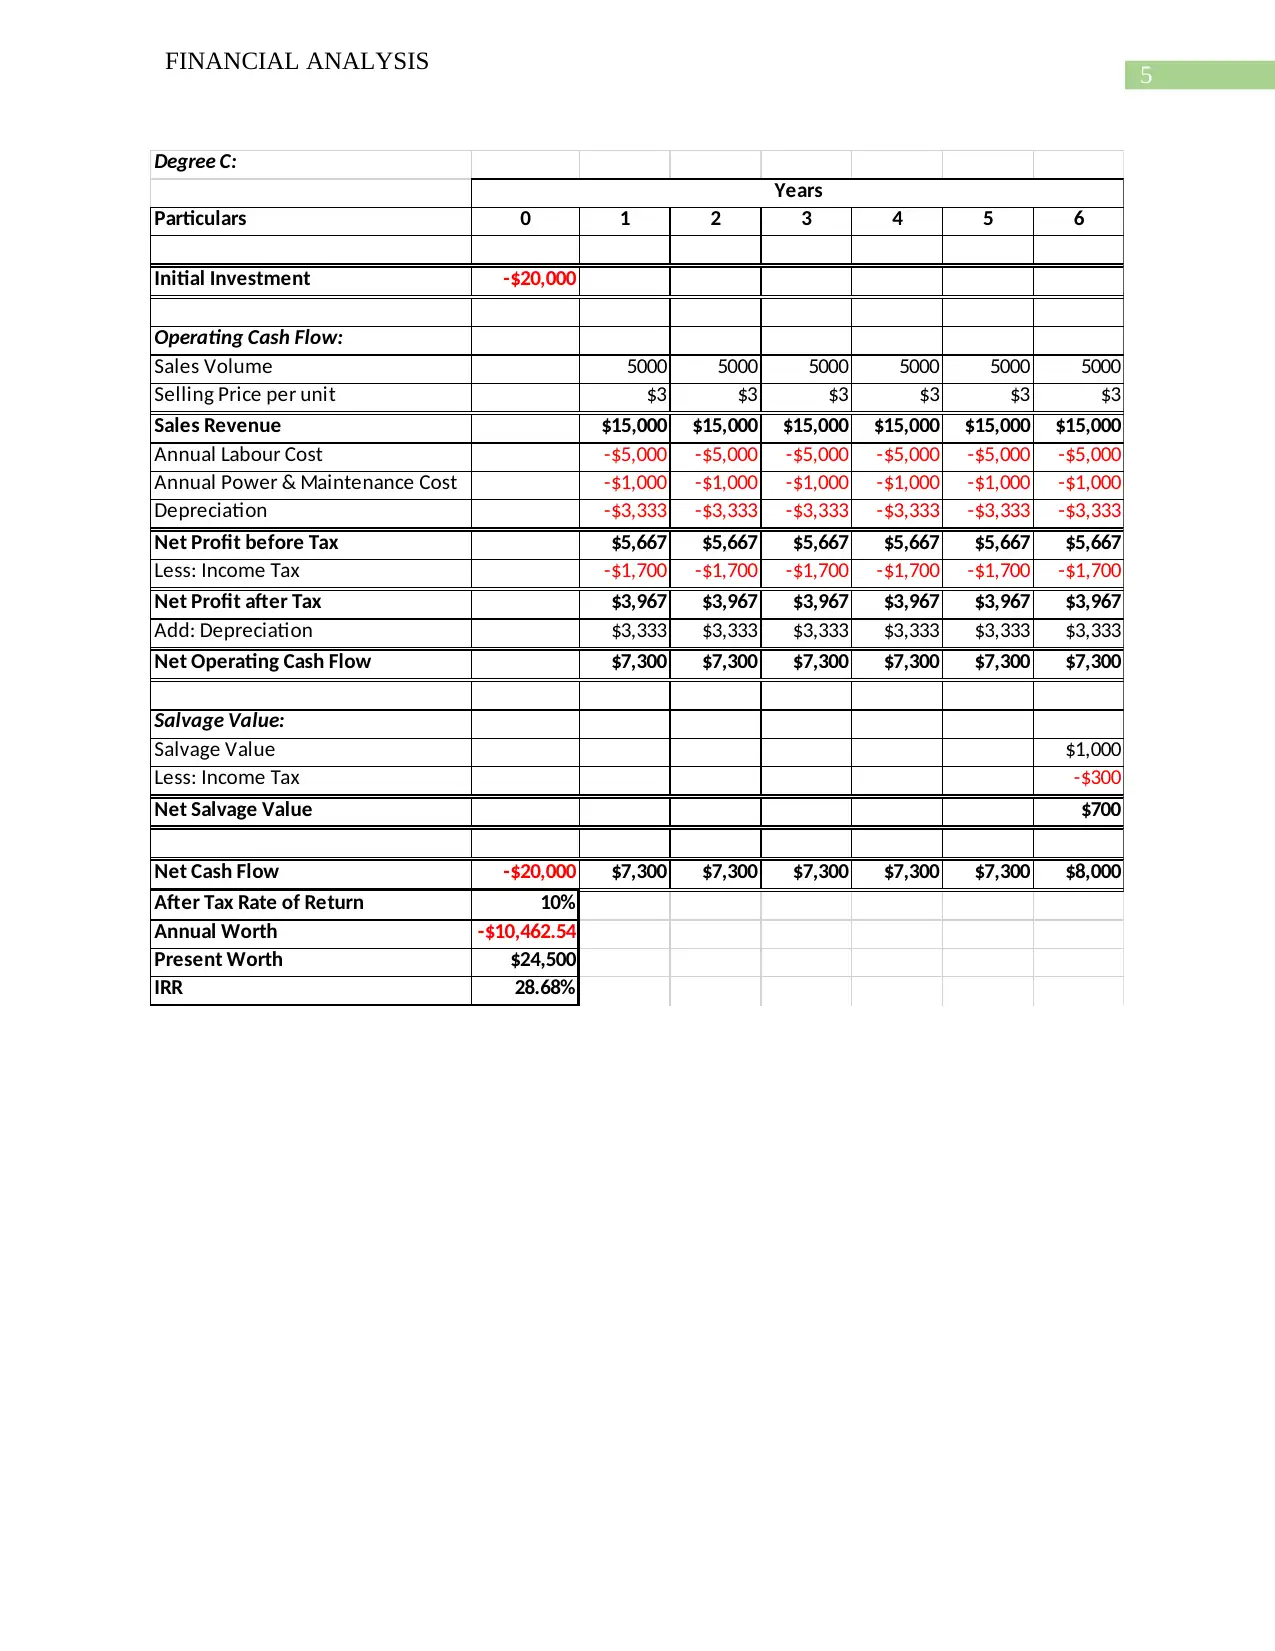
Degree C:
Particulars 0 1 2 3 4 5 6
Initial Investment -$20,000
Operating Cash Flow:
Sales Volume 5000 5000 5000 5000 5000 5000
Selling Price per unit $3 $3 $3 $3 $3 $3
Sales Revenue $15,000 $15,000 $15,000 $15,000 $15,000 $15,000
Annual Labour Cost -$5,000 -$5,000 -$5,000 -$5,000 -$5,000 -$5,000
Annual Power & Maintenance Cost -$1,000 -$1,000 -$1,000 -$1,000 -$1,000 -$1,000
Depreciation -$3,333 -$3,333 -$3,333 -$3,333 -$3,333 -$3,333
Net Profit before Tax $5,667 $5,667 $5,667 $5,667 $5,667 $5,667
Less: Income Tax -$1,700 -$1,700 -$1,700 -$1,700 -$1,700 -$1,700
Net Profit after Tax $3,967 $3,967 $3,967 $3,967 $3,967 $3,967
Add: Depreciation $3,333 $3,333 $3,333 $3,333 $3,333 $3,333
Net Operating Cash Flow $7,300 $7,300 $7,300 $7,300 $7,300 $7,300
Salvage Value:
Salvage Value $1,000
Less: Income Tax -$300
Net Salvage Value $700
Net Cash Flow -$20,000 $7,300 $7,300 $7,300 $7,300 $7,300 $8,000
After Tax Rate of Return 10%
Annual Worth -$10,462.54
Present Worth $24,500
IRR 28.68%
Years
FINANCIAL ANALYSIS
Degree C:
Particulars 0 1 2 3 4 5 6
Initial Investment -$20,000
Operating Cash Flow:
Sales Volume 5000 5000 5000 5000 5000 5000
Selling Price per unit $3 $3 $3 $3 $3 $3
Sales Revenue $15,000 $15,000 $15,000 $15,000 $15,000 $15,000
Annual Labour Cost -$5,000 -$5,000 -$5,000 -$5,000 -$5,000 -$5,000
Annual Power & Maintenance Cost -$1,000 -$1,000 -$1,000 -$1,000 -$1,000 -$1,000
Depreciation -$3,333 -$3,333 -$3,333 -$3,333 -$3,333 -$3,333
Net Profit before Tax $5,667 $5,667 $5,667 $5,667 $5,667 $5,667
Less: Income Tax -$1,700 -$1,700 -$1,700 -$1,700 -$1,700 -$1,700
Net Profit after Tax $3,967 $3,967 $3,967 $3,967 $3,967 $3,967
Add: Depreciation $3,333 $3,333 $3,333 $3,333 $3,333 $3,333
Net Operating Cash Flow $7,300 $7,300 $7,300 $7,300 $7,300 $7,300
Salvage Value:
Salvage Value $1,000
Less: Income Tax -$300
Net Salvage Value $700
Net Cash Flow -$20,000 $7,300 $7,300 $7,300 $7,300 $7,300 $8,000
After Tax Rate of Return 10%
Annual Worth -$10,462.54
Present Worth $24,500
IRR 28.68%
Years
⊘ This is a preview!⊘
Do you want full access?
Subscribe today to unlock all pages.
Trusted by 1+ million students worldwide
6
FINANCIAL ANALYSIS
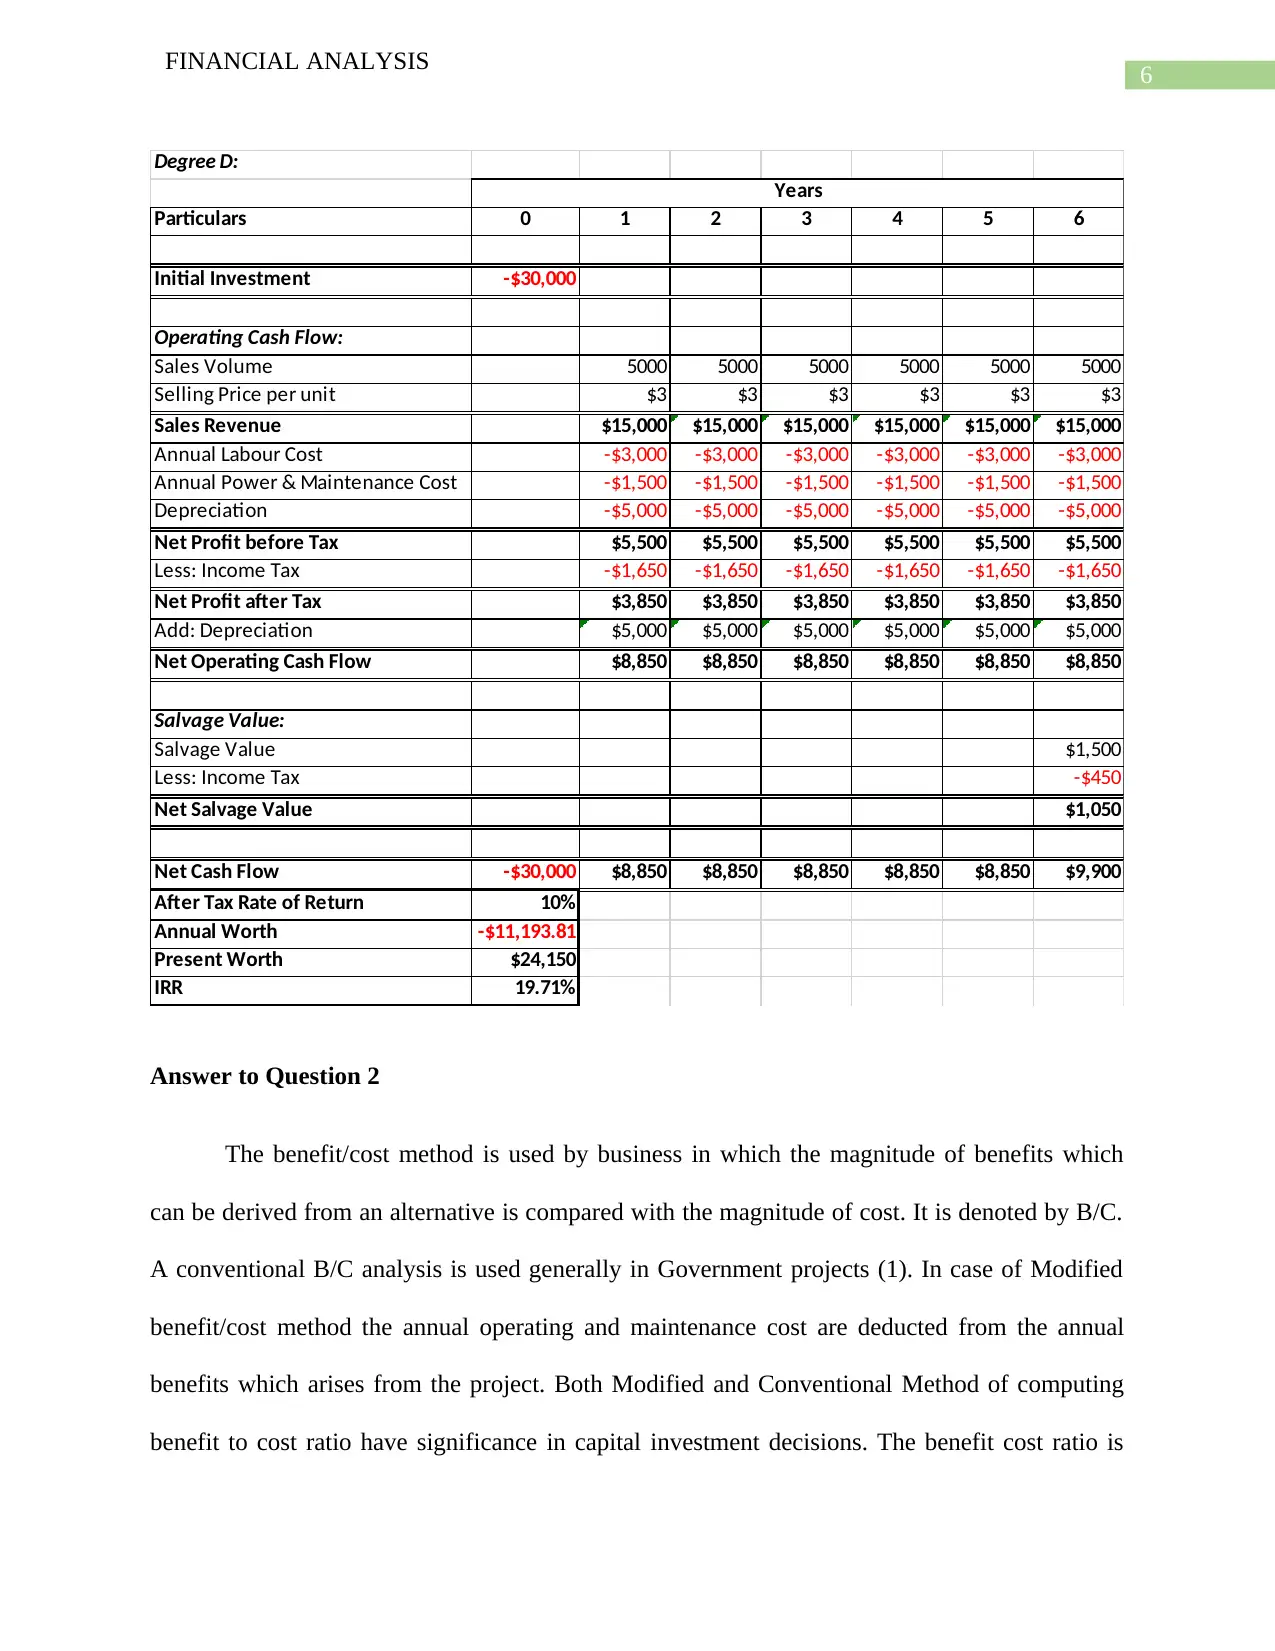
Degree D:
Particulars 0 1 2 3 4 5 6
Initial Investment -$30,000
Operating Cash Flow:
Sales Volume 5000 5000 5000 5000 5000 5000
Selling Price per unit $3 $3 $3 $3 $3 $3
Sales Revenue $15,000 $15,000 $15,000 $15,000 $15,000 $15,000
Annual Labour Cost -$3,000 -$3,000 -$3,000 -$3,000 -$3,000 -$3,000
Annual Power & Maintenance Cost -$1,500 -$1,500 -$1,500 -$1,500 -$1,500 -$1,500
Depreciation -$5,000 -$5,000 -$5,000 -$5,000 -$5,000 -$5,000
Net Profit before Tax $5,500 $5,500 $5,500 $5,500 $5,500 $5,500
Less: Income Tax -$1,650 -$1,650 -$1,650 -$1,650 -$1,650 -$1,650
Net Profit after Tax $3,850 $3,850 $3,850 $3,850 $3,850 $3,850
Add: Depreciation $5,000 $5,000 $5,000 $5,000 $5,000 $5,000
Net Operating Cash Flow $8,850 $8,850 $8,850 $8,850 $8,850 $8,850
Salvage Value:
Salvage Value $1,500
Less: Income Tax -$450
Net Salvage Value $1,050
Net Cash Flow -$30,000 $8,850 $8,850 $8,850 $8,850 $8,850 $9,900
After Tax Rate of Return 10%
Annual Worth -$11,193.81
Present Worth $24,150
IRR 19.71%
Years
Answer to Question 2
The benefit/cost method is used by business in which the magnitude of benefits which
can be derived from an alternative is compared with the magnitude of cost. It is denoted by B/C.
A conventional B/C analysis is used generally in Government projects (1). In case of Modified
benefit/cost method the annual operating and maintenance cost are deducted from the annual
benefits which arises from the project. Both Modified and Conventional Method of computing
benefit to cost ratio have significance in capital investment decisions. The benefit cost ratio is
FINANCIAL ANALYSIS
Degree D:
Particulars 0 1 2 3 4 5 6
Initial Investment -$30,000
Operating Cash Flow:
Sales Volume 5000 5000 5000 5000 5000 5000
Selling Price per unit $3 $3 $3 $3 $3 $3
Sales Revenue $15,000 $15,000 $15,000 $15,000 $15,000 $15,000
Annual Labour Cost -$3,000 -$3,000 -$3,000 -$3,000 -$3,000 -$3,000
Annual Power & Maintenance Cost -$1,500 -$1,500 -$1,500 -$1,500 -$1,500 -$1,500
Depreciation -$5,000 -$5,000 -$5,000 -$5,000 -$5,000 -$5,000
Net Profit before Tax $5,500 $5,500 $5,500 $5,500 $5,500 $5,500
Less: Income Tax -$1,650 -$1,650 -$1,650 -$1,650 -$1,650 -$1,650
Net Profit after Tax $3,850 $3,850 $3,850 $3,850 $3,850 $3,850
Add: Depreciation $5,000 $5,000 $5,000 $5,000 $5,000 $5,000
Net Operating Cash Flow $8,850 $8,850 $8,850 $8,850 $8,850 $8,850
Salvage Value:
Salvage Value $1,500
Less: Income Tax -$450
Net Salvage Value $1,050
Net Cash Flow -$30,000 $8,850 $8,850 $8,850 $8,850 $8,850 $9,900
After Tax Rate of Return 10%
Annual Worth -$11,193.81
Present Worth $24,150
IRR 19.71%
Years
Answer to Question 2
The benefit/cost method is used by business in which the magnitude of benefits which
can be derived from an alternative is compared with the magnitude of cost. It is denoted by B/C.
A conventional B/C analysis is used generally in Government projects (1). In case of Modified
benefit/cost method the annual operating and maintenance cost are deducted from the annual
benefits which arises from the project. Both Modified and Conventional Method of computing
benefit to cost ratio have significance in capital investment decisions. The benefit cost ratio is
Paraphrase This Document
Need a fresh take? Get an instant paraphrase of this document with our AI Paraphraser
7
FINANCIAL ANALYSIS
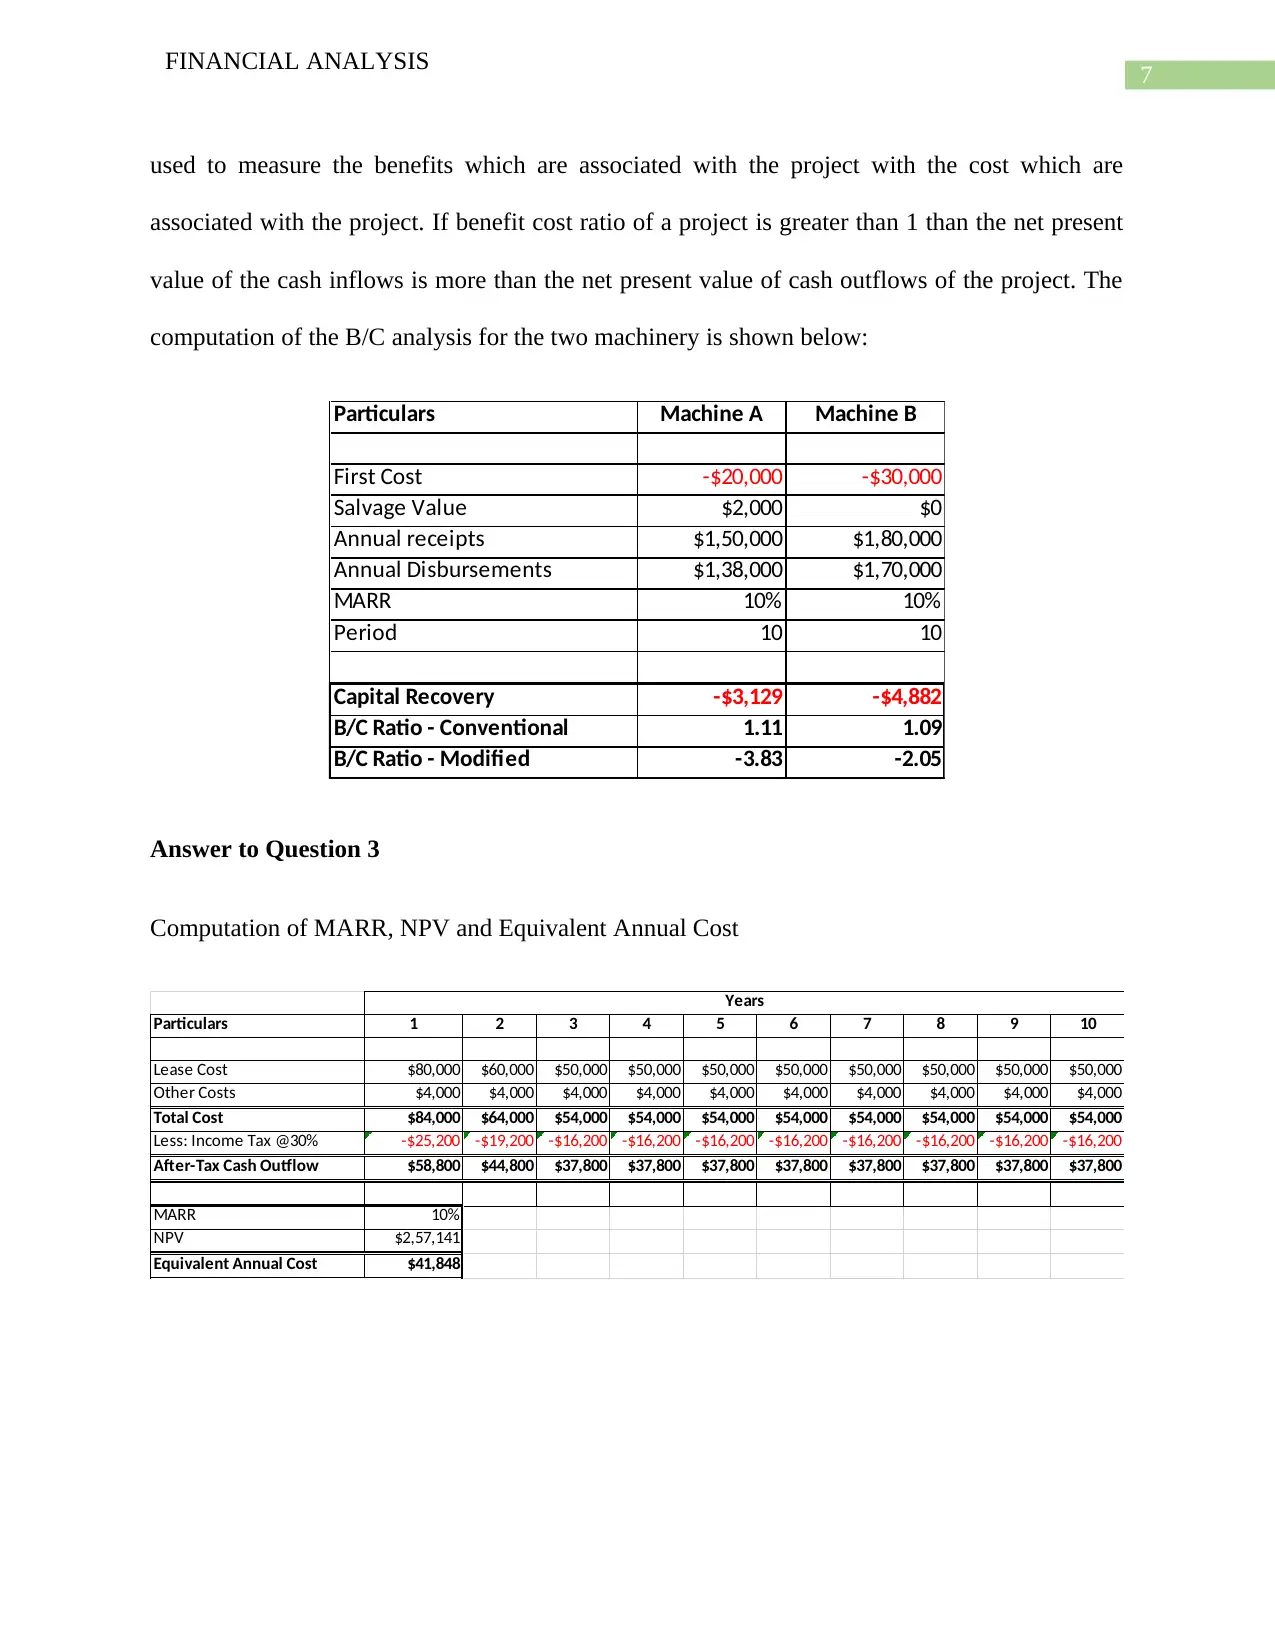
used to measure the benefits which are associated with the project with the cost which are
associated with the project. If benefit cost ratio of a project is greater than 1 than the net present
value of the cash inflows is more than the net present value of cash outflows of the project. The
computation of the B/C analysis for the two machinery is shown below:
Particulars Machine A Machine B
First Cost -$20,000 -$30,000
Salvage Value $2,000 $0
Annual receipts $1,50,000 $1,80,000
Annual Disbursements $1,38,000 $1,70,000
MARR 10% 10%
Period 10 10
Capital Recovery -$3,129 -$4,882
B/C Ratio - Conventional 1.11 1.09
B/C Ratio - Modified -3.83 -2.05
Answer to Question 3
Computation of MARR, NPV and Equivalent Annual Cost
Particulars 1 2 3 4 5 6 7 8 9 10
Lease Cost $80,000 $60,000 $50,000 $50,000 $50,000 $50,000 $50,000 $50,000 $50,000 $50,000
Other Costs $4,000 $4,000 $4,000 $4,000 $4,000 $4,000 $4,000 $4,000 $4,000 $4,000
Total Cost $84,000 $64,000 $54,000 $54,000 $54,000 $54,000 $54,000 $54,000 $54,000 $54,000
Less: Income Tax @30% -$25,200 -$19,200 -$16,200 -$16,200 -$16,200 -$16,200 -$16,200 -$16,200 -$16,200 -$16,200
After-Tax Cash Outflow $58,800 $44,800 $37,800 $37,800 $37,800 $37,800 $37,800 $37,800 $37,800 $37,800
MARR 10%
NPV $2,57,141
Equivalent Annual Cost $41,848
Years
FINANCIAL ANALYSIS
used to measure the benefits which are associated with the project with the cost which are
associated with the project. If benefit cost ratio of a project is greater than 1 than the net present
value of the cash inflows is more than the net present value of cash outflows of the project. The
computation of the B/C analysis for the two machinery is shown below:
Particulars Machine A Machine B
First Cost -$20,000 -$30,000
Salvage Value $2,000 $0
Annual receipts $1,50,000 $1,80,000
Annual Disbursements $1,38,000 $1,70,000
MARR 10% 10%
Period 10 10
Capital Recovery -$3,129 -$4,882
B/C Ratio - Conventional 1.11 1.09
B/C Ratio - Modified -3.83 -2.05
Answer to Question 3
Computation of MARR, NPV and Equivalent Annual Cost
Particulars 1 2 3 4 5 6 7 8 9 10
Lease Cost $80,000 $60,000 $50,000 $50,000 $50,000 $50,000 $50,000 $50,000 $50,000 $50,000
Other Costs $4,000 $4,000 $4,000 $4,000 $4,000 $4,000 $4,000 $4,000 $4,000 $4,000
Total Cost $84,000 $64,000 $54,000 $54,000 $54,000 $54,000 $54,000 $54,000 $54,000 $54,000
Less: Income Tax @30% -$25,200 -$19,200 -$16,200 -$16,200 -$16,200 -$16,200 -$16,200 -$16,200 -$16,200 -$16,200
After-Tax Cash Outflow $58,800 $44,800 $37,800 $37,800 $37,800 $37,800 $37,800 $37,800 $37,800 $37,800
MARR 10%
NPV $2,57,141
Equivalent Annual Cost $41,848
Years
8
FINANCIAL ANALYSIS
Answer to Question 4
Machine X:
Particulars 0 1 2 3 4 5 6 7 8 9 10
Machine Cost -$20,000
Less: Trade-in- Allowance $0
Net Cost -$20,000
Annual Operating & Maintenance Cost -$90,000 -$90,000 -$90,000 -$90,000 -$90,000 -$90,000 -$90,000 -$90,000 -$90,000 -$90,000
Salvage Value $0
After-Tax Cash Outflow -$20,000 -$90,000 -$90,000 -$90,000 -$90,000 -$90,000 -$90,000 -$90,000 -$90,000 -$90,000 -$90,000
MARR 10%
NPV -$5,20,919
Equivalent Annual Cost -$84,777
Years
Machine Y:
Particulars 0 1 2 3 4 5 6 7 8 9 10
Machine Cost -$1,20,000
Less: Trade-in- Allowance $20,000
Net Cost -$1,00,000
Annual Operating & Maintenance Cost -$70,000 -$70,000 -$70,000 -$70,000 -$70,000 -$70,000 -$70,000 -$70,000 -$70,000 -$70,000
Salvage Value $30,000
After-Tax Cash Outflow -$1,00,000 -$70,000 -$70,000 -$70,000 -$70,000 -$70,000 -$70,000 -$70,000 -$70,000 -$70,000 -$40,000
MARR 10%
NPV -$4,71,412
Equivalent Annual Cost -$76,720
Years
Machine Z:
Particulars 0 1 2 3 4 5 6 7 8 9 10
Machine Cost -$1,60,000
Less: Trade-in- Allowance $0
Net Cost -$1,60,000
Annual Operating & Maintenance Cost -$60,000 -$60,000 -$60,000 -$60,000 -$60,000 -$60,000 -$60,000 -$60,000 -$60,000 -$60,000
Salvage Value $50,000
After-Tax Cash Outflow -$1,60,000 -$60,000 -$60,000 -$60,000 -$60,000 -$60,000 -$60,000 -$60,000 -$60,000 -$60,000 -$10,000
MARR 10%
NPV -$4,63,088
Equivalent Annual Cost -$75,365
Years
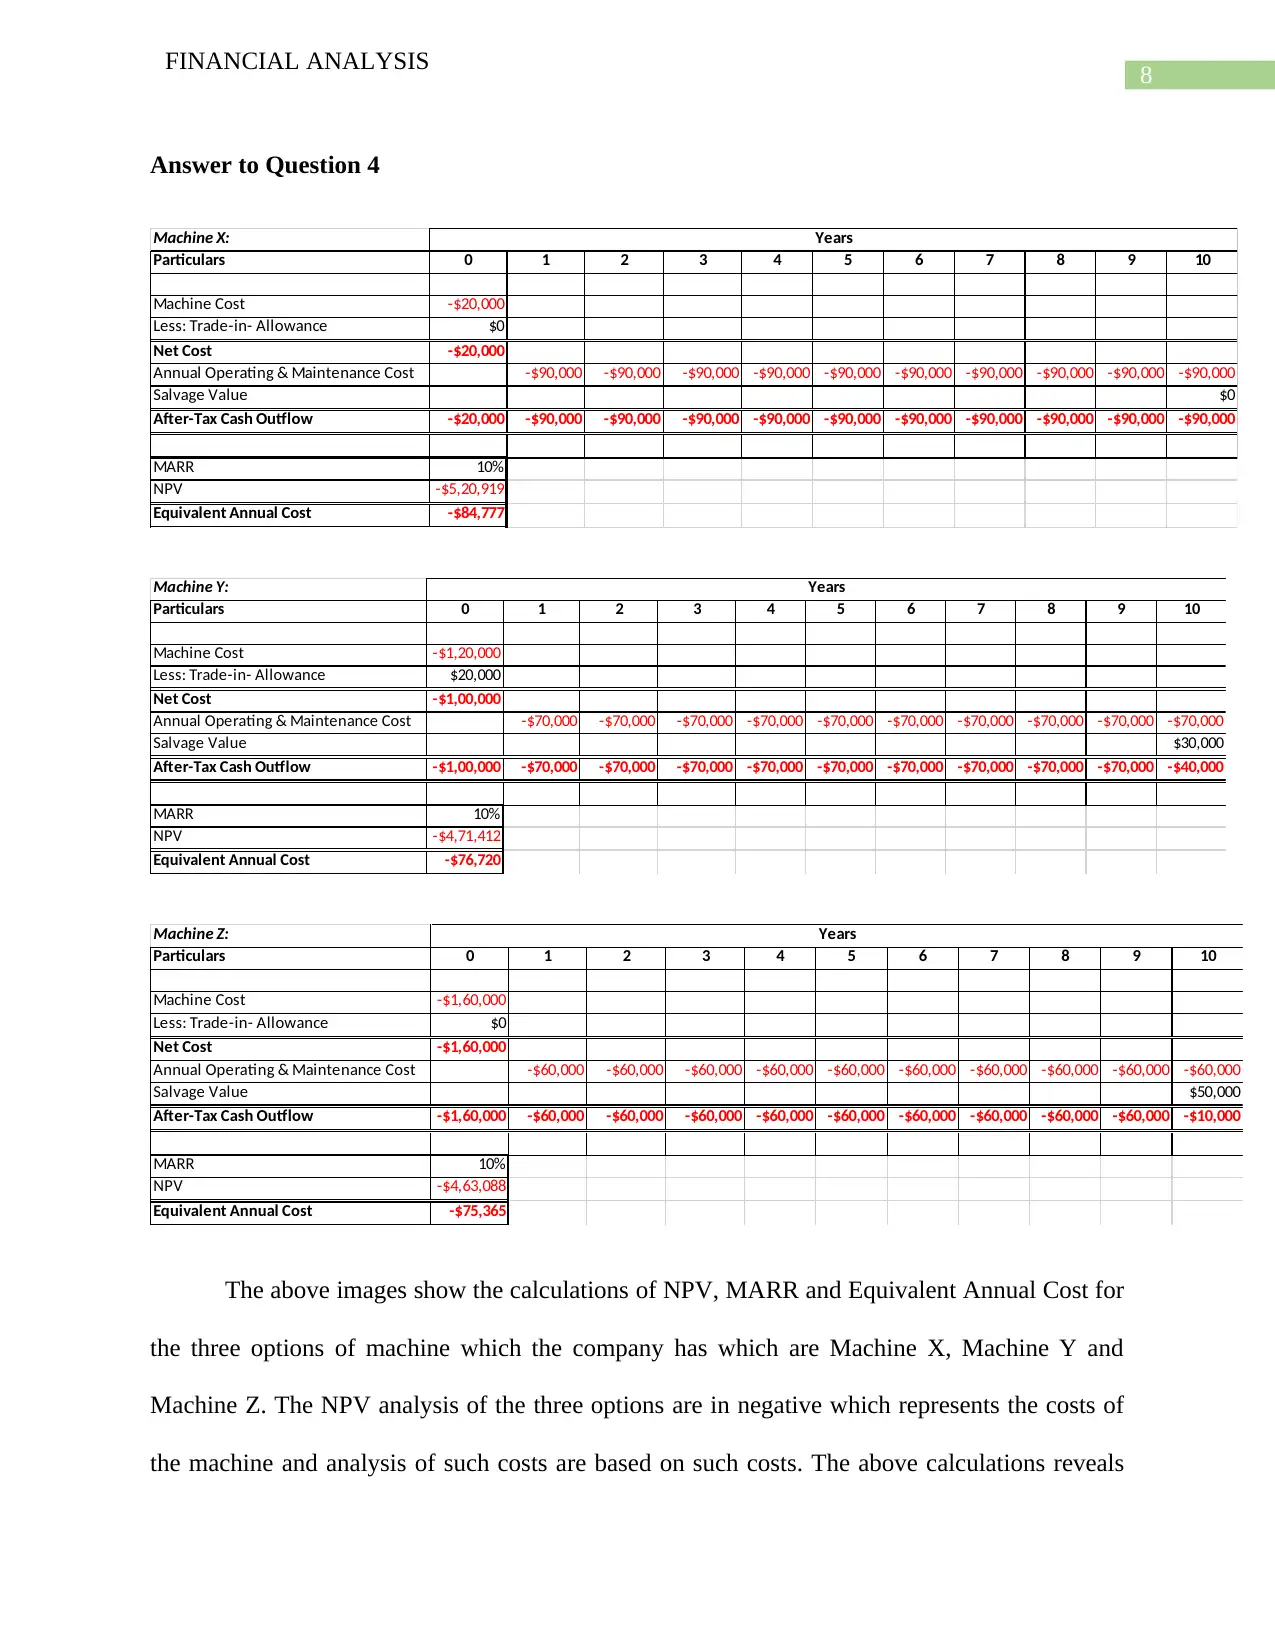
The above images show the calculations of NPV, MARR and Equivalent Annual Cost for
the three options of machine which the company has which are Machine X, Machine Y and
Machine Z. The NPV analysis of the three options are in negative which represents the costs of
the machine and analysis of such costs are based on such costs. The above calculations reveals
FINANCIAL ANALYSIS
Answer to Question 4
Machine X:
Particulars 0 1 2 3 4 5 6 7 8 9 10
Machine Cost -$20,000
Less: Trade-in- Allowance $0
Net Cost -$20,000
Annual Operating & Maintenance Cost -$90,000 -$90,000 -$90,000 -$90,000 -$90,000 -$90,000 -$90,000 -$90,000 -$90,000 -$90,000
Salvage Value $0
After-Tax Cash Outflow -$20,000 -$90,000 -$90,000 -$90,000 -$90,000 -$90,000 -$90,000 -$90,000 -$90,000 -$90,000 -$90,000
MARR 10%
NPV -$5,20,919
Equivalent Annual Cost -$84,777
Years
Machine Y:
Particulars 0 1 2 3 4 5 6 7 8 9 10
Machine Cost -$1,20,000
Less: Trade-in- Allowance $20,000
Net Cost -$1,00,000
Annual Operating & Maintenance Cost -$70,000 -$70,000 -$70,000 -$70,000 -$70,000 -$70,000 -$70,000 -$70,000 -$70,000 -$70,000
Salvage Value $30,000
After-Tax Cash Outflow -$1,00,000 -$70,000 -$70,000 -$70,000 -$70,000 -$70,000 -$70,000 -$70,000 -$70,000 -$70,000 -$40,000
MARR 10%
NPV -$4,71,412
Equivalent Annual Cost -$76,720
Years
Machine Z:
Particulars 0 1 2 3 4 5 6 7 8 9 10
Machine Cost -$1,60,000
Less: Trade-in- Allowance $0
Net Cost -$1,60,000
Annual Operating & Maintenance Cost -$60,000 -$60,000 -$60,000 -$60,000 -$60,000 -$60,000 -$60,000 -$60,000 -$60,000 -$60,000
Salvage Value $50,000
After-Tax Cash Outflow -$1,60,000 -$60,000 -$60,000 -$60,000 -$60,000 -$60,000 -$60,000 -$60,000 -$60,000 -$60,000 -$10,000
MARR 10%
NPV -$4,63,088
Equivalent Annual Cost -$75,365
Years
The above images show the calculations of NPV, MARR and Equivalent Annual Cost for
the three options of machine which the company has which are Machine X, Machine Y and
Machine Z. The NPV analysis of the three options are in negative which represents the costs of
the machine and analysis of such costs are based on such costs. The above calculations reveals
⊘ This is a preview!⊘
Do you want full access?
Subscribe today to unlock all pages.
Trusted by 1+ million students worldwide
9
FINANCIAL ANALYSIS
that the Machine Z is the most favorable option which is available to the company as the NPV of
the cash outflows is lowest which is -$ 4,63,088.
Answer to Question 5
Introduction
The main purpose of this assignment is to analyze the projects selection process of ABC
ltd which is engaged in manufacturing activities. The company is planning to further expand the
business and thereby needs to invest in a machinery for which the management of the company
has options. For the purpose of selection of the options, the management will be applying capital
budgeting techniques which will be involving NPV analysis, payback period analysis,
profitability index analysis. The assignment also be commenting on the gaps which are there in
Life cycle costing technique and will also be recommending to ABC ltd as to how the business
can assess its risks better and improve the cost/benefit analysis of the business.
Gaps in Life Cycle Costing
Life cycle cost is a cost process which considers the actual cost and revenues which are
attributable to a product from the first use of the product till the product becomes obsolete. In
other words, life cycle cost technique follows the cost which are associated with the product over
the years or in other words over the life cycle of the project. the total cost of the product involves
all the costs which are costs which are related to planning, design, acquisition and support costs
and any other costs which are related to the product (5). Life cycle costing represents the total
cost of ownership in case of an asset and similarly will be including all the costs which will be
incurred over the life time of the asset. The method allows businesses to consider all the costs
which are incurred by the machinery for acquisition, maintenance, reimbursement or disposal
Paraphrase This Document
Need a fresh take? Get an instant paraphrase of this document with our AI Paraphraser
10
FINANCIAL ANALYSIS
when the business wants to take a decision. In other words, life cycle costing method for an asset
considers the full cost implication of the asset before taking any decisions. The basic difference
between traditional method of costing and life cycle costing lies in time period for which cost is
considered. In case of traditional system of costing, costs are considered on the basis of calendar
year whereas in life cycle costing method, the cost and revenues which are associated with the
asset or product is traced through several calendar year which shows that life cycle costing is a
longer process and is much more wide.
Thus, from the above discussions it is clear that life cycle costing approach is carried out
by business so as to get a clear picture of the long-term picture of the cost and revenues
associated with the project. The advantage of using this costing method is that it enhances
control of the business over manufacturing costs. In addition to this, it is essential because it
keeps a track and measure of the costs of the product or asset at different stages of life of the
asset. In the case of ABC ltd, the company wants to implement life cycle costing techniques for
the ascertain and monitoring the costs which are associated with asset over the useful life of the
asset (6). However, there are certain gaps which are present in the life cycle costing technique
which are mentioned below in points form:
1. The technique of product life cycle costing spreads the expense or cost related with the
asset over the useful life of the asset which might not be accurate as initial cost which are
incurred on the asset at beginning of its life might be less than what the expenses are
incurred on the asset towards the end of the useful life of the asset.
2. It is important to monitor the continuous performance of the asset after implementation of
life cycle costing techniques as if proper monitoring is not maintained than the costs
associated with the asset will become more than the benefits.
11
FINANCIAL ANALYSIS
3. In case a business takes loan for purchase of asset and as per life cycle costing the loan
amount will be repaid over the useful life of the asset which means the company would
have to bear interest charges over the useful life of the asset which might not be a good
option.
4. The technique of life cycle costing assumes that the performance of the assets which is in
the initial years will not be same as the performance of the asset in the later years of the
useful life of the asset. This concept is not appropriate as such might not be the case and
therefore the costs assumption of the business might not be realistic
The above mention points are the various limitation or gaps which the techniques Life cycle
costing faces in comparison to traditional and other costing techniques.
Recommendations
The recommendations which can be given to the company for improving benefit/cost
analysis and risks of the business are given below:
1. The business needs to implement a proper capital structure so as to reduce the cost of
capital which signifies risks which are associated with the capital structure of the
business. The business needs to incorporate debt capital and equity capital in the capital
mix so as to attain a favorable balance in the capital structure.
2. The management of the company needs to conduct NPV analysis so as to ensure that the
assets which the management of the company intends to invest on has benefits which
exceeds the cost which is related to the asset. The management of the company
⊘ This is a preview!⊘
Do you want full access?
Subscribe today to unlock all pages.
Trusted by 1+ million students worldwide
1 out of 14
Related Documents


Your All-in-One AI-Powered Toolkit for Academic Success.
+13062052269
info@desklib.com
Available 24*7 on WhatsApp / Email
![[object Object]](/_next/static/media/star-bottom.7253800d.svg)
Unlock your academic potential
Copyright © 2020–2026 A2Z Services. All Rights Reserved. Developed and managed by ZUCOL.