Accounting for Decision Making: Comparative Financial Analysis Report
VerifiedAdded on  2022/11/22
|24
|3018
|323
Report
AI Summary
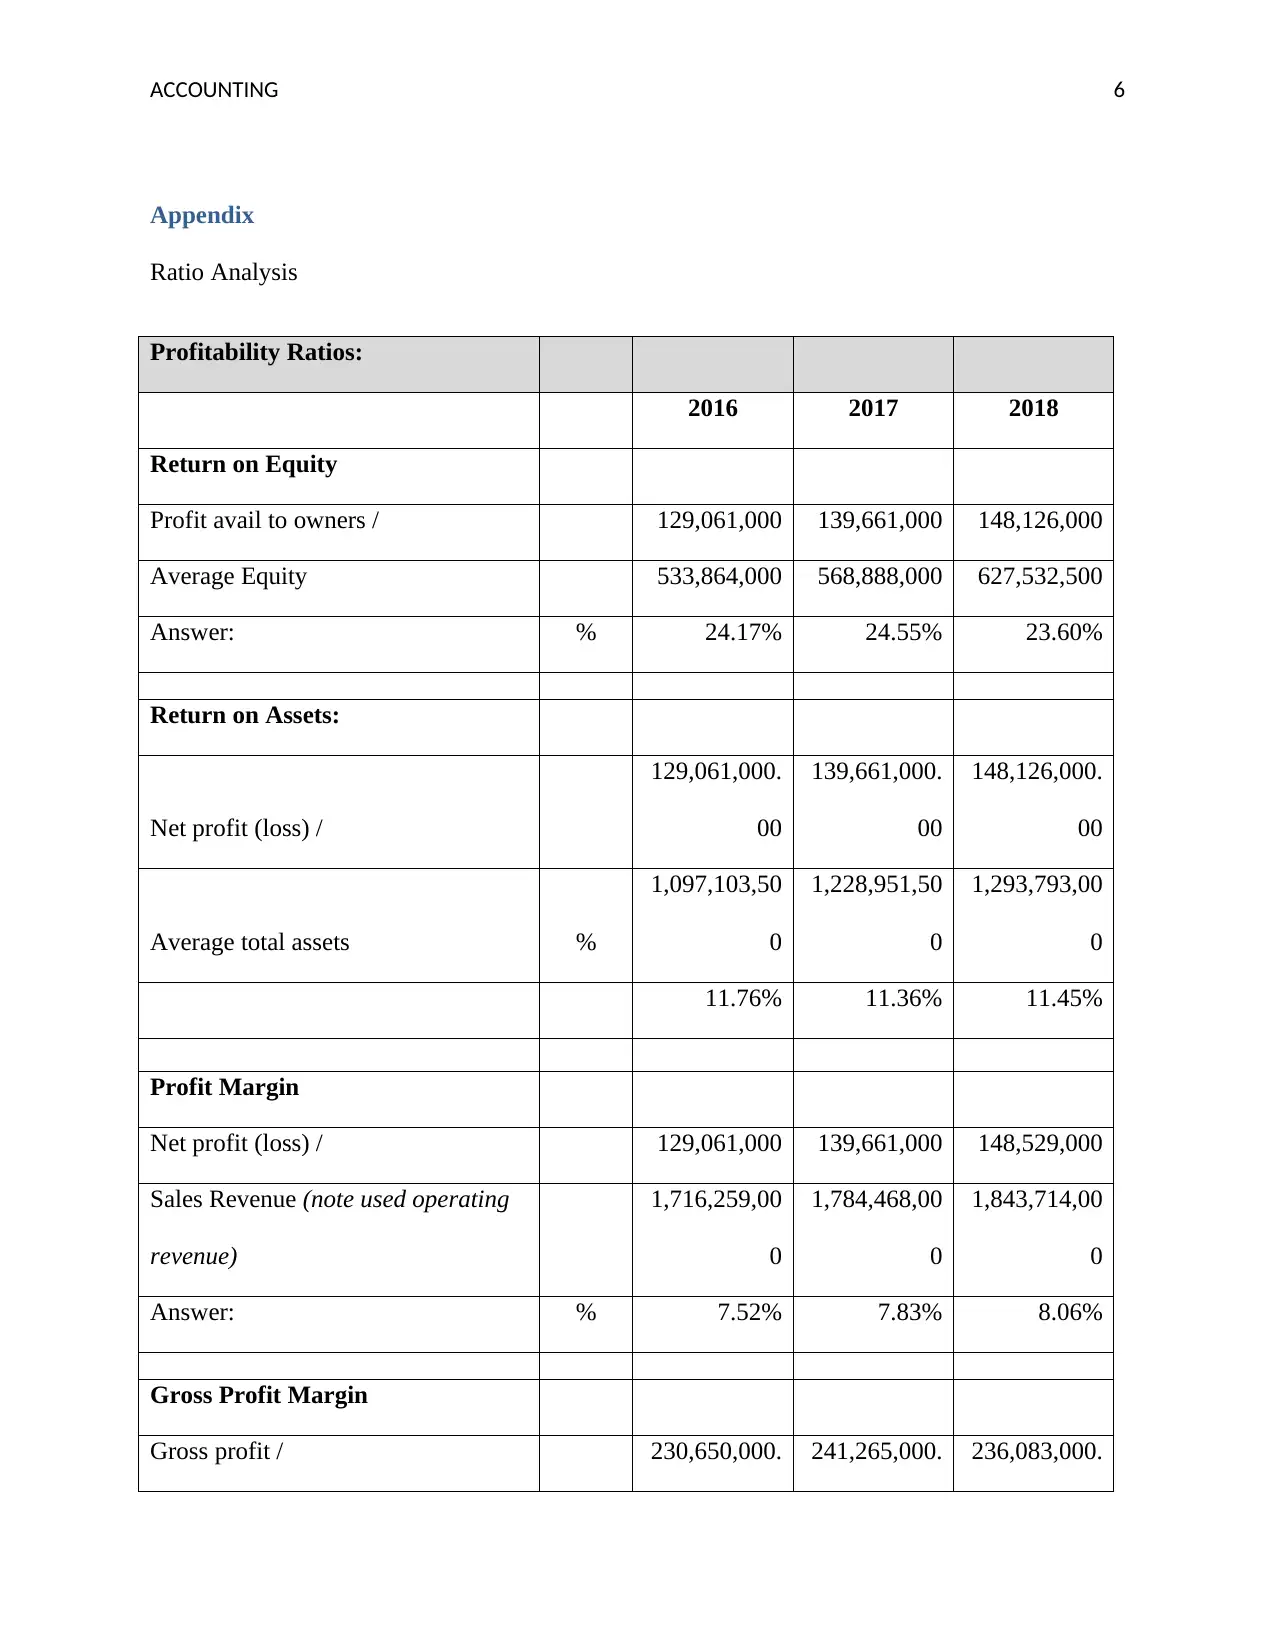
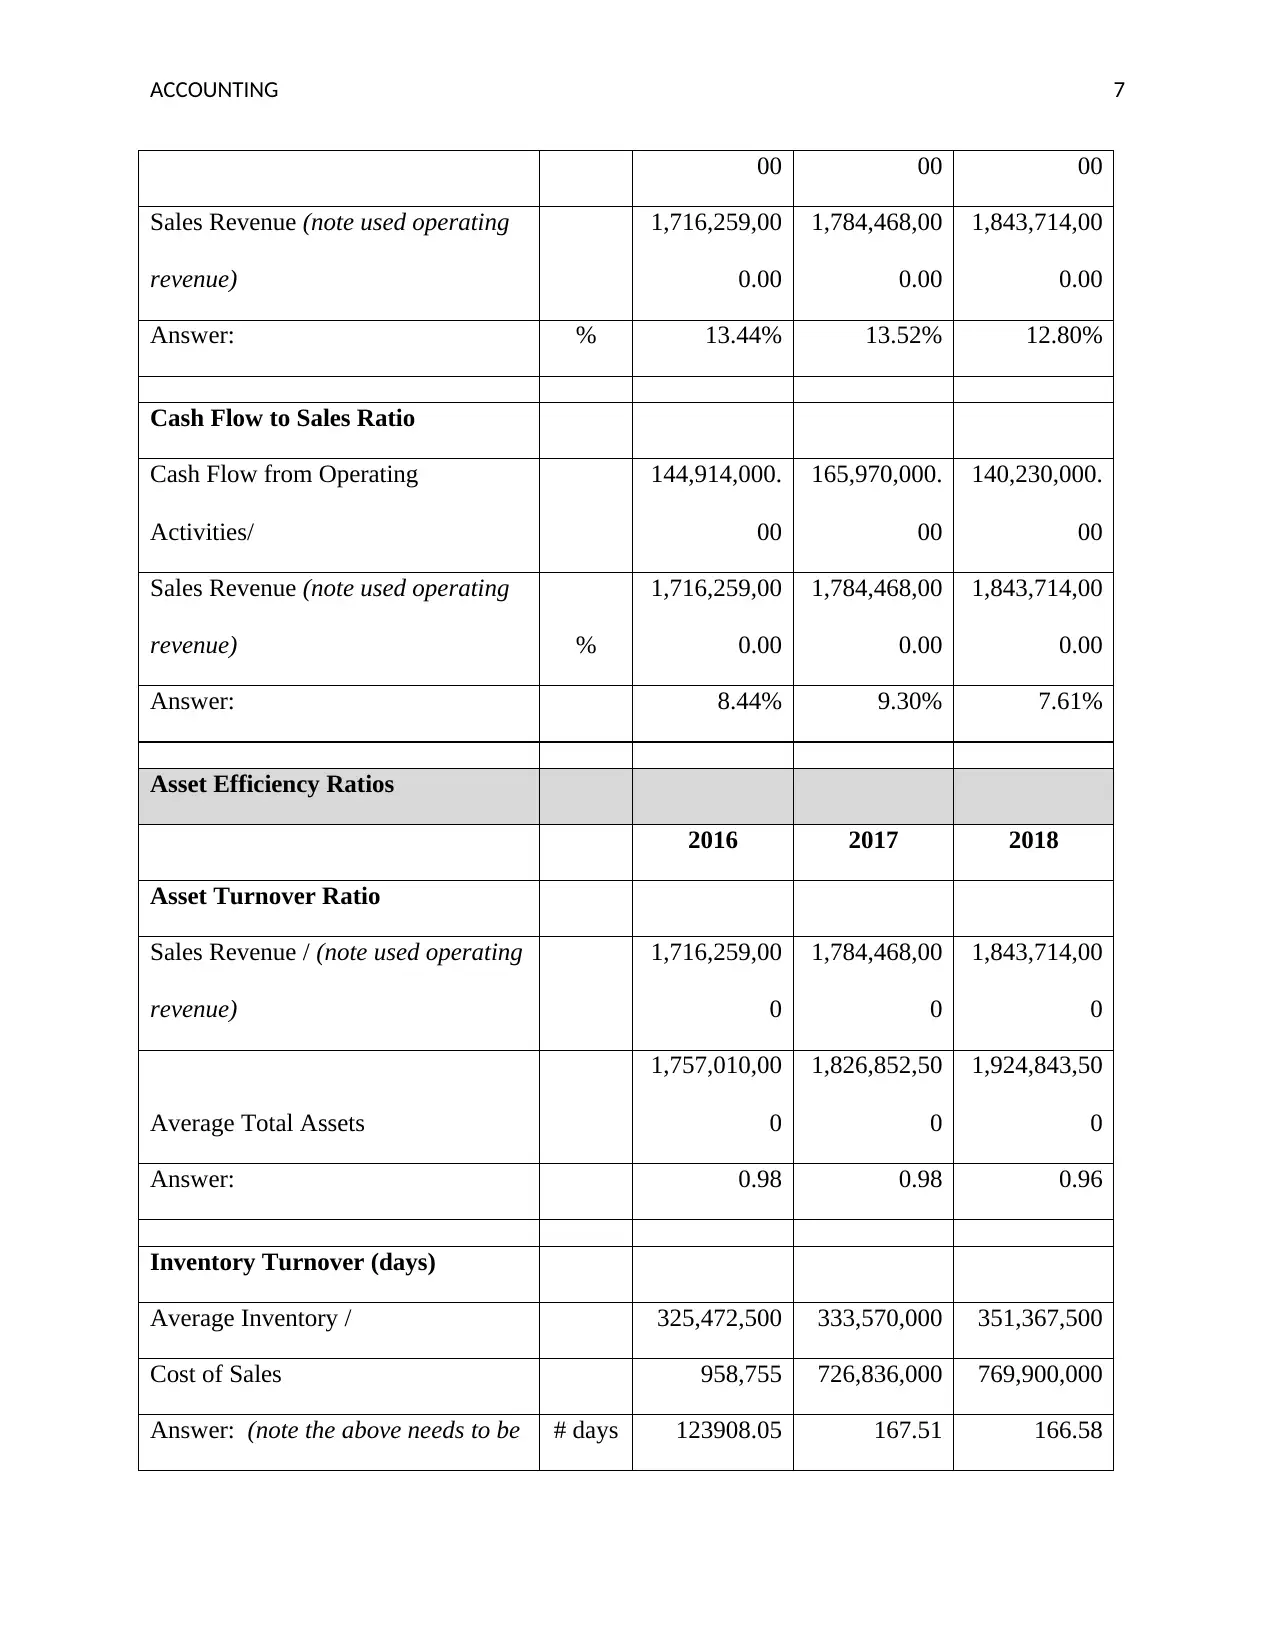
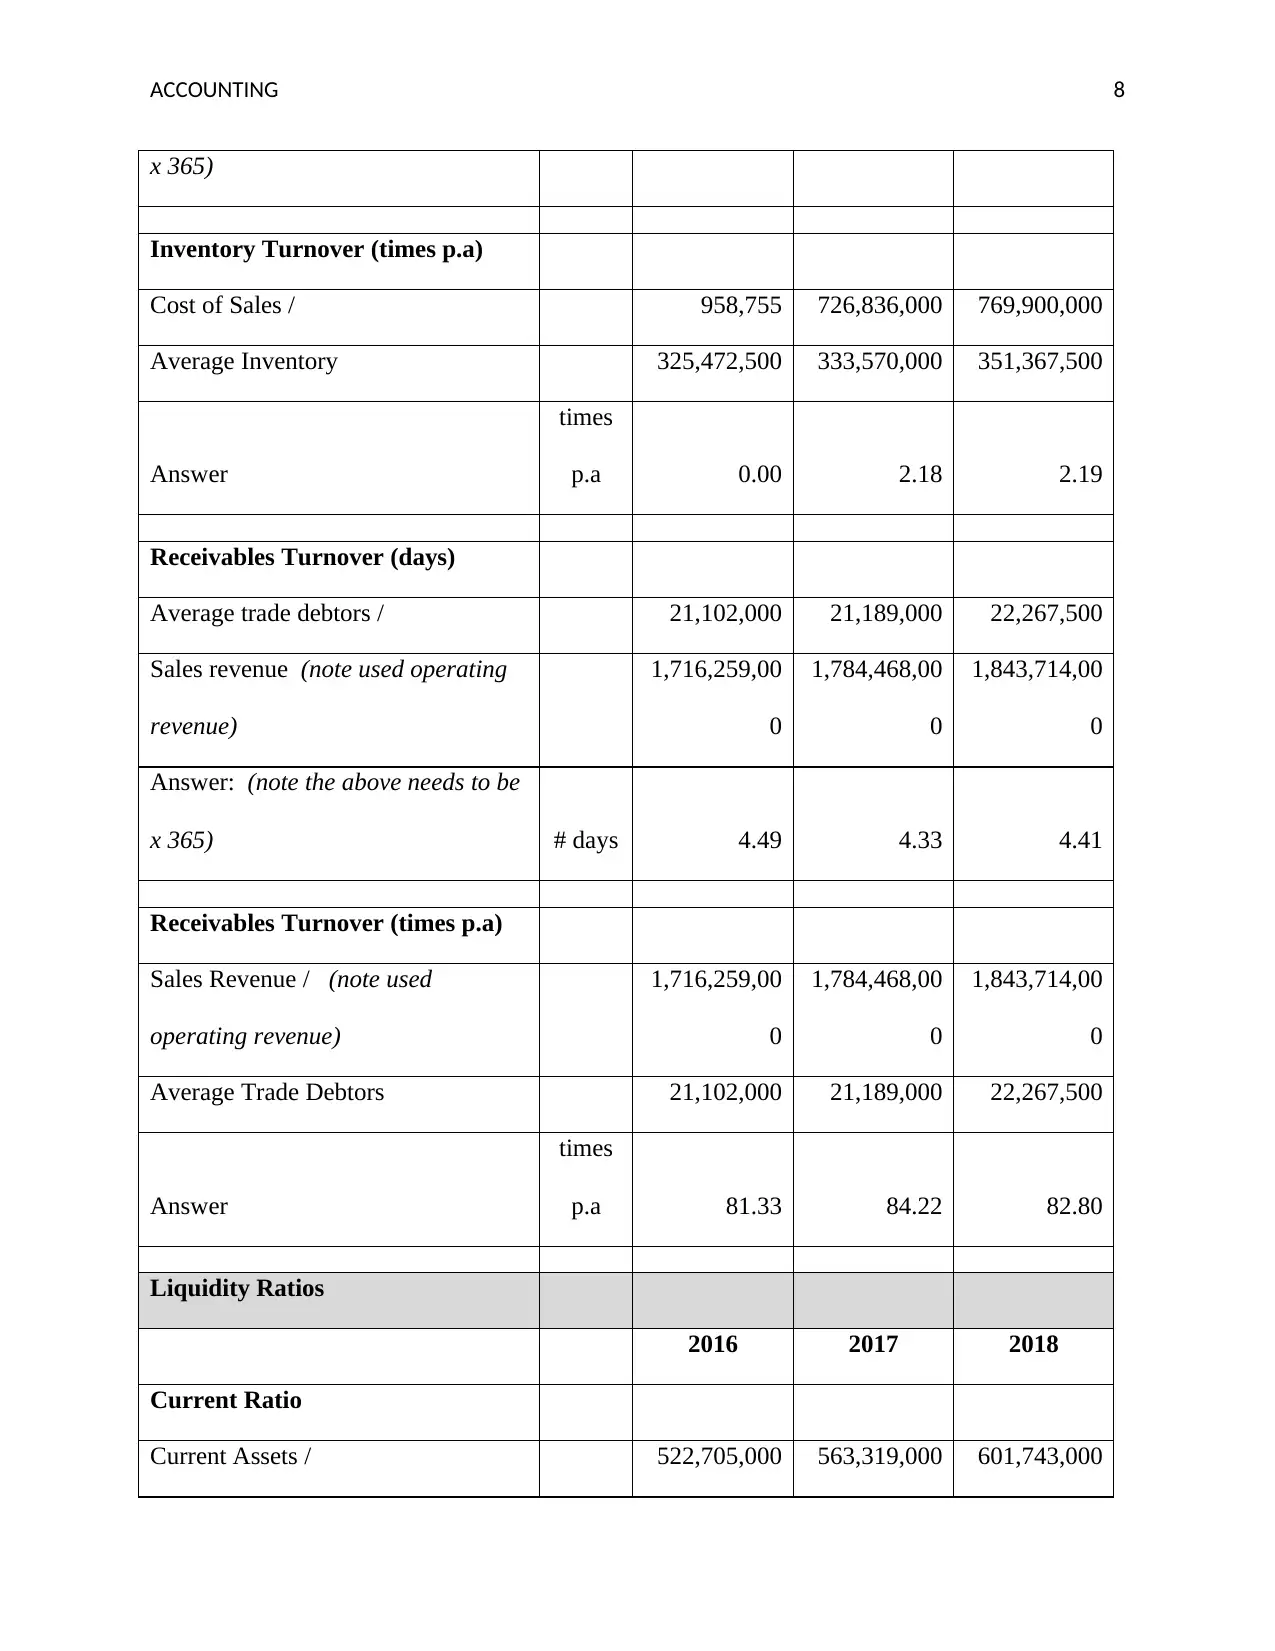
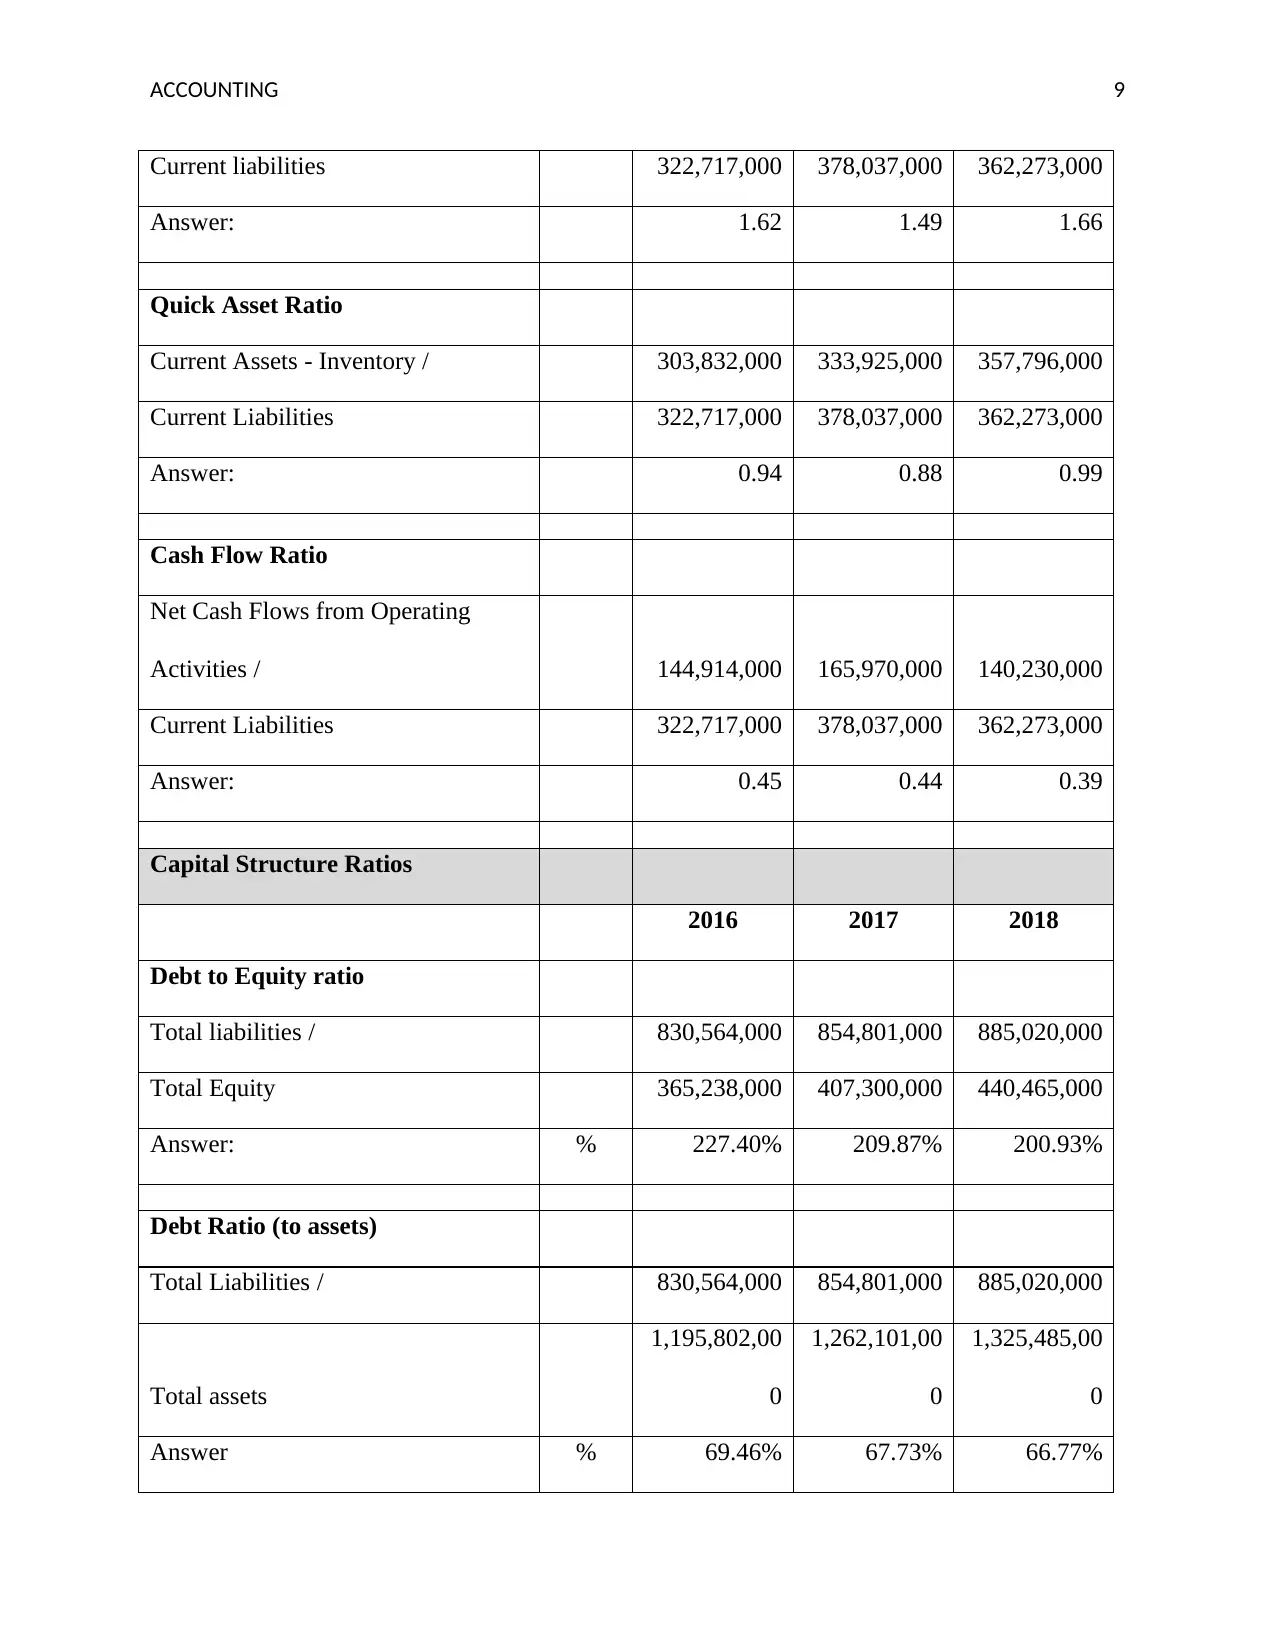
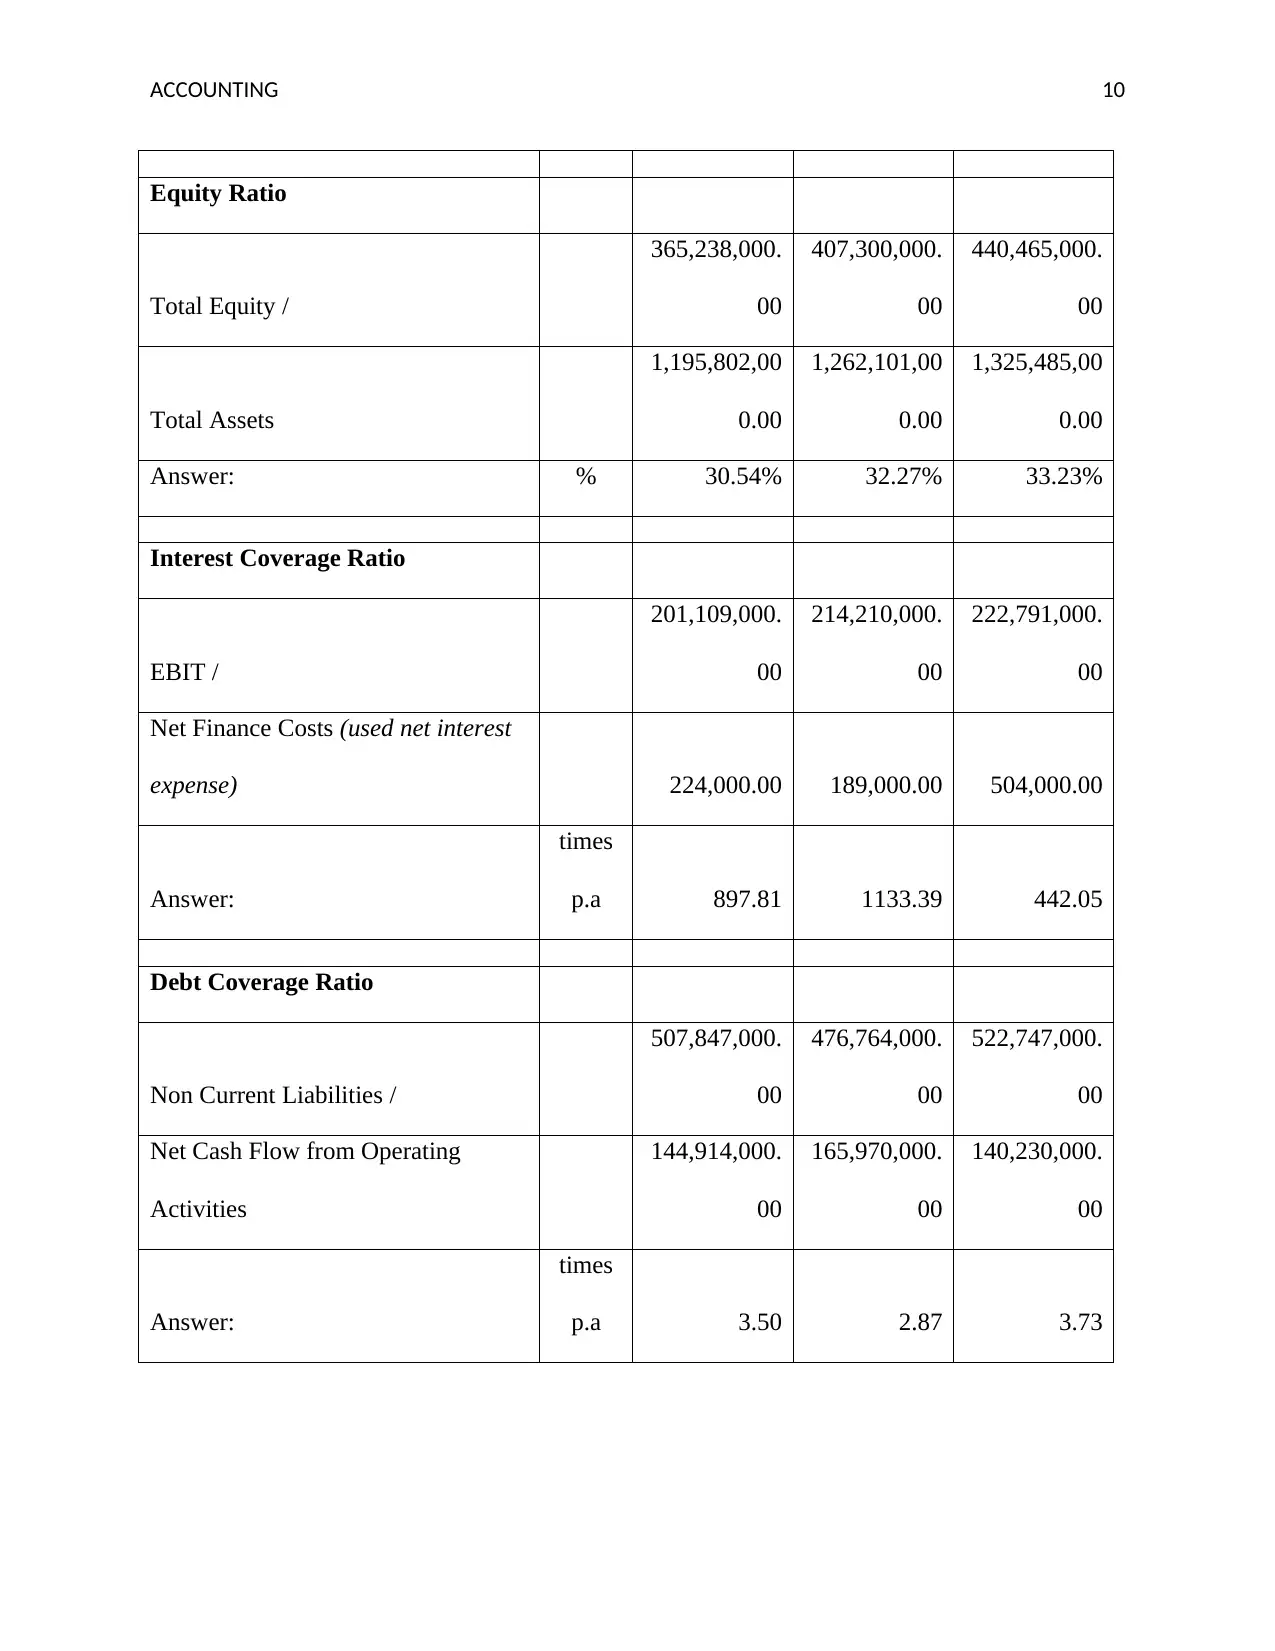
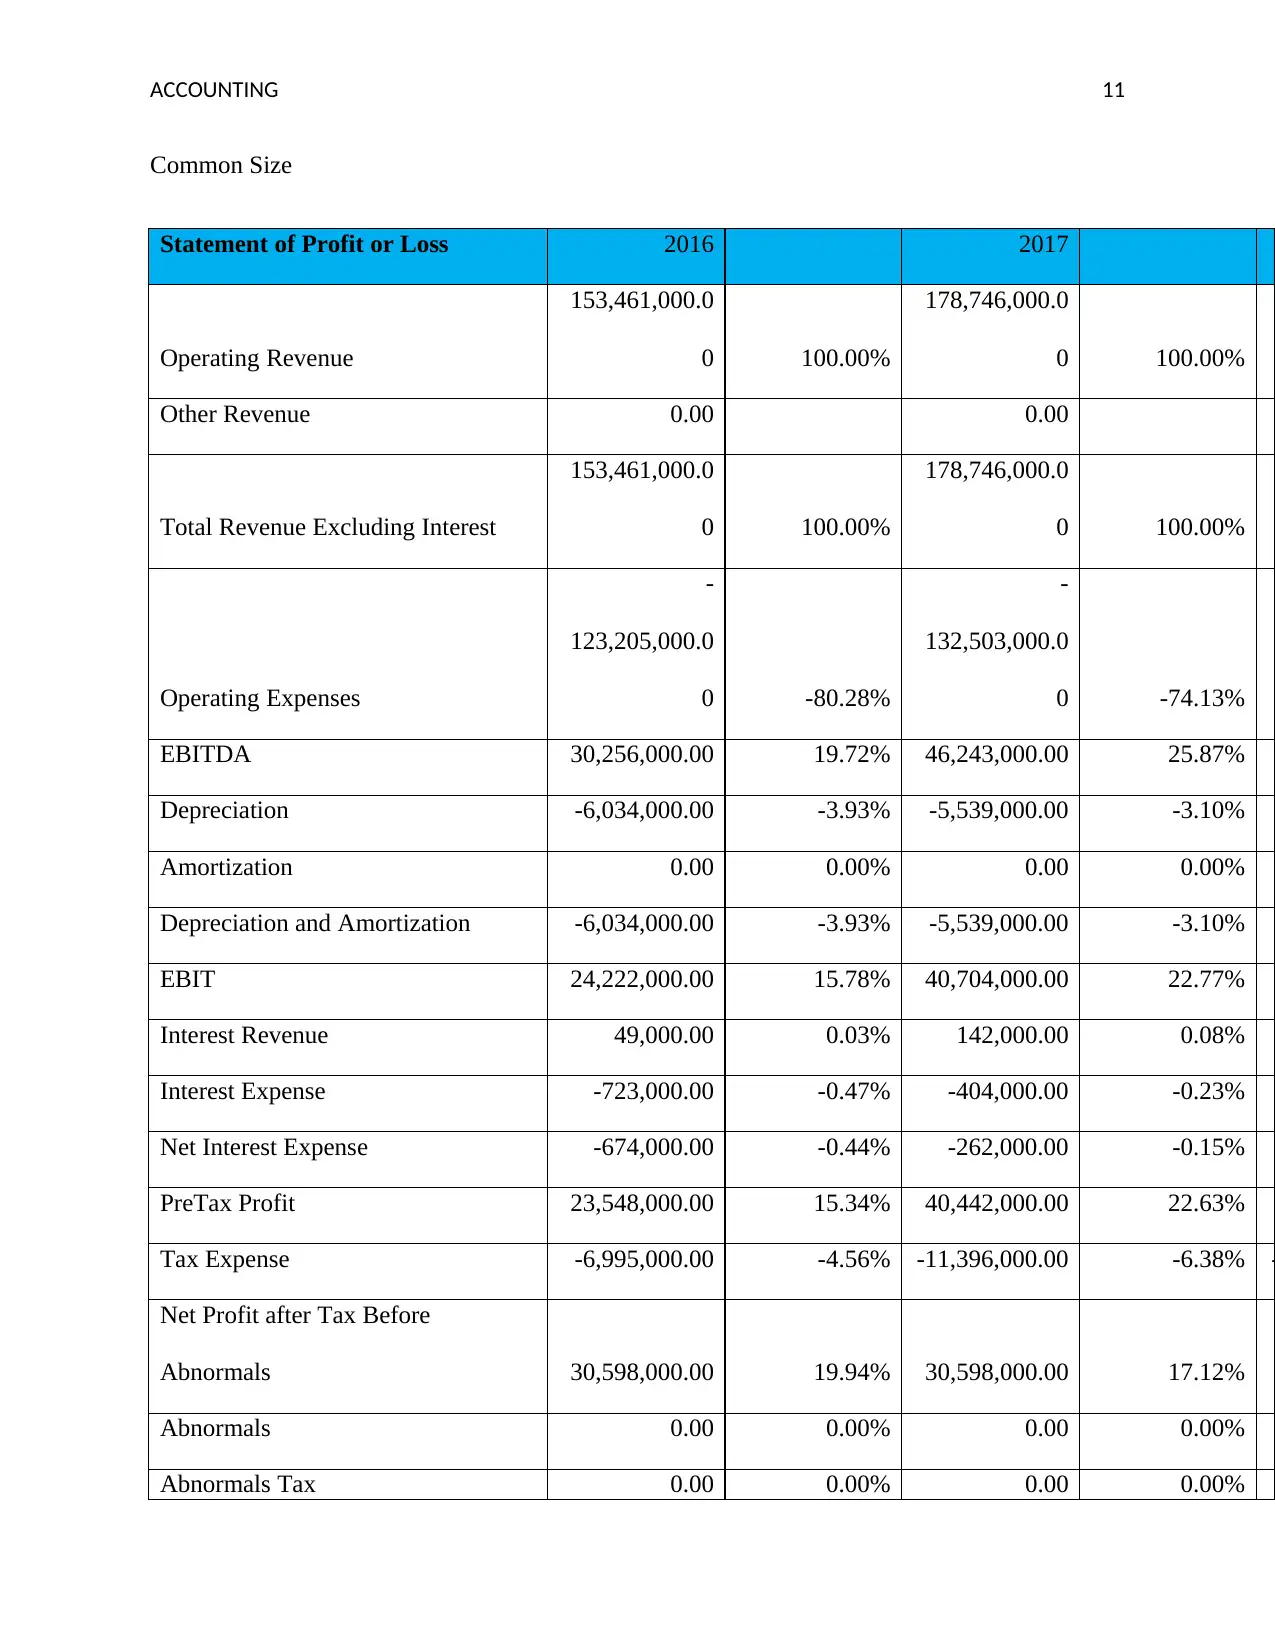
This report presents a comparative financial analysis of Dulux Group Limited and Lovisa Holdings Limited, focusing on their financial performance. The analysis includes a detailed examination of profitability ratios (Return on Equity, Return on Assets, Profit Margin, Gross Profit Margin, Cash Flow to Sales Ratio), asset efficiency ratios (Asset Turnover Ratio, Inventory Turnover, Receivables Turnover), liquidity ratios (Current Ratio, Quick Asset Ratio, Cash Flow Ratio), and capital structure ratios (Debt to Equity ratio, Debt Ratio, Equity Ratio, Interest Coverage Ratio). The study evaluates the companies' financial positions, highlighting trends and limitations, and provides recommendations based on the findings. The report utilizes data from the years 2016, 2017, and 2018 to conduct its comparative analysis and offers insights into the companies' strengths and areas for improvement.

Accounting for decision making
Paraphrase This Document
Need a fresh take? Get an instant paraphrase of this document with our AI Paraphraser

ACCOUNTING 1
Introduction
Financial Analysis is the procedure of evaluating of financial position of the firm. The external
parties are required the financial information of the company in order to invest in the company.
The external parties have to compare the financial performance of the companies to take the
accurate decision for smooth operation of business. In this report, the comparison has been done
on the two companies such as Dulux and Lovis Holding Limited. In this report, the comparative
analysis has been done on the financial performance of these companies.
Dulux Group is a foremost marketer and manufacturers of premium brand-named products that
protect, and develop the spaces and places in which we live and work. It transformed the
household rooms by colors and texture (Duluxgroup, 2018).
Lovisa Holdings Limited is a locally owned business which works in fast-fashion jewellery and
accessories retail chain. It has the 320 stores which are located in nine countries and franchise
operations in the other six countries (IBIS World, 2018).
Comparative Analysis
The financial position of Dulux Group Limited states that the company is constant from the last
year. It has been evaluated that the profit margin of 2018 is 8.06% and in 2017 it is 7.83% which
shows that the changes of percentage is not major bur the company earns more profit from the
last year. It has been seen that the gross profit of the firm is decreasing in the year 2018 which
depict that the company has to more focuses on its cost of production as it affects the business.
The gross profit of Lovisa is also decreasing in the year 2018 due to increasing the cost of
production (Robinson, Henry, Pirie, & Broihahn, 2015).

ACCOUNTING 2
The efficiency Ratio of Dulux Group Limited is strong as it takes less time to receive the amount
from debtors. But it has been found that Lovisa Holdings Limited consumes less time to collects
the debtor’s amount as compare to Dulux Group Limited such as it takes 2.87 days to collect the
amount and Dulux Group Limited takes 4.41 days to receive the cash (Zainudin, & Hashim,
2016).
As per the liquidity position ratio of the companies, it has been evaluated that the current ratio of
Lovisa Holdings Limited is increasing in the year 2018 by 1.94 and the quick ratio is 1.25. It
depicts that the company more invests in current assets instead of fixed asset. The liquidity
position of Dulux Group Limited depict that the firm starts focusing on current assets rather than
fixed assets in order to earn the more revenue. The current ratio and quick ratio of Dulux Group
Limited is 0.88 and 0.99 in the year 2018 (Williams, & Dobelman, 2017).
According to the capital structure ratio, it is observed that the long term liability of Dulux Group
Limited is decreasing with the passage of time. In 2018, the total liabilities of the company is
less as compare to its total assets which indicates that the company is able to pay its all liabilities
by utilizing its assets. In the case of Lovisa Holdings, the debt ratio depict that the company is in
the position of improvement as it has more assets as compare to liabilities. But by comparing the
companies, it has been found that Dulux has more assets with the liabilities as compare to
Lovisa.
⊘ This is a preview!⊘
Do you want full access?
Subscribe today to unlock all pages.

Trusted by 1+ million students worldwide

ACCOUNTING 3
Limitations
While analyzing the both companies, it has been found that there are some areas in which both
the companies perform well due to which it is difficult to take the decision of choosing one
company to invest in it.
Another challenge which was faced while comparing the financial performance of the companies
is the accurate results. It is very difficult to calculate the accurate result as the financial
performance of the firm is evaluated on the basis of ratio analysis. Ratio Analysis does not
evaluate the accurate result as it is calculated on market value which is fluctuating.
Another challenge is that it difficult to choose the one company for investment on the basis of
financial performance as both the companies are almost in the similar phase. Similar phase
means the financial position of the companies are equal but there are also some areas such as in
which it have huge different and need to be recover to improve the financial performance.
The huge confusion have been also arises while comparing the financial data of both the
companies such as similar amount under the same ratio headings (Accounting Tools, 2018).
Conclusion
As per the limitation, it is difficult to find out the correct choose as both the companies have
similar financial position. It is observed that the companies have more current assets as compare
to current liabilities. The gross profit and net profit of Lovisa is more as compare to Dulux Group
Limited in terms of percentage. It depicts that the cost of production of Dulux is high due to
which the gross profit is reduces.
Paraphrase This Document
Need a fresh take? Get an instant paraphrase of this document with our AI Paraphraser

ACCOUNTING 4
Recommendations
From the above analysis, it is recommending that the financial position of both the companies is
good. But by comparing the financial data, Lovisa is less applicable as compare to the Dulux
Group Limited. It has been founded that the Dulux have more assets due to which it is highly
able to cover its all liabilities. But as compare to the profit margin, Lovisa has more profit as
compare to Dulux. It is suggesting that the investors has to invest in Lovisa Limited to gets the
good return.

ACCOUNTING 5
References
Accounting Tools. (2018). Comparability. Retrieved From:
https://www.accountingtools.com/articles/2017/5/5/comparability
Duluxgroup. (2018). About Us. Retrieved From: http://www.duluxgroup.com.au/about-us
IBIS World. (2018). Lovisa Holdings Limited - Profile Company Report Australia. Retrieved
From: https://www.ibisworld.com.au/australian-company-research-reports/retail-trade/lovisa-
holdings-limited-company.html
Robinson, T. R., Henry, E., Pirie, W. L., & Broihahn, M. A. (2015). International financial
statement analysis. John Wiley & Sons.
Williams, E. E., & Dobelman, J. A. (2017). Financial statement analysis. World Scientific Book
Chapters, 109-169.
Zainudin, E. F., & Hashim, H. A. (2016). Detecting fraudulent financial reporting using financial
ratio. Journal of Financial Reporting and Accounting, 14(2), 266-278.
1.
⊘ This is a preview!⊘
Do you want full access?
Subscribe today to unlock all pages.

Trusted by 1+ million students worldwide

ACCOUNTING 6
Appendix
Ratio Analysis
Profitability Ratios:
2016 2017 2018
Return on Equity
Profit avail to owners / 129,061,000 139,661,000 148,126,000
Average Equity 533,864,000 568,888,000 627,532,500
Answer: % 24.17% 24.55% 23.60%
Return on Assets:
Net profit (loss) /
129,061,000.
00
139,661,000.
00
148,126,000.
00
Average total assets %
1,097,103,50
0
1,228,951,50
0
1,293,793,00
0
11.76% 11.36% 11.45%
Profit Margin
Net profit (loss) / 129,061,000 139,661,000 148,529,000
Sales Revenue (note used operating
revenue)
1,716,259,00
0
1,784,468,00
0
1,843,714,00
0
Answer: % 7.52% 7.83% 8.06%
Gross Profit Margin
Gross profit / 230,650,000. 241,265,000. 236,083,000.
Paraphrase This Document
Need a fresh take? Get an instant paraphrase of this document with our AI Paraphraser

ACCOUNTING 7
00 00 00
Sales Revenue (note used operating
revenue)
1,716,259,00
0.00
1,784,468,00
0.00
1,843,714,00
0.00
Answer: % 13.44% 13.52% 12.80%
Cash Flow to Sales Ratio
Cash Flow from Operating
Activities/
144,914,000.
00
165,970,000.
00
140,230,000.
00
Sales Revenue (note used operating
revenue) %
1,716,259,00
0.00
1,784,468,00
0.00
1,843,714,00
0.00
Answer: 8.44% 9.30% 7.61%
Asset Efficiency Ratios
2016 2017 2018
Asset Turnover Ratio
Sales Revenue / (note used operating
revenue)
1,716,259,00
0
1,784,468,00
0
1,843,714,00
0
Average Total Assets
1,757,010,00
0
1,826,852,50
0
1,924,843,50
0
Answer: 0.98 0.98 0.96
Inventory Turnover (days)
Average Inventory / 325,472,500 333,570,000 351,367,500
Cost of Sales 958,755 726,836,000 769,900,000
Answer: (note the above needs to be # days 123908.05 167.51 166.58

ACCOUNTING 8
x 365)
Inventory Turnover (times p.a)
Cost of Sales / 958,755 726,836,000 769,900,000
Average Inventory 325,472,500 333,570,000 351,367,500
Answer
times
p.a 0.00 2.18 2.19
Receivables Turnover (days)
Average trade debtors / 21,102,000 21,189,000 22,267,500
Sales revenue (note used operating
revenue)
1,716,259,00
0
1,784,468,00
0
1,843,714,00
0
Answer: (note the above needs to be
x 365) # days 4.49 4.33 4.41
Receivables Turnover (times p.a)
Sales Revenue / (note used
operating revenue)
1,716,259,00
0
1,784,468,00
0
1,843,714,00
0
Average Trade Debtors 21,102,000 21,189,000 22,267,500
Answer
times
p.a 81.33 84.22 82.80
Liquidity Ratios
2016 2017 2018
Current Ratio
Current Assets / 522,705,000 563,319,000 601,743,000
⊘ This is a preview!⊘
Do you want full access?
Subscribe today to unlock all pages.

Trusted by 1+ million students worldwide

ACCOUNTING 9
Current liabilities 322,717,000 378,037,000 362,273,000
Answer: 1.62 1.49 1.66
Quick Asset Ratio
Current Assets - Inventory / 303,832,000 333,925,000 357,796,000
Current Liabilities 322,717,000 378,037,000 362,273,000
Answer: 0.94 0.88 0.99
Cash Flow Ratio
Net Cash Flows from Operating
Activities / 144,914,000 165,970,000 140,230,000
Current Liabilities 322,717,000 378,037,000 362,273,000
Answer: 0.45 0.44 0.39
Capital Structure Ratios
2016 2017 2018
Debt to Equity ratio
Total liabilities / 830,564,000 854,801,000 885,020,000
Total Equity 365,238,000 407,300,000 440,465,000
Answer: % 227.40% 209.87% 200.93%
Debt Ratio (to assets)
Total Liabilities / 830,564,000 854,801,000 885,020,000
Total assets
1,195,802,00
0
1,262,101,00
0
1,325,485,00
0
Answer % 69.46% 67.73% 66.77%
Paraphrase This Document
Need a fresh take? Get an instant paraphrase of this document with our AI Paraphraser

ACCOUNTING 10
Equity Ratio
Total Equity /
365,238,000.
00
407,300,000.
00
440,465,000.
00
Total Assets
1,195,802,00
0.00
1,262,101,00
0.00
1,325,485,00
0.00
Answer: % 30.54% 32.27% 33.23%
Interest Coverage Ratio
EBIT /
201,109,000.
00
214,210,000.
00
222,791,000.
00
Net Finance Costs (used net interest
expense) 224,000.00 189,000.00 504,000.00
Answer:
times
p.a 897.81 1133.39 442.05
Debt Coverage Ratio
Non Current Liabilities /
507,847,000.
00
476,764,000.
00
522,747,000.
00
Net Cash Flow from Operating
Activities
144,914,000.
00
165,970,000.
00
140,230,000.
00
Answer:
times
p.a 3.50 2.87 3.73

ACCOUNTING 11
Common Size
Statement of Profit or Loss 2016 2017
Operating Revenue
153,461,000.0
0 100.00%
178,746,000.0
0 100.00%
Other Revenue 0.00 0.00
Total Revenue Excluding Interest
153,461,000.0
0 100.00%
178,746,000.0
0 100.00%
Operating Expenses
-
123,205,000.0
0 -80.28%
-
132,503,000.0
0 -74.13%
EBITDA 30,256,000.00 19.72% 46,243,000.00 25.87%
Depreciation -6,034,000.00 -3.93% -5,539,000.00 -3.10%
Amortization 0.00 0.00% 0.00 0.00%
Depreciation and Amortization -6,034,000.00 -3.93% -5,539,000.00 -3.10%
EBIT 24,222,000.00 15.78% 40,704,000.00 22.77%
Interest Revenue 49,000.00 0.03% 142,000.00 0.08%
Interest Expense -723,000.00 -0.47% -404,000.00 -0.23%
Net Interest Expense -674,000.00 -0.44% -262,000.00 -0.15%
PreTax Profit 23,548,000.00 15.34% 40,442,000.00 22.63%
Tax Expense -6,995,000.00 -4.56% -11,396,000.00 -6.38% -
Net Profit after Tax Before
Abnormals 30,598,000.00 19.94% 30,598,000.00 17.12%
Abnormals 0.00 0.00% 0.00 0.00%
Abnormals Tax 0.00 0.00% 0.00 0.00%
⊘ This is a preview!⊘
Do you want full access?
Subscribe today to unlock all pages.

Trusted by 1+ million students worldwide
1 out of 24
Related Documents
Your All-in-One AI-Powered Toolkit for Academic Success.
 +13062052269
info@desklib.com
Available 24*7 on WhatsApp / Email
Unlock your academic potential
Copyright © 2020–2025 A2Z Services. All Rights Reserved. Developed and managed by ZUCOL.


