Financial Analysis Report: A Comparative Study of Amazon and Alibaba
VerifiedAdded on 2022/10/15
|15
|3255
|109
Report
AI Summary
This report offers a comprehensive financial analysis comparing Amazon and Alibaba. It begins with a general overview of both companies, including their history, business segments, and main competitors. The core of the report focuses on a detailed ratio analysis, examining profitability, asset efficiency, short-term liquidity, and capital structure. The report provides calculations and comparisons of key financial ratios like net profit margin, return on equity, days inventory outstanding, current ratio, and debt-to-equity ratio, alongside industry benchmarks. Equity valuation is performed using the WACC method and a relative valuation model. The report also explores the business environment of both companies and discusses their future growth potential. Finally, a memorandum summarizing the key findings and recommendations is included. This report offers valuable insights into the financial health and comparative performance of Amazon and Alibaba.
Running head: FINANCIAL REPORTNG AND ANALYSIS
1
FINANCIAL REPORTNG AND ANALYSIS
1
FINANCIAL REPORTNG AND ANALYSIS
Paraphrase This Document
Need a fresh take? Get an instant paraphrase of this document with our AI Paraphraser
Running head: FINANCIAL REPORTNG AND ANALYSIS
Table of Contents
General Overview............................................................................................................................3
Main competitors.........................................................................................................................3
Business segment.........................................................................................................................3
Ratio Analysis..................................................................................................................................4
Profitability..................................................................................................................................4
Asset efficiency............................................................................................................................5
Short term liquidity......................................................................................................................6
Capital structure and solvency.....................................................................................................7
Calculation of Equity value.............................................................................................................7
Business environment......................................................................................................................8
Future growth...................................................................................................................................9
MEMORANDUM.........................................................................................................................10
References......................................................................................................................................13
Running head: FINANCIAL REPORTNG AND ANALYSIS
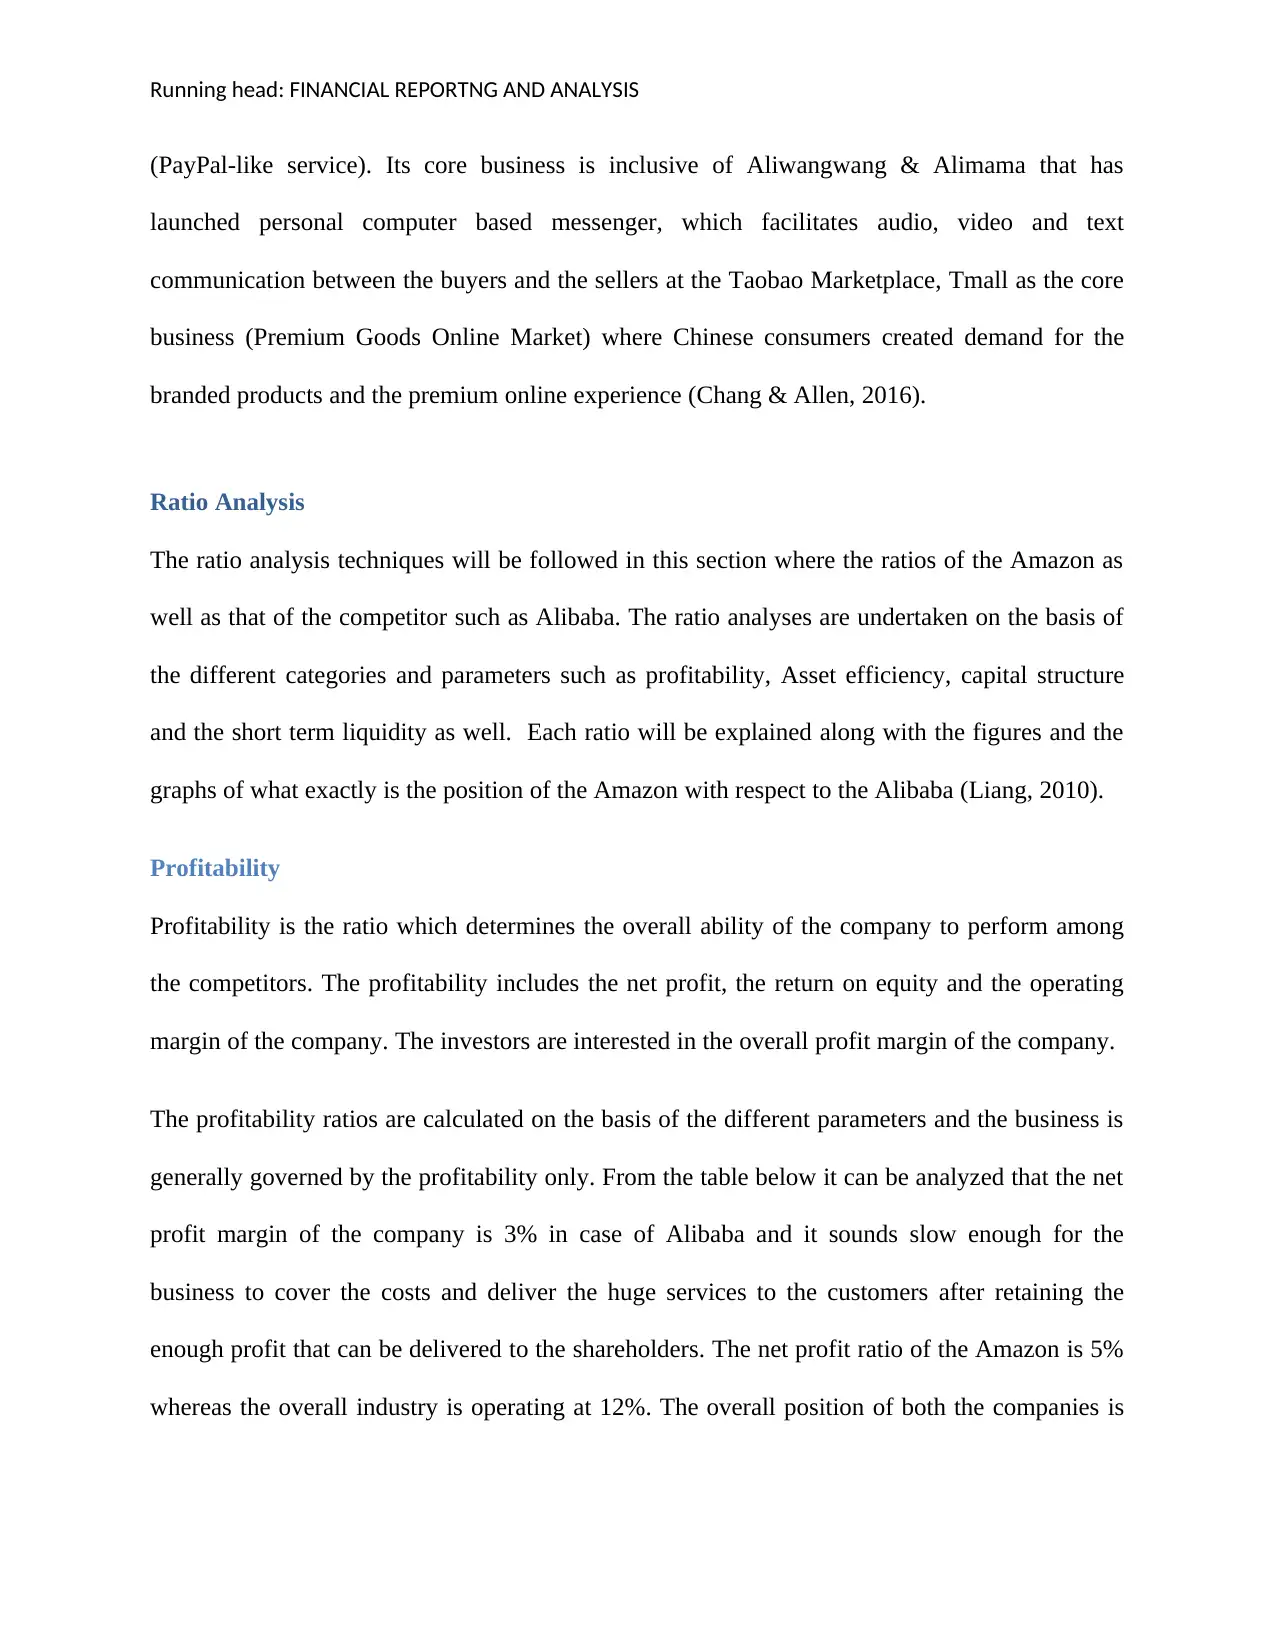
General Overview
Formerly the company was known as Cadabra and it was founded in the year 5th July 1994. The
company is serving the customers worldwide with the team of 647500 employees to serve.
Currently Jeff Bezos is the chairman, president as well as CEO of the company whereas Alibaba
Group holding limited is a Chinese multinational conglomerate holding organization specializing
in retail, e-commerce, technology, and retail. It will enable the organizations to transform the
way how it sell, operate and market its efficiencies. The company had highest amount of IPO
(initial public offering) at $25 billion (Amazon, 2018). In 2014, Alibaba`s market capital was
valued at US$ 231 billion and it increased to 352.28 billion dollars (Alibaba, 2018). The
company is among the biggest organizations in world. The valuation was marked as second
largest Asian company to break the record of US $500 billion (Krana shares, 2018).
Main competitors
The main competitors of the company are Ebay, Alibaba and Microsoft cloud services. The
detailed analysis of the competitors along with the figures will be provided in the table below.
Business segment
Amazon offers a wide range of the products as well as the services which is successfully
exploring more than one segment at the same time. In this segment a detail understanding of
what kinds of the business the company deals with. How much earnings the companies have
from the different categories. The business segment will be compared with that of the competitor
as well. The business segment of Alibaba includes Taobao.com established in 2003 as the free
platform for both buyers and sellers while discovering the products and establish a low cost
presence. In 2004, the company started to address the issues related to buyers and sellers
⊘ This is a preview!⊘
Do you want full access?
Subscribe today to unlock all pages.
Trusted by 1+ million students worldwide
Running head: FINANCIAL REPORTNG AND ANALYSIS
(PayPal-like service). Its core business is inclusive of Aliwangwang & Alimama that has
launched personal computer based messenger, which facilitates audio, video and text
communication between the buyers and the sellers at the Taobao Marketplace, Tmall as the core
business (Premium Goods Online Market) where Chinese consumers created demand for the
branded products and the premium online experience (Chang & Allen, 2016).
Ratio Analysis
The ratio analysis techniques will be followed in this section where the ratios of the Amazon as
well as that of the competitor such as Alibaba. The ratio analyses are undertaken on the basis of
the different categories and parameters such as profitability, Asset efficiency, capital structure
and the short term liquidity as well. Each ratio will be explained along with the figures and the
graphs of what exactly is the position of the Amazon with respect to the Alibaba (Liang, 2010).
Profitability
Profitability is the ratio which determines the overall ability of the company to perform among
the competitors. The profitability includes the net profit, the return on equity and the operating
margin of the company. The investors are interested in the overall profit margin of the company.
The profitability ratios are calculated on the basis of the different parameters and the business is
generally governed by the profitability only. From the table below it can be analyzed that the net
profit margin of the company is 3% in case of Alibaba and it sounds slow enough for the
business to cover the costs and deliver the huge services to the customers after retaining the
enough profit that can be delivered to the shareholders. The net profit ratio of the Amazon is 5%
whereas the overall industry is operating at 12%. The overall position of both the companies is
Paraphrase This Document
Need a fresh take? Get an instant paraphrase of this document with our AI Paraphraser
Running head: FINANCIAL REPORTNG AND ANALYSIS
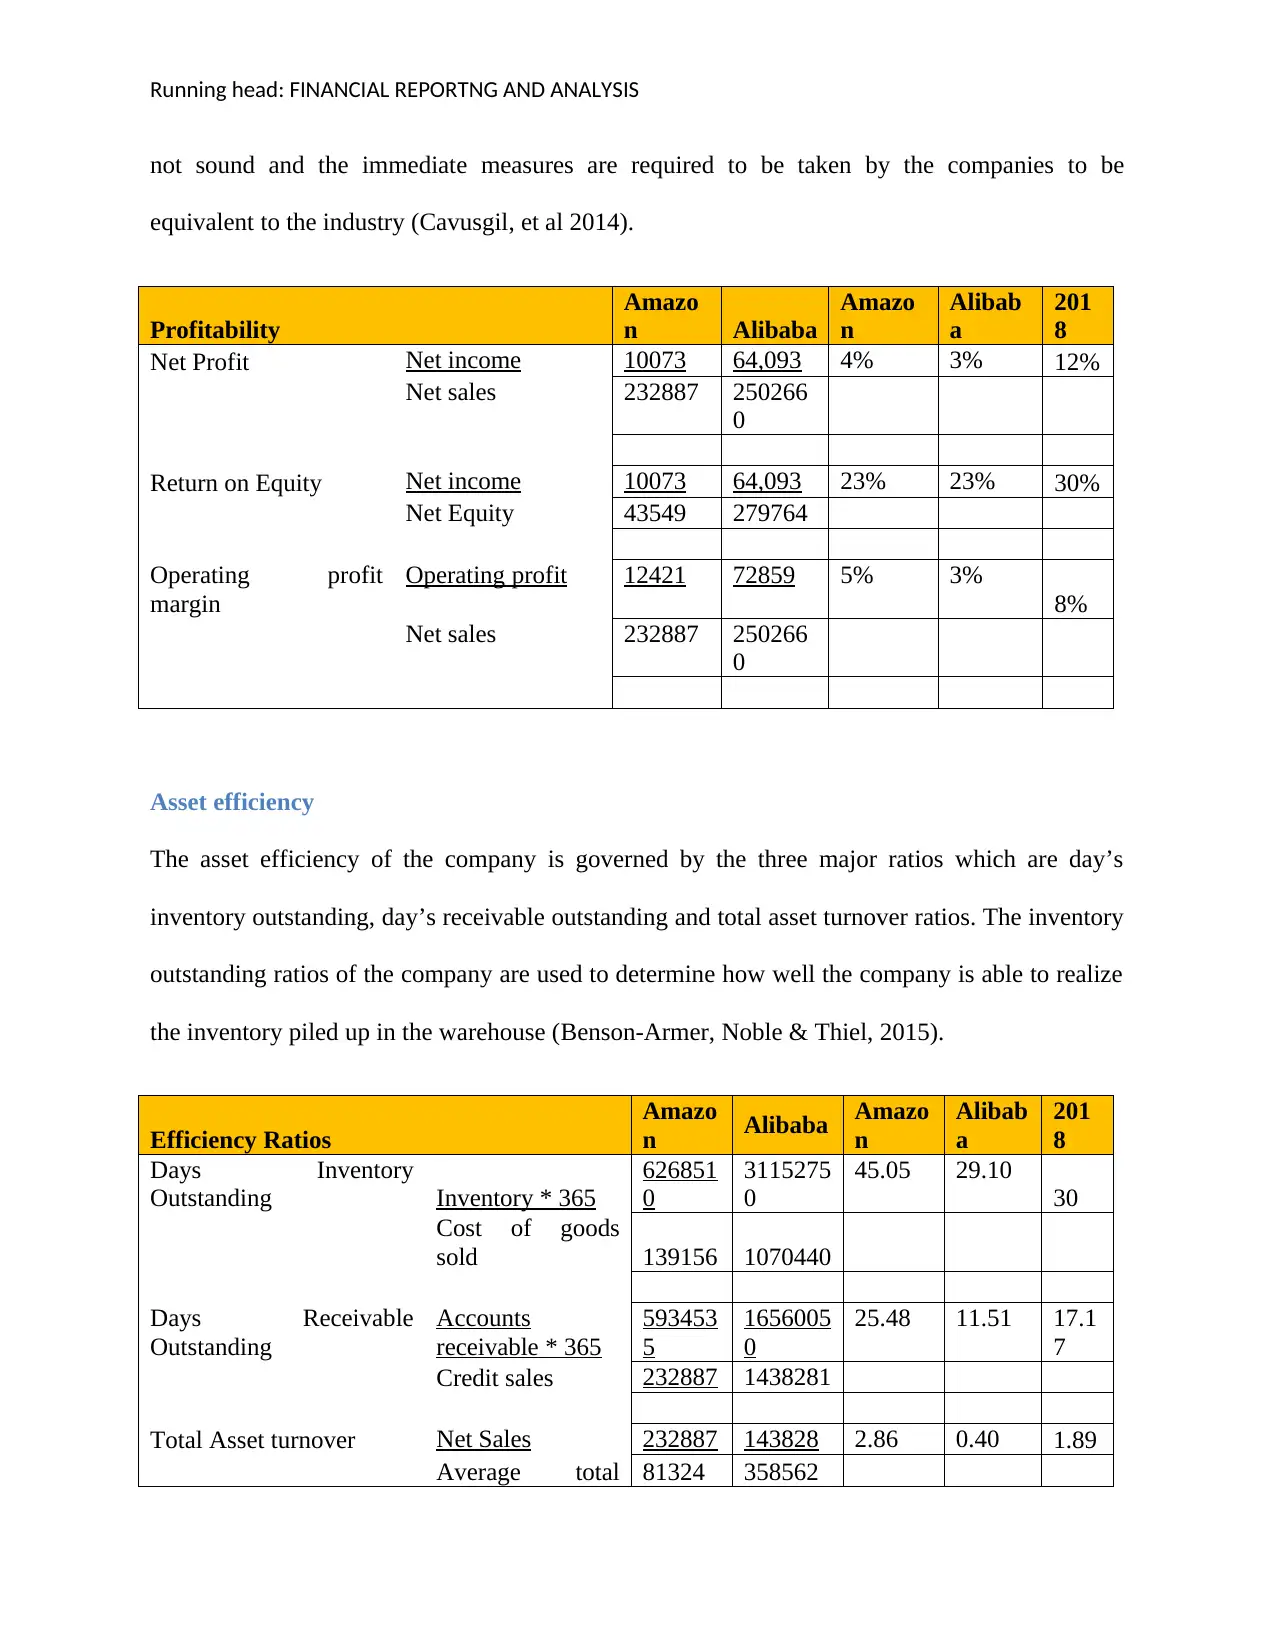
not sound and the immediate measures are required to be taken by the companies to be
equivalent to the industry (Cavusgil, et al 2014).
Profitability
Amazo
n Alibaba
Amazo
n
Alibab
a
201
8
Net Profit Net income 10073 64,093 4% 3% 12%
Net sales 232887 250266
0
Return on Equity Net income 10073 64,093 23% 23% 30%
Net Equity 43549 279764
Operating profit
margin
Operating profit 12421 72859 5% 3%
8%
Net sales 232887 250266
0
Asset efficiency
The asset efficiency of the company is governed by the three major ratios which are day’s
inventory outstanding, day’s receivable outstanding and total asset turnover ratios. The inventory
outstanding ratios of the company are used to determine how well the company is able to realize
the inventory piled up in the warehouse (Benson-Armer, Noble & Thiel, 2015).
Efficiency Ratios
Amazo
n Alibaba Amazo
n
Alibab
a
201
8
Days Inventory
Outstanding Inventory * 365
626851
0
3115275
0
45.05 29.10
30
Cost of goods
sold 139156 1070440
Days Receivable
Outstanding
Accounts
receivable * 365
593453
5
1656005
0
25.48 11.51 17.1
7
Credit sales 232887 1438281
Total Asset turnover Net Sales 232887 143828 2.86 0.40 1.89
Average total 81324 358562
Running head: FINANCIAL REPORTNG AND ANALYSIS
Assets
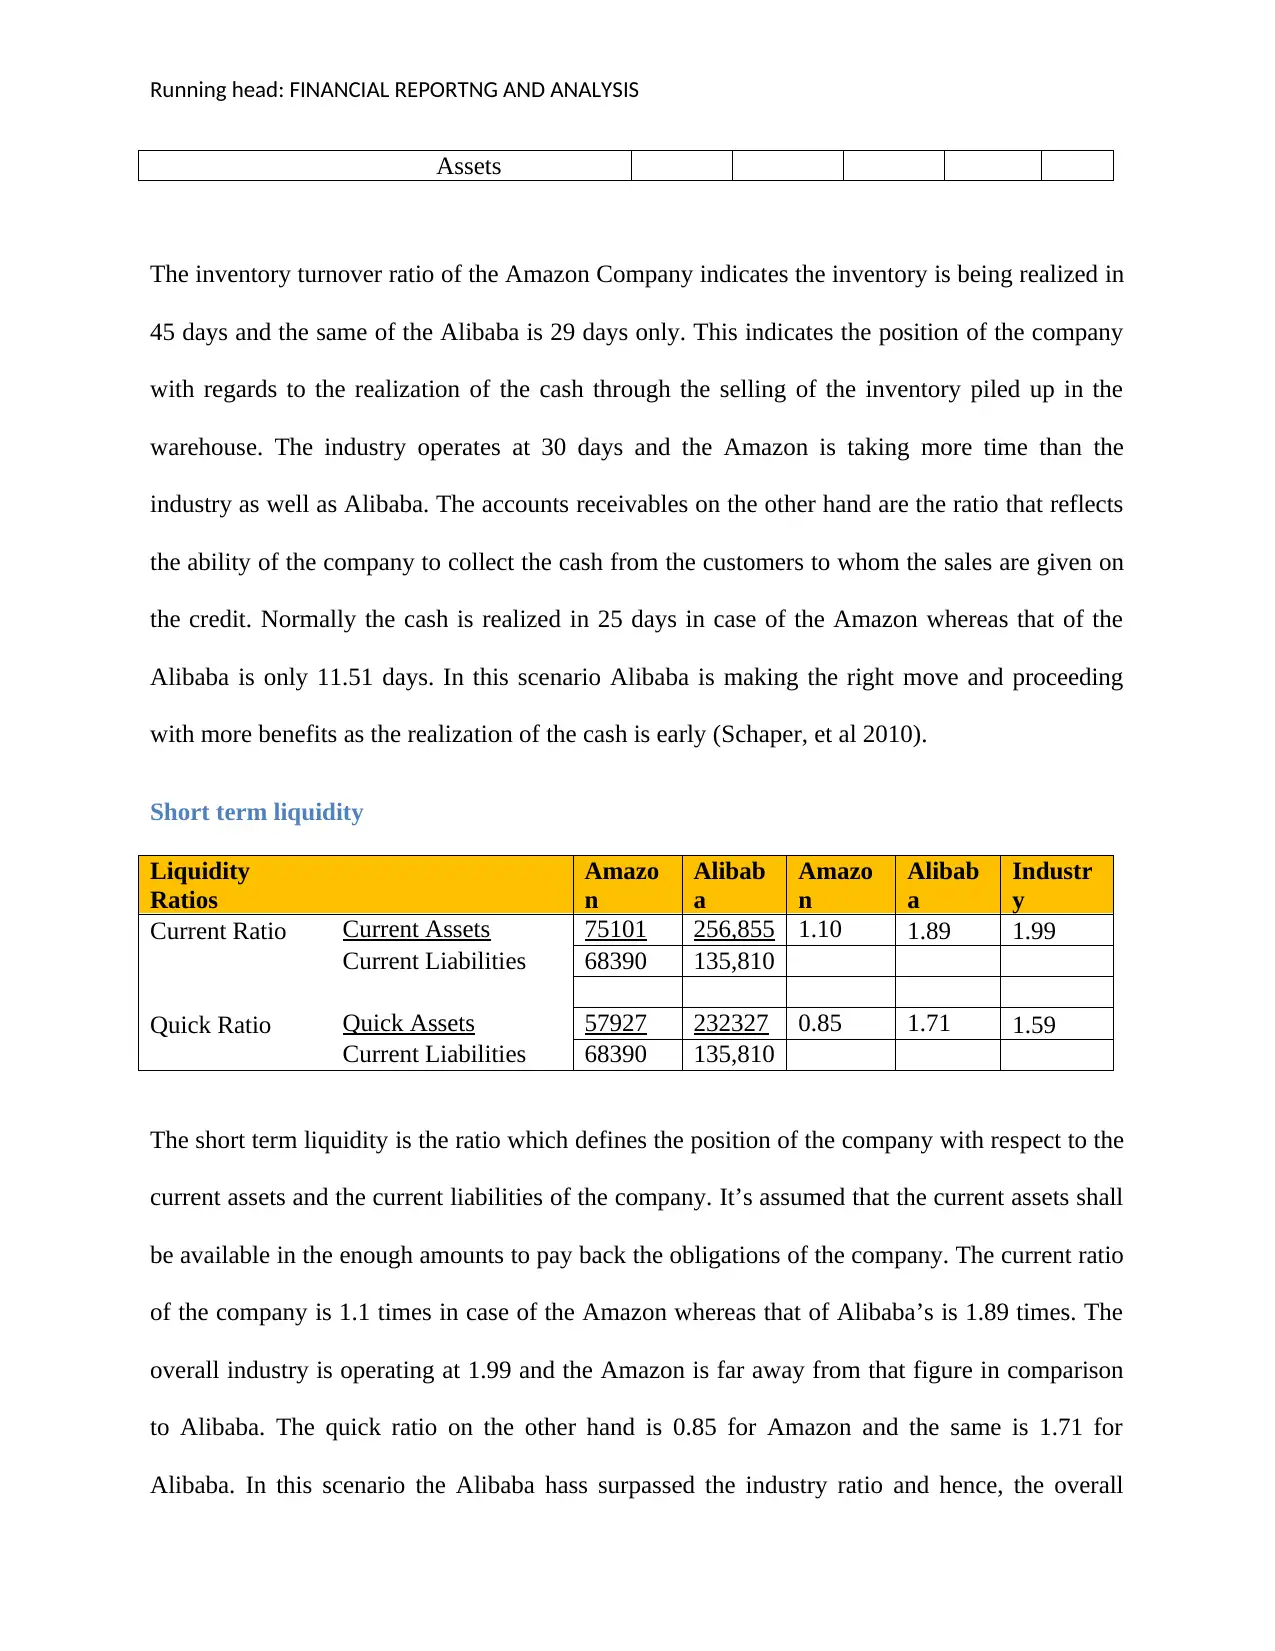
The inventory turnover ratio of the Amazon Company indicates the inventory is being realized in
45 days and the same of the Alibaba is 29 days only. This indicates the position of the company
with regards to the realization of the cash through the selling of the inventory piled up in the
warehouse. The industry operates at 30 days and the Amazon is taking more time than the
industry as well as Alibaba. The accounts receivables on the other hand are the ratio that reflects
the ability of the company to collect the cash from the customers to whom the sales are given on
the credit. Normally the cash is realized in 25 days in case of the Amazon whereas that of the
Alibaba is only 11.51 days. In this scenario Alibaba is making the right move and proceeding
with more benefits as the realization of the cash is early (Schaper, et al 2010).
Short term liquidity
Liquidity
Ratios
Amazo
n
Alibab
a
Amazo
n
Alibab
a
Industr
y
Current Ratio Current Assets 75101 256,855 1.10 1.89 1.99
Current Liabilities 68390 135,810
Quick Ratio Quick Assets 57927 232327 0.85 1.71 1.59
Current Liabilities 68390 135,810
The short term liquidity is the ratio which defines the position of the company with respect to the
current assets and the current liabilities of the company. It’s assumed that the current assets shall
be available in the enough amounts to pay back the obligations of the company. The current ratio
of the company is 1.1 times in case of the Amazon whereas that of Alibaba’s is 1.89 times. The
overall industry is operating at 1.99 and the Amazon is far away from that figure in comparison
to Alibaba. The quick ratio on the other hand is 0.85 for Amazon and the same is 1.71 for
Alibaba. In this scenario the Alibaba hass surpassed the industry ratio and hence, the overall
Assets
The inventory turnover ratio of the Amazon Company indicates the inventory is being realized in
45 days and the same of the Alibaba is 29 days only. This indicates the position of the company
with regards to the realization of the cash through the selling of the inventory piled up in the
warehouse. The industry operates at 30 days and the Amazon is taking more time than the
industry as well as Alibaba. The accounts receivables on the other hand are the ratio that reflects
the ability of the company to collect the cash from the customers to whom the sales are given on
the credit. Normally the cash is realized in 25 days in case of the Amazon whereas that of the
Alibaba is only 11.51 days. In this scenario Alibaba is making the right move and proceeding
with more benefits as the realization of the cash is early (Schaper, et al 2010).
Short term liquidity
Liquidity
Ratios
Amazo
n
Alibab
a
Amazo
n
Alibab
a
Industr
y
Current Ratio Current Assets 75101 256,855 1.10 1.89 1.99
Current Liabilities 68390 135,810
Quick Ratio Quick Assets 57927 232327 0.85 1.71 1.59
Current Liabilities 68390 135,810
The short term liquidity is the ratio which defines the position of the company with respect to the
current assets and the current liabilities of the company. It’s assumed that the current assets shall
be available in the enough amounts to pay back the obligations of the company. The current ratio
of the company is 1.1 times in case of the Amazon whereas that of Alibaba’s is 1.89 times. The
overall industry is operating at 1.99 and the Amazon is far away from that figure in comparison
to Alibaba. The quick ratio on the other hand is 0.85 for Amazon and the same is 1.71 for
Alibaba. In this scenario the Alibaba hass surpassed the industry ratio and hence, the overall
⊘ This is a preview!⊘
Do you want full access?
Subscribe today to unlock all pages.
Trusted by 1+ million students worldwide
Running head: FINANCIAL REPORTNG AND ANALYSIS
liquidity position of the Alibaba is sound and smooth in comparison to the Amazon. From the
point of view of the investor, Alibaba is the right choice for the company. The same can be
vouched with the help of the table (Sun, Kuang & Sun, 2016).
Capital structure and solvency
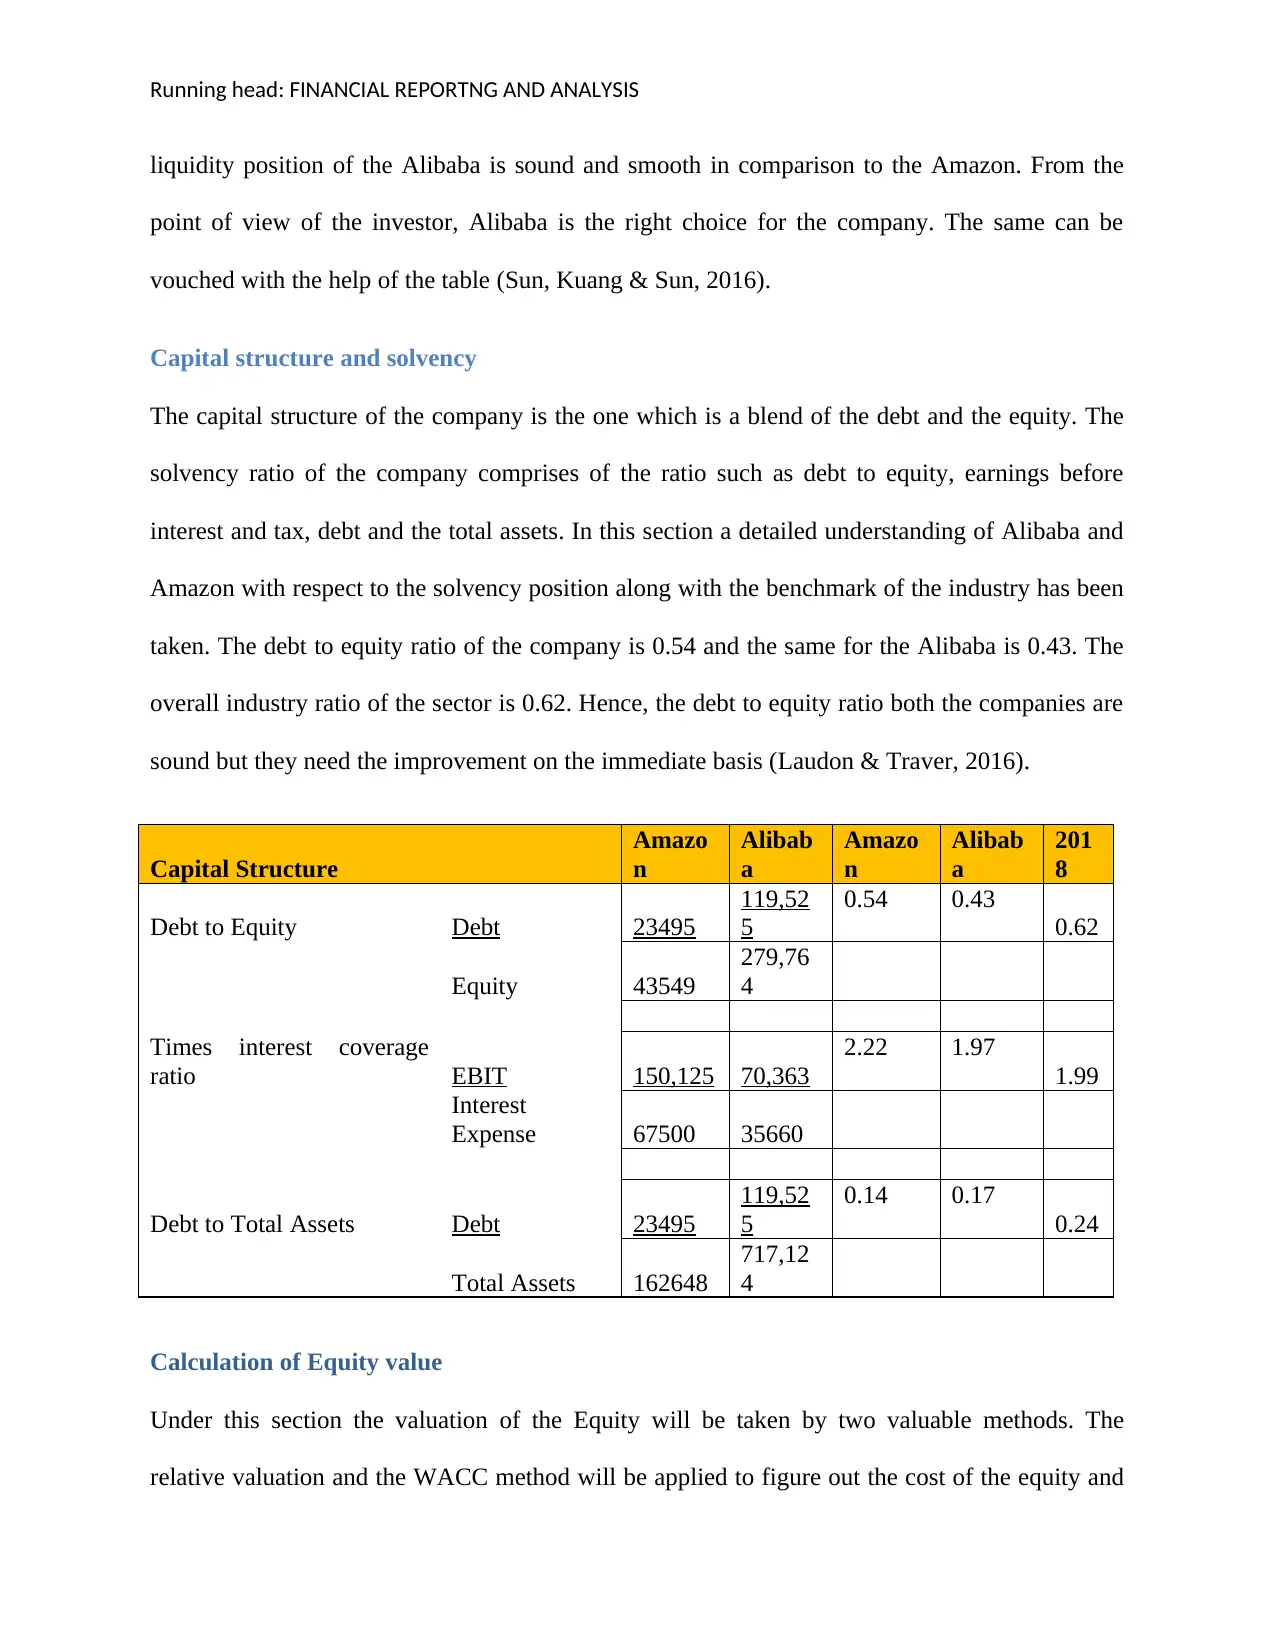
The capital structure of the company is the one which is a blend of the debt and the equity. The
solvency ratio of the company comprises of the ratio such as debt to equity, earnings before
interest and tax, debt and the total assets. In this section a detailed understanding of Alibaba and
Amazon with respect to the solvency position along with the benchmark of the industry has been
taken. The debt to equity ratio of the company is 0.54 and the same for the Alibaba is 0.43. The
overall industry ratio of the sector is 0.62. Hence, the debt to equity ratio both the companies are
sound but they need the improvement on the immediate basis (Laudon & Traver, 2016).
Capital Structure
Amazo
n
Alibab
a
Amazo
n
Alibab
a
201
8
Debt to Equity Debt 23495
119,52
5
0.54 0.43
0.62
Equity 43549
279,76
4
Times interest coverage
ratio EBIT 150,125 70,363
2.22 1.97
1.99
Interest
Expense 67500 35660
Debt to Total Assets Debt 23495
119,52
5
0.14 0.17
0.24
Total Assets 162648
717,12
4
Calculation of Equity value
Under this section the valuation of the Equity will be taken by two valuable methods. The
relative valuation and the WACC method will be applied to figure out the cost of the equity and
liquidity position of the Alibaba is sound and smooth in comparison to the Amazon. From the
point of view of the investor, Alibaba is the right choice for the company. The same can be
vouched with the help of the table (Sun, Kuang & Sun, 2016).
Capital structure and solvency
The capital structure of the company is the one which is a blend of the debt and the equity. The
solvency ratio of the company comprises of the ratio such as debt to equity, earnings before
interest and tax, debt and the total assets. In this section a detailed understanding of Alibaba and
Amazon with respect to the solvency position along with the benchmark of the industry has been
taken. The debt to equity ratio of the company is 0.54 and the same for the Alibaba is 0.43. The
overall industry ratio of the sector is 0.62. Hence, the debt to equity ratio both the companies are
sound but they need the improvement on the immediate basis (Laudon & Traver, 2016).
Capital Structure
Amazo
n
Alibab
a
Amazo
n
Alibab
a
201
8
Debt to Equity Debt 23495
119,52
5
0.54 0.43
0.62
Equity 43549
279,76
4
Times interest coverage
ratio EBIT 150,125 70,363
2.22 1.97
1.99
Interest
Expense 67500 35660
Debt to Total Assets Debt 23495
119,52
5
0.14 0.17
0.24
Total Assets 162648
717,12
4
Calculation of Equity value
Under this section the valuation of the Equity will be taken by two valuable methods. The
relative valuation and the WACC method will be applied to figure out the cost of the equity and
Paraphrase This Document
Need a fresh take? Get an instant paraphrase of this document with our AI Paraphraser
Running head: FINANCIAL REPORTNG AND ANALYSIS
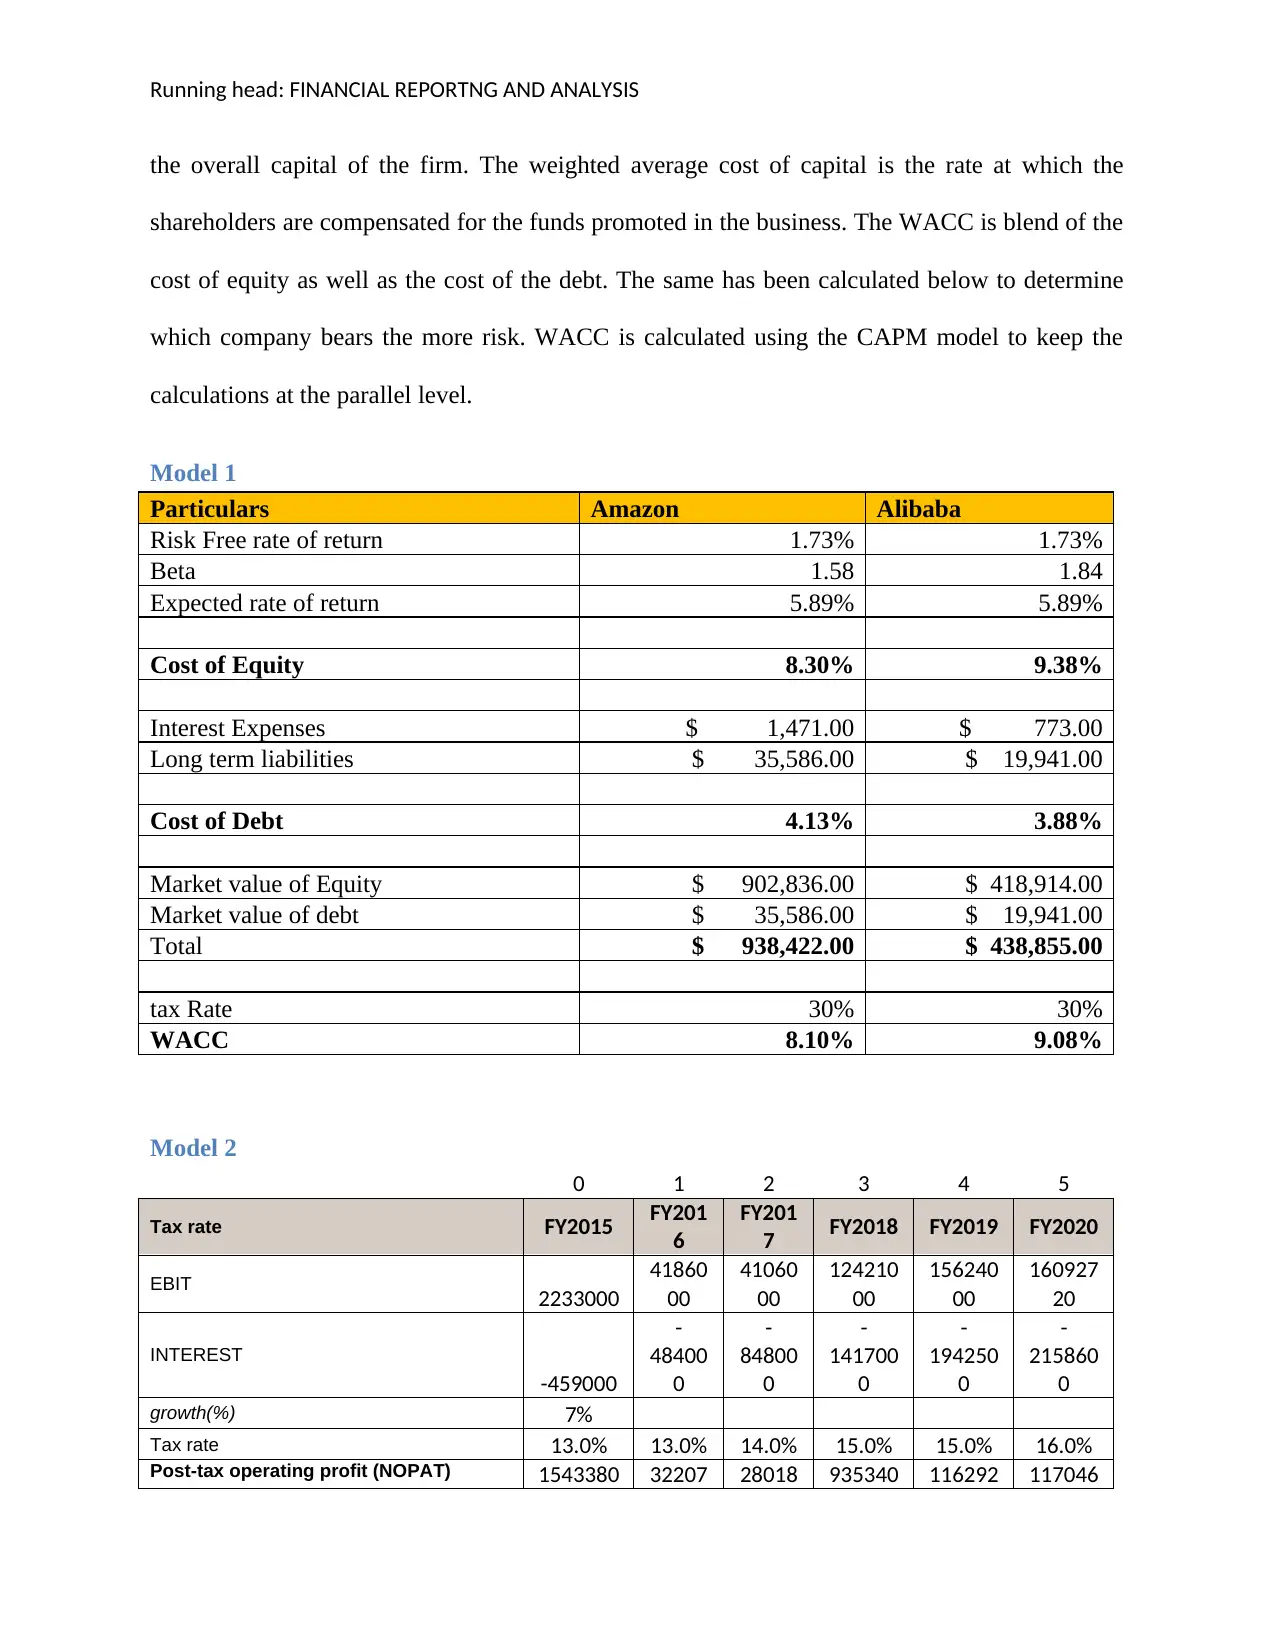
the overall capital of the firm. The weighted average cost of capital is the rate at which the
shareholders are compensated for the funds promoted in the business. The WACC is blend of the
cost of equity as well as the cost of the debt. The same has been calculated below to determine
which company bears the more risk. WACC is calculated using the CAPM model to keep the
calculations at the parallel level.
Model 1
Particulars Amazon Alibaba
Risk Free rate of return 1.73% 1.73%
Beta 1.58 1.84
Expected rate of return 5.89% 5.89%
Cost of Equity 8.30% 9.38%
Interest Expenses $ 1,471.00 $ 773.00
Long term liabilities $ 35,586.00 $ 19,941.00
Cost of Debt 4.13% 3.88%
Market value of Equity $ 902,836.00 $ 418,914.00
Market value of debt $ 35,586.00 $ 19,941.00
Total $ 938,422.00 $ 438,855.00
tax Rate 30% 30%
WACC 8.10% 9.08%
Model 2
0 1 2 3 4 5
Tax rate FY2015 FY201
6
FY201
7 FY2018 FY2019 FY2020
EBIT 2233000
41860
00
41060
00
124210
00
156240
00
160927
20
INTEREST
-459000
-
48400
0
-
84800
0
-
141700
0
-
194250
0
-
215860
0
growth(%) 7%
Tax rate 13.0% 13.0% 14.0% 15.0% 15.0% 16.0%
Post-tax operating profit (NOPAT) 1543380 32207 28018 935340 116292 117046
Running head: FINANCIAL REPORTNG AND ANALYSIS
40 80 0 75 61
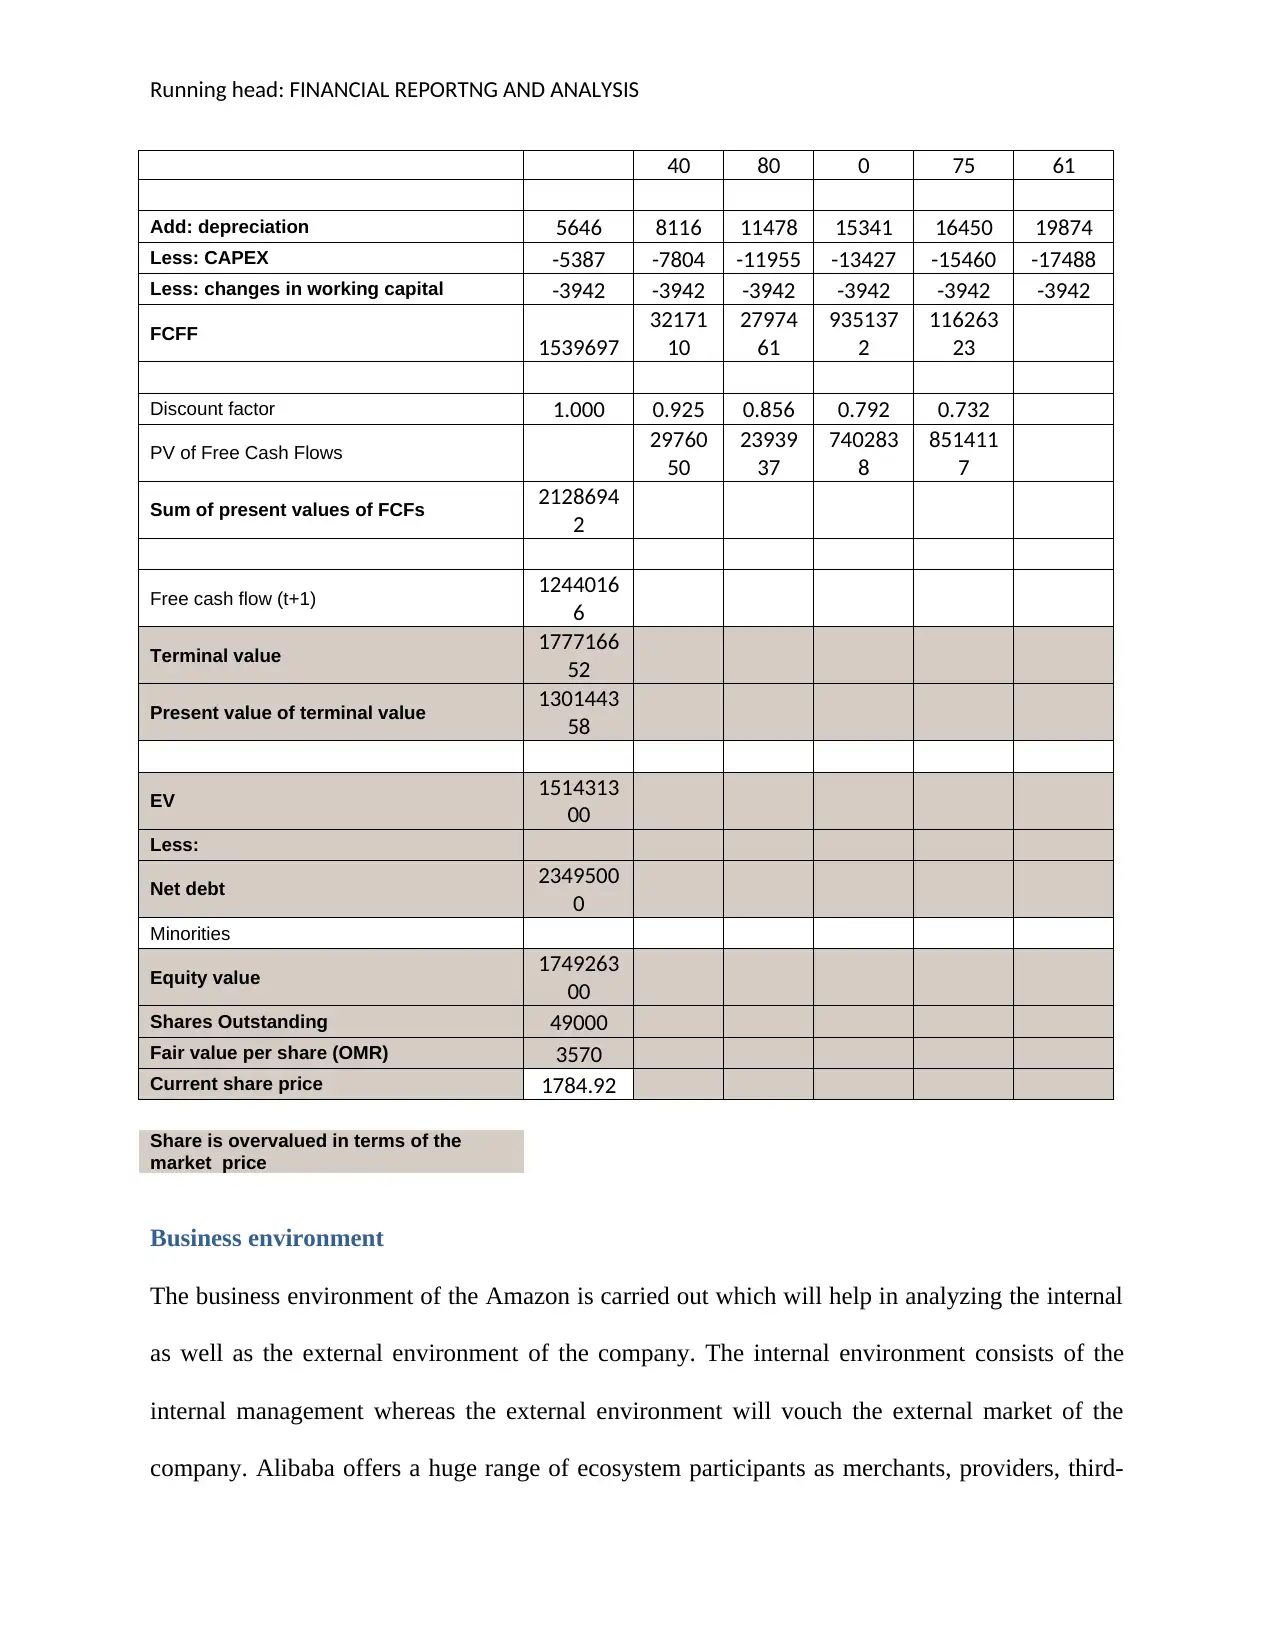
Add: depreciation 5646 8116 11478 15341 16450 19874
Less: CAPEX -5387 -7804 -11955 -13427 -15460 -17488
Less: changes in working capital -3942 -3942 -3942 -3942 -3942 -3942
FCFF 1539697
32171
10
27974
61
935137
2
116263
23
Discount factor 1.000 0.925 0.856 0.792 0.732
PV of Free Cash Flows 29760
50
23939
37
740283
8
851411
7
Sum of present values of FCFs 2128694
2
Free cash flow (t+1) 1244016
6
Terminal value 1777166
52
Present value of terminal value 1301443
58
EV 1514313
00
Less:
Net debt 2349500
0
Minorities
Equity value 1749263
00
Shares Outstanding 49000
Fair value per share (OMR) 3570
Current share price 1784.92
Share is overvalued in terms of the
market price
Business environment
The business environment of the Amazon is carried out which will help in analyzing the internal
as well as the external environment of the company. The internal environment consists of the
internal management whereas the external environment will vouch the external market of the
company. Alibaba offers a huge range of ecosystem participants as merchants, providers, third-
40 80 0 75 61
Add: depreciation 5646 8116 11478 15341 16450 19874
Less: CAPEX -5387 -7804 -11955 -13427 -15460 -17488
Less: changes in working capital -3942 -3942 -3942 -3942 -3942 -3942
FCFF 1539697
32171
10
27974
61
935137
2
116263
23
Discount factor 1.000 0.925 0.856 0.792 0.732
PV of Free Cash Flows 29760
50
23939
37
740283
8
851411
7
Sum of present values of FCFs 2128694
2
Free cash flow (t+1) 1244016
6
Terminal value 1777166
52
Present value of terminal value 1301443
58
EV 1514313
00
Less:
Net debt 2349500
0
Minorities
Equity value 1749263
00
Shares Outstanding 49000
Fair value per share (OMR) 3570
Current share price 1784.92
Share is overvalued in terms of the
market price
Business environment
The business environment of the Amazon is carried out which will help in analyzing the internal
as well as the external environment of the company. The internal environment consists of the
internal management whereas the external environment will vouch the external market of the
company. Alibaba offers a huge range of ecosystem participants as merchants, providers, third-
⊘ This is a preview!⊘
Do you want full access?
Subscribe today to unlock all pages.
Trusted by 1+ million students worldwide
Running head: FINANCIAL REPORTNG AND ANALYSIS
party services, and merchants. It avails services including financial products, data management,
scalable platforms and the logistics information platform (Globalfromasia, 2018). Taobao is one
of the most visited sites and it is worth more as compared to eBay, Amazon and Facebook The
situation in case of the Amazon is even more advanced and caters the need of the customers with
due diligence.
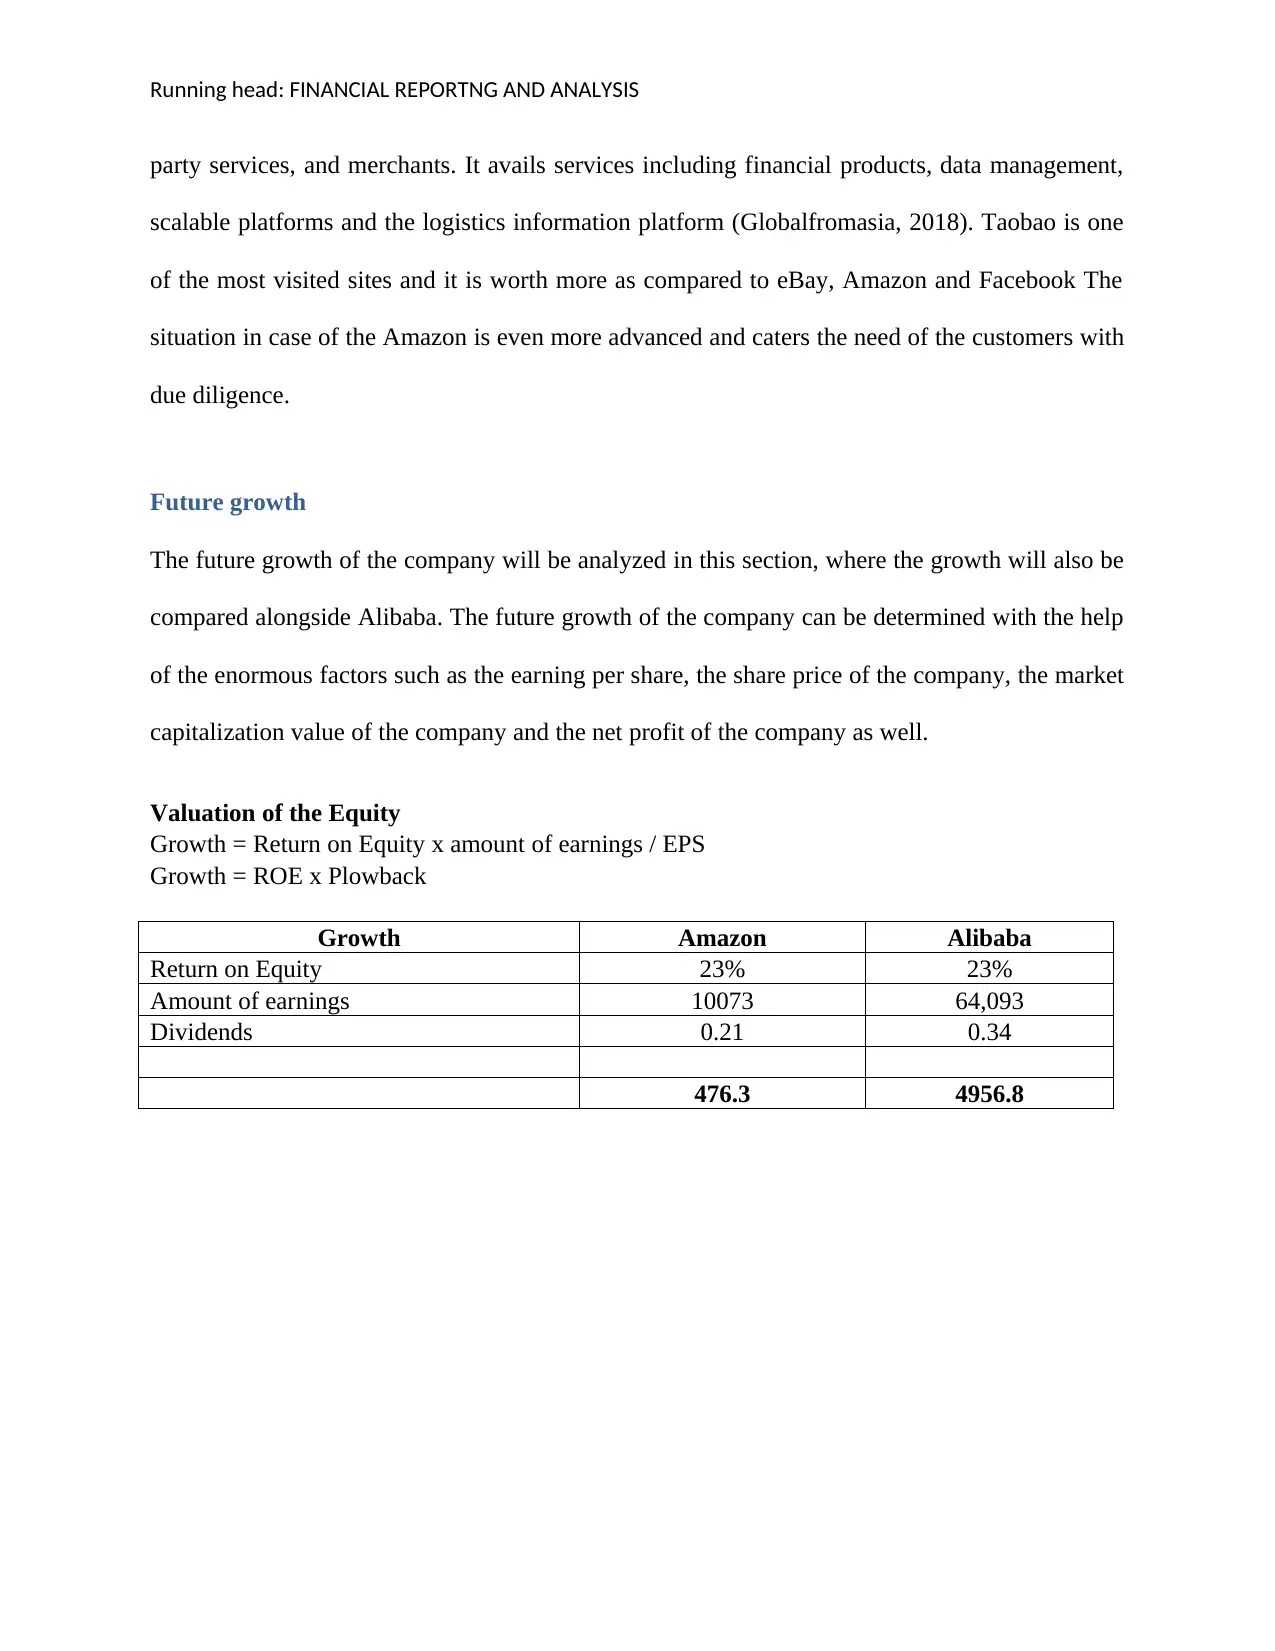
Future growth
The future growth of the company will be analyzed in this section, where the growth will also be
compared alongside Alibaba. The future growth of the company can be determined with the help
of the enormous factors such as the earning per share, the share price of the company, the market
capitalization value of the company and the net profit of the company as well.
Valuation of the Equity
Growth = Return on Equity x amount of earnings / EPS
Growth = ROE x Plowback
Growth Amazon Alibaba
Return on Equity 23% 23%
Amount of earnings 10073 64,093
Dividends 0.21 0.34
476.3 4956.8
party services, and merchants. It avails services including financial products, data management,
scalable platforms and the logistics information platform (Globalfromasia, 2018). Taobao is one
of the most visited sites and it is worth more as compared to eBay, Amazon and Facebook The
situation in case of the Amazon is even more advanced and caters the need of the customers with
due diligence.
Future growth
The future growth of the company will be analyzed in this section, where the growth will also be
compared alongside Alibaba. The future growth of the company can be determined with the help
of the enormous factors such as the earning per share, the share price of the company, the market
capitalization value of the company and the net profit of the company as well.
Valuation of the Equity
Growth = Return on Equity x amount of earnings / EPS
Growth = ROE x Plowback
Growth Amazon Alibaba
Return on Equity 23% 23%
Amount of earnings 10073 64,093
Dividends 0.21 0.34
476.3 4956.8
Paraphrase This Document
Need a fresh take? Get an instant paraphrase of this document with our AI Paraphraser
Running head: FINANCIAL REPORTNG AND ANALYSIS
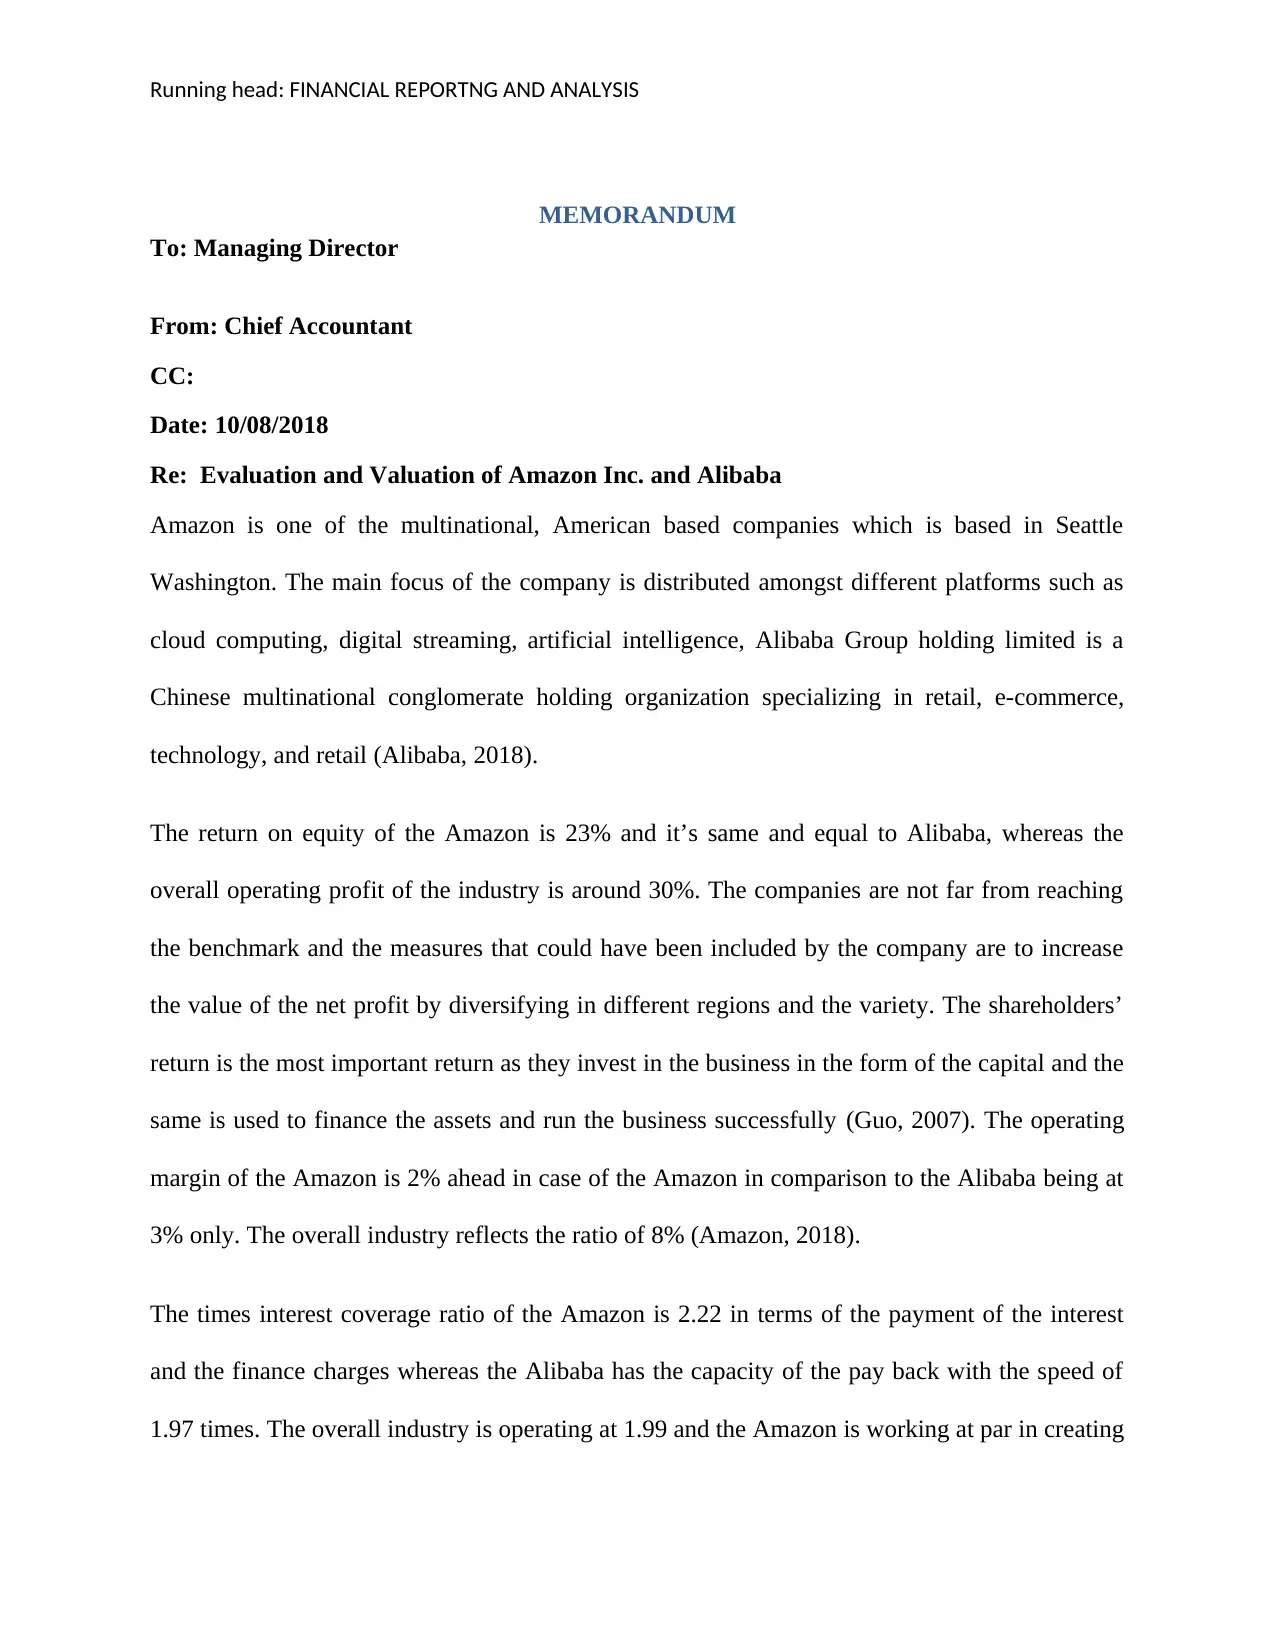
MEMORANDUM
To: Managing Director
From: Chief Accountant
CC:
Date: 10/08/2018
Re: Evaluation and Valuation of Amazon Inc. and Alibaba
Amazon is one of the multinational, American based companies which is based in Seattle
Washington. The main focus of the company is distributed amongst different platforms such as
cloud computing, digital streaming, artificial intelligence, Alibaba Group holding limited is a
Chinese multinational conglomerate holding organization specializing in retail, e-commerce,
technology, and retail (Alibaba, 2018).
The return on equity of the Amazon is 23% and it’s same and equal to Alibaba, whereas the
overall operating profit of the industry is around 30%. The companies are not far from reaching
the benchmark and the measures that could have been included by the company are to increase
the value of the net profit by diversifying in different regions and the variety. The shareholders’
return is the most important return as they invest in the business in the form of the capital and the
same is used to finance the assets and run the business successfully (Guo, 2007). The operating
margin of the Amazon is 2% ahead in case of the Amazon in comparison to the Alibaba being at
3% only. The overall industry reflects the ratio of 8% (Amazon, 2018).
The times interest coverage ratio of the Amazon is 2.22 in terms of the payment of the interest
and the finance charges whereas the Alibaba has the capacity of the pay back with the speed of
1.97 times. The overall industry is operating at 1.99 and the Amazon is working at par in creating
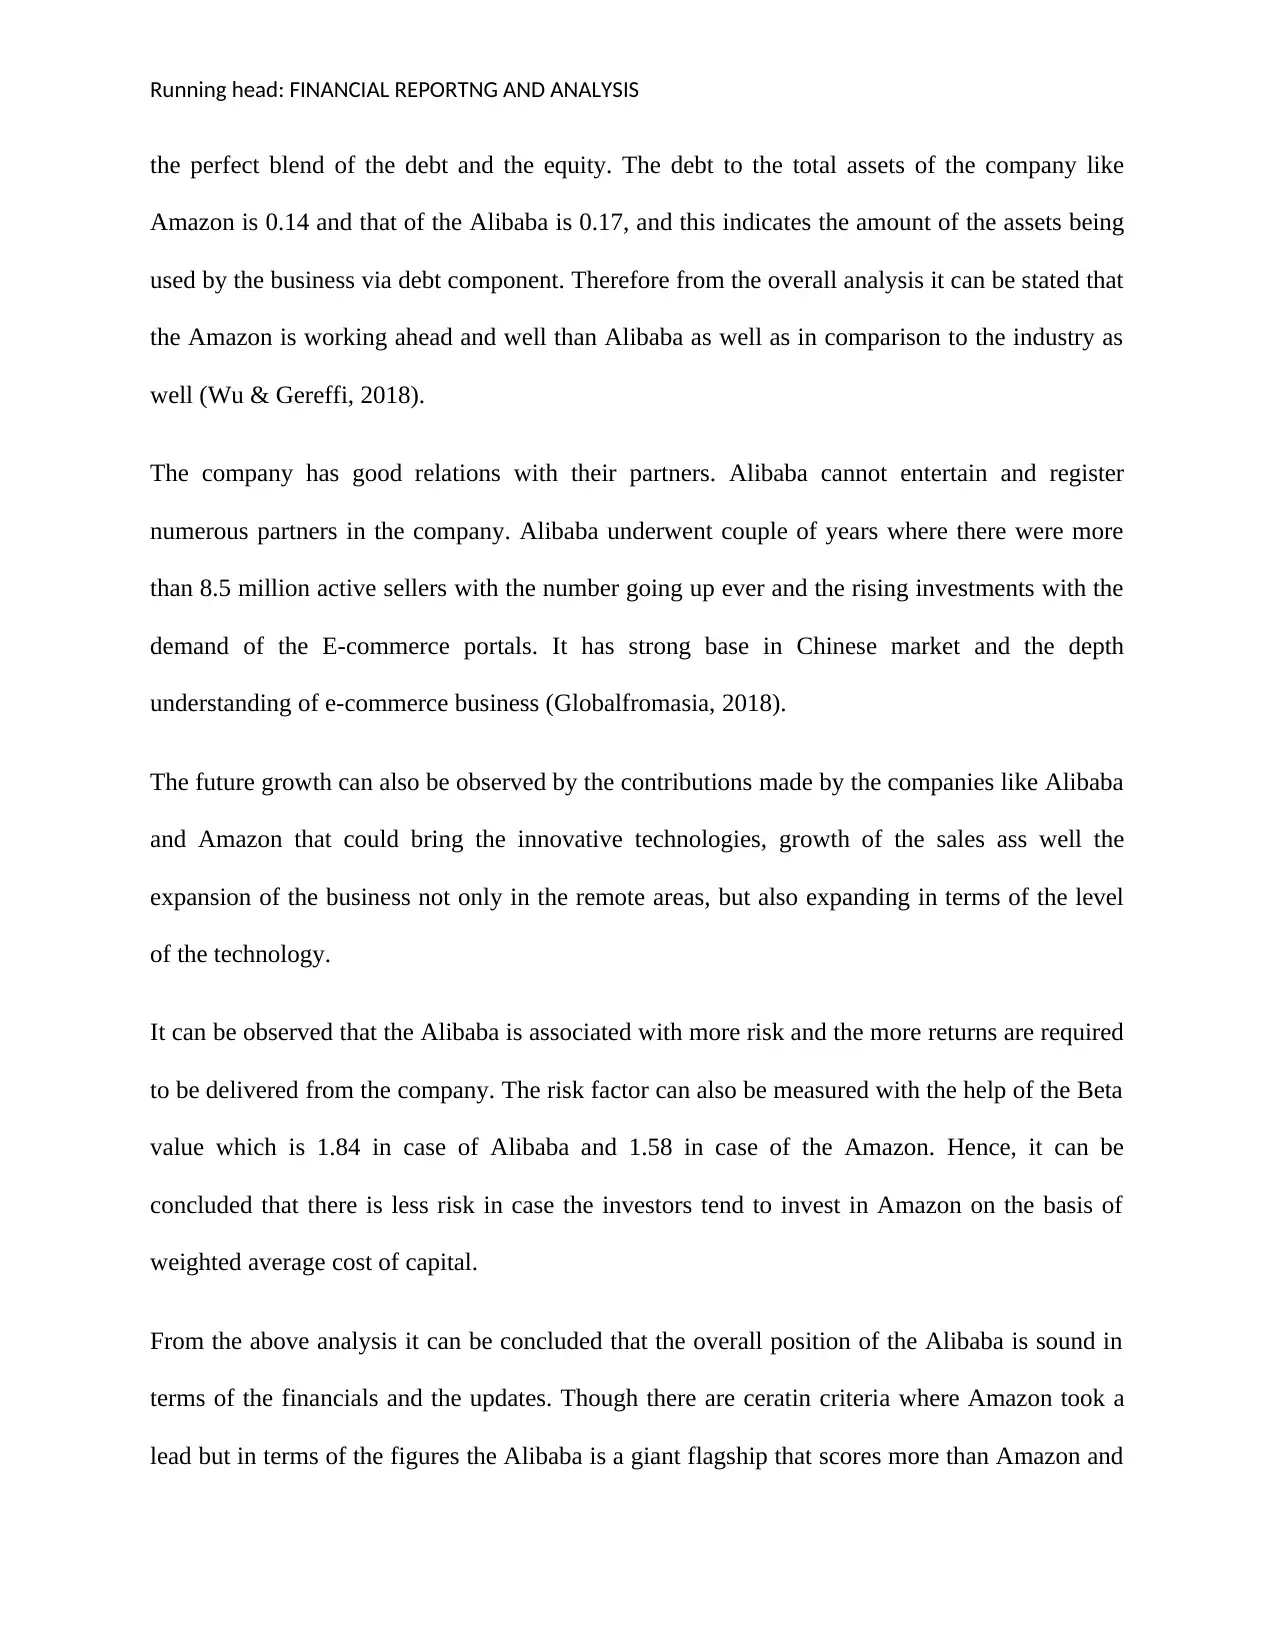
Running head: FINANCIAL REPORTNG AND ANALYSIS
the perfect blend of the debt and the equity. The debt to the total assets of the company like
Amazon is 0.14 and that of the Alibaba is 0.17, and this indicates the amount of the assets being
used by the business via debt component. Therefore from the overall analysis it can be stated that
the Amazon is working ahead and well than Alibaba as well as in comparison to the industry as
well (Wu & Gereffi, 2018).
The company has good relations with their partners. Alibaba cannot entertain and register
numerous partners in the company. Alibaba underwent couple of years where there were more
than 8.5 million active sellers with the number going up ever and the rising investments with the
demand of the E-commerce portals. It has strong base in Chinese market and the depth
understanding of e-commerce business (Globalfromasia, 2018).
The future growth can also be observed by the contributions made by the companies like Alibaba
and Amazon that could bring the innovative technologies, growth of the sales ass well the
expansion of the business not only in the remote areas, but also expanding in terms of the level
of the technology.
It can be observed that the Alibaba is associated with more risk and the more returns are required
to be delivered from the company. The risk factor can also be measured with the help of the Beta
value which is 1.84 in case of Alibaba and 1.58 in case of the Amazon. Hence, it can be
concluded that there is less risk in case the investors tend to invest in Amazon on the basis of
weighted average cost of capital.
From the above analysis it can be concluded that the overall position of the Alibaba is sound in
terms of the financials and the updates. Though there are ceratin criteria where Amazon took a
lead but in terms of the figures the Alibaba is a giant flagship that scores more than Amazon and
⊘ This is a preview!⊘
Do you want full access?
Subscribe today to unlock all pages.
Trusted by 1+ million students worldwide
1 out of 15
Related Documents


Your All-in-One AI-Powered Toolkit for Academic Success.
+13062052269
info@desklib.com
Available 24*7 on WhatsApp / Email
![[object Object]](/_next/static/media/star-bottom.7253800d.svg)
Unlock your academic potential
Copyright © 2020–2026 A2Z Services. All Rights Reserved. Developed and managed by ZUCOL.