Financial Analysis Report: Company Valuation and Comparison
VerifiedAdded on  2021/06/17
|22
|2960
|167
Report
AI Summary
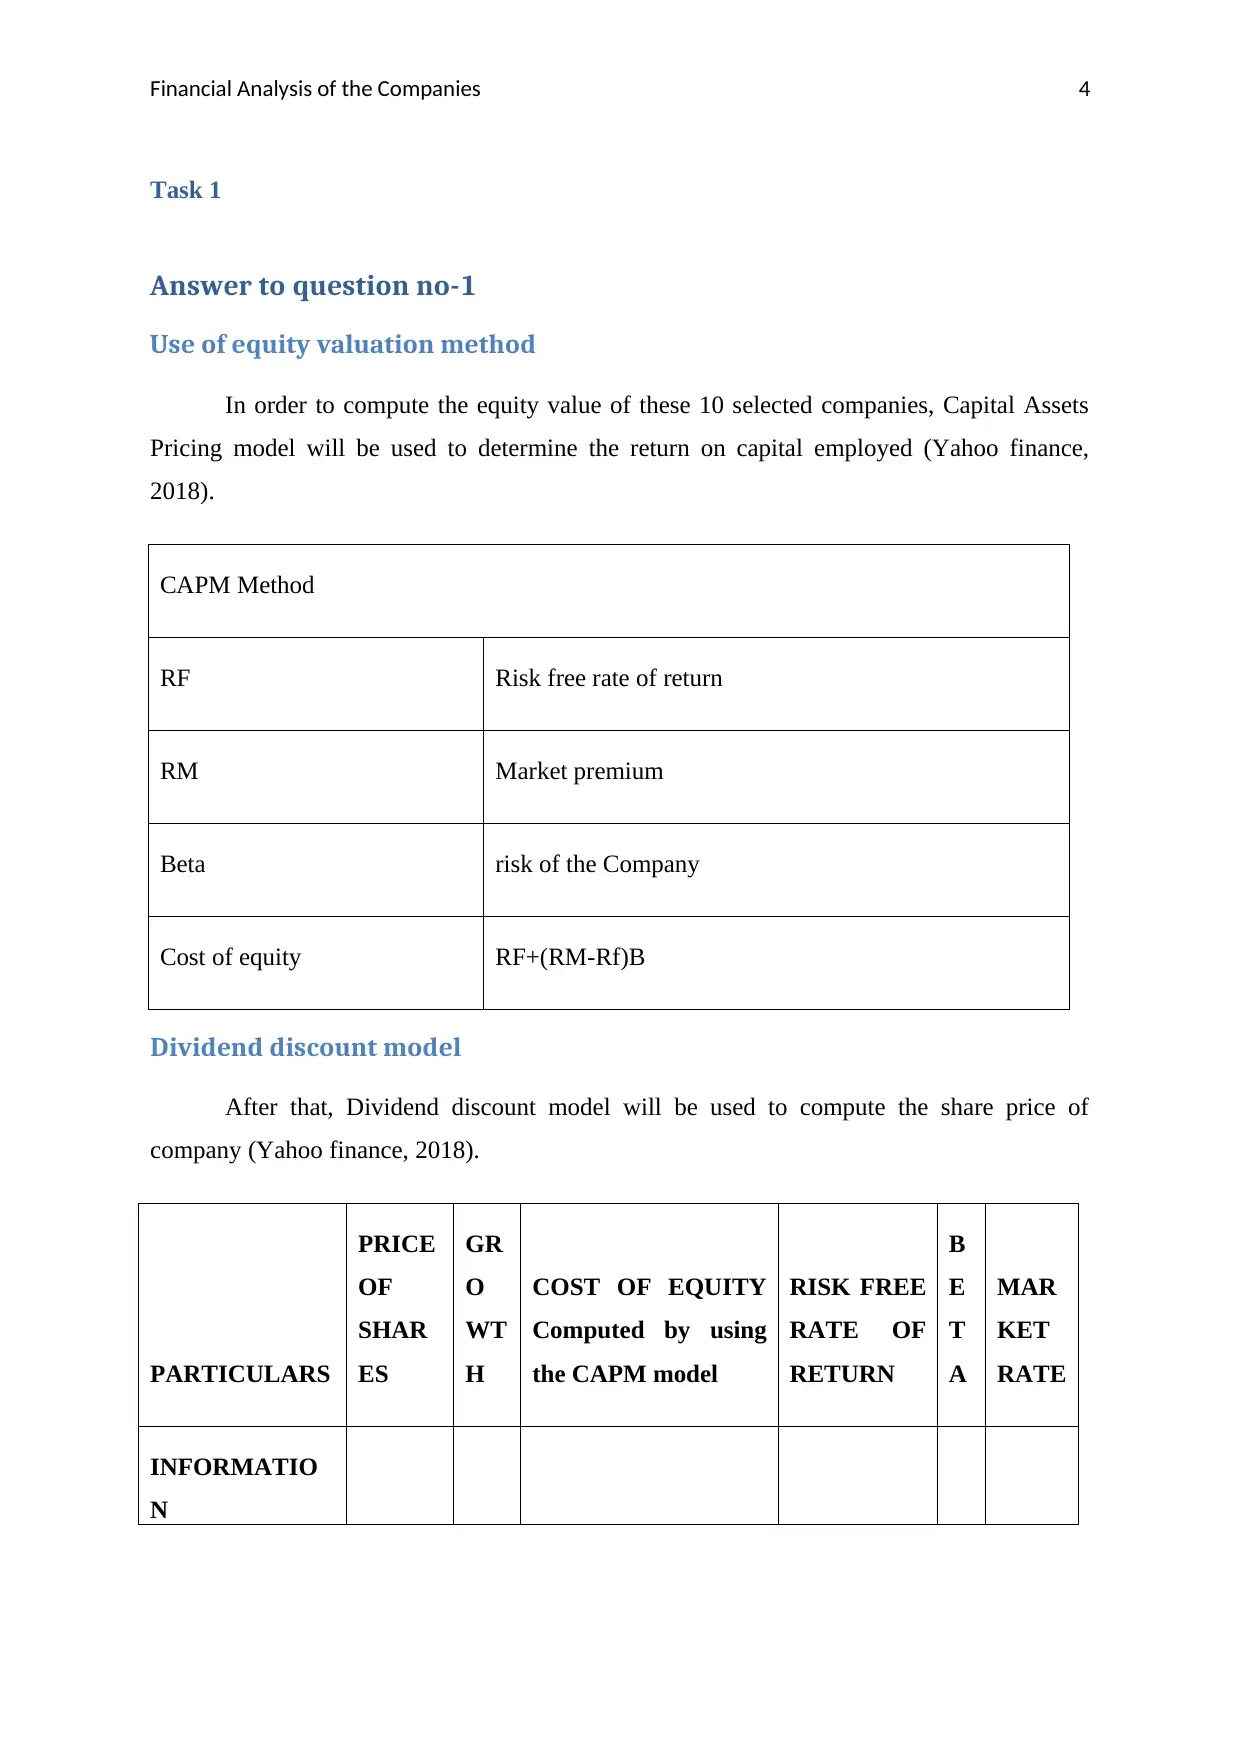
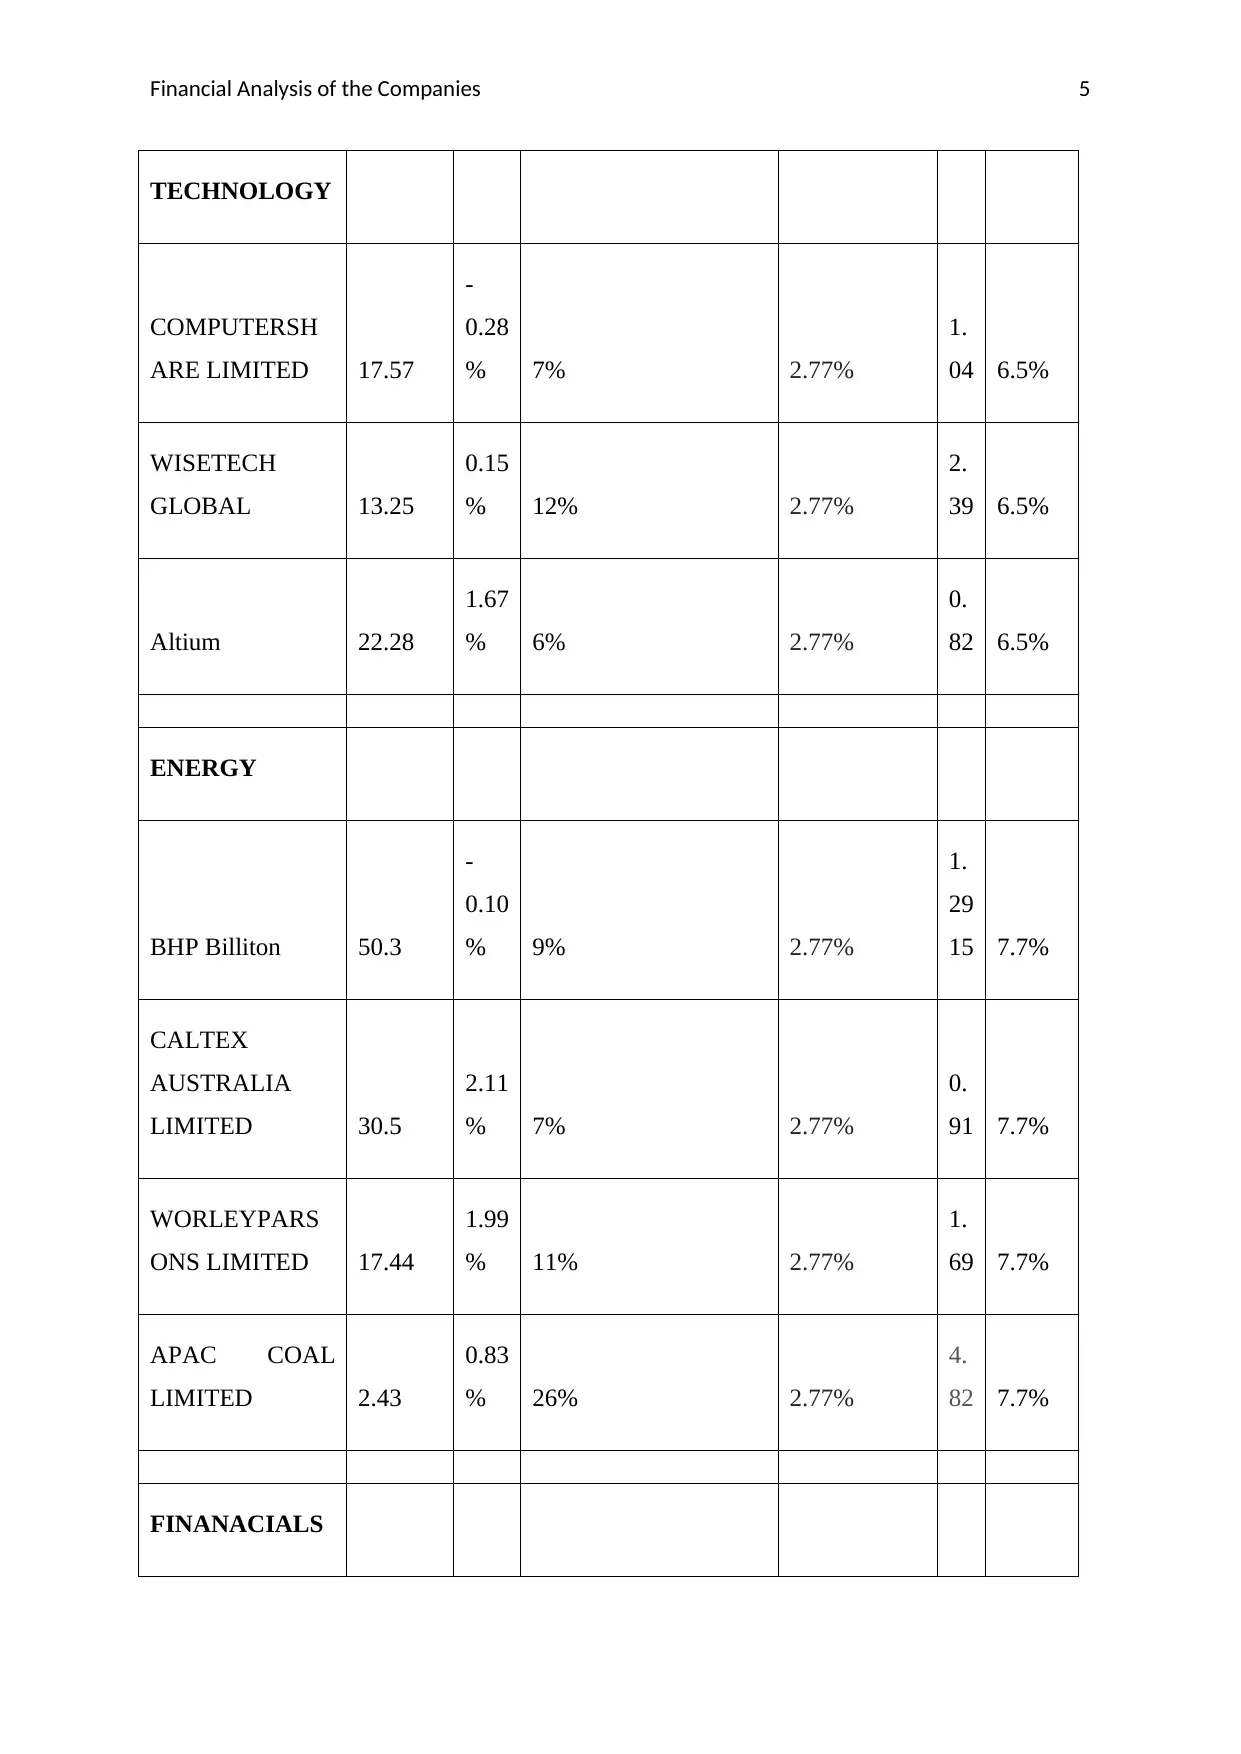
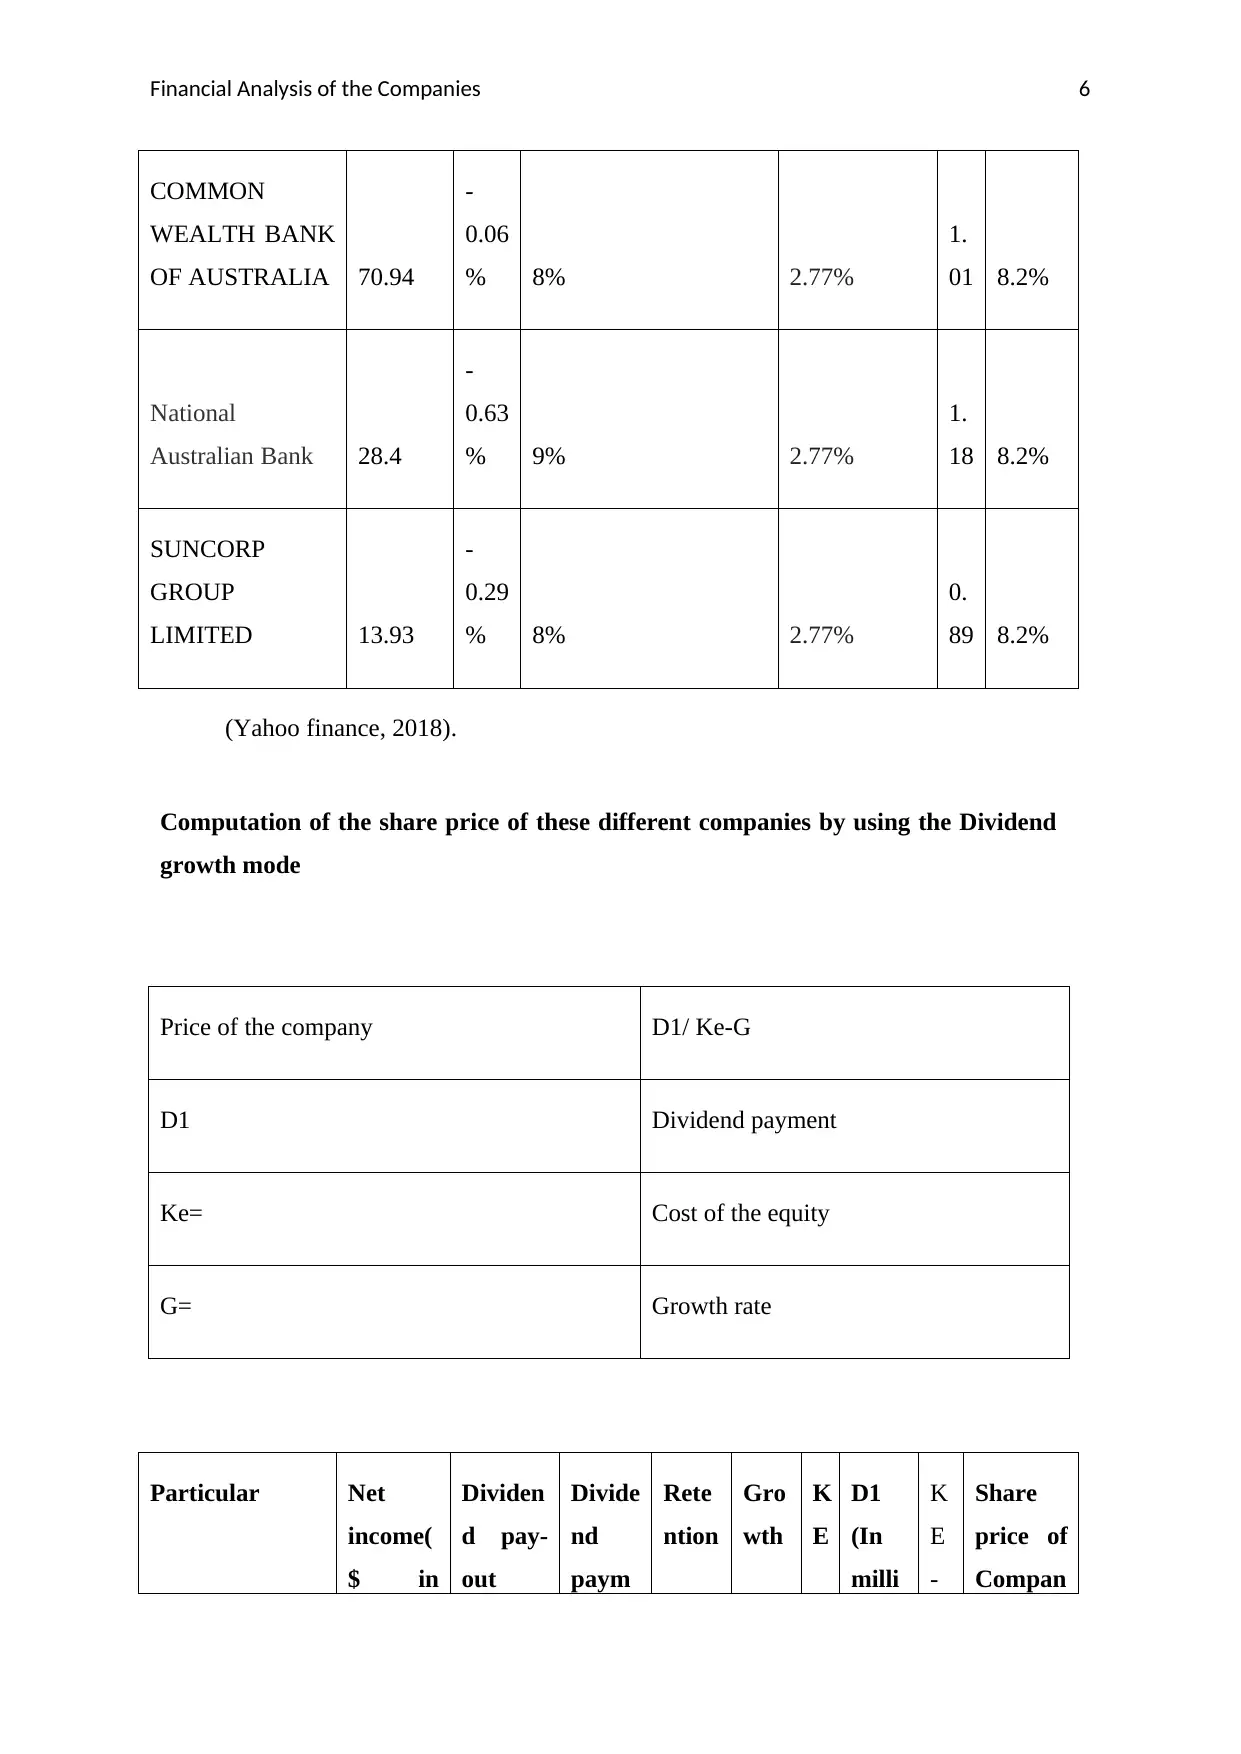
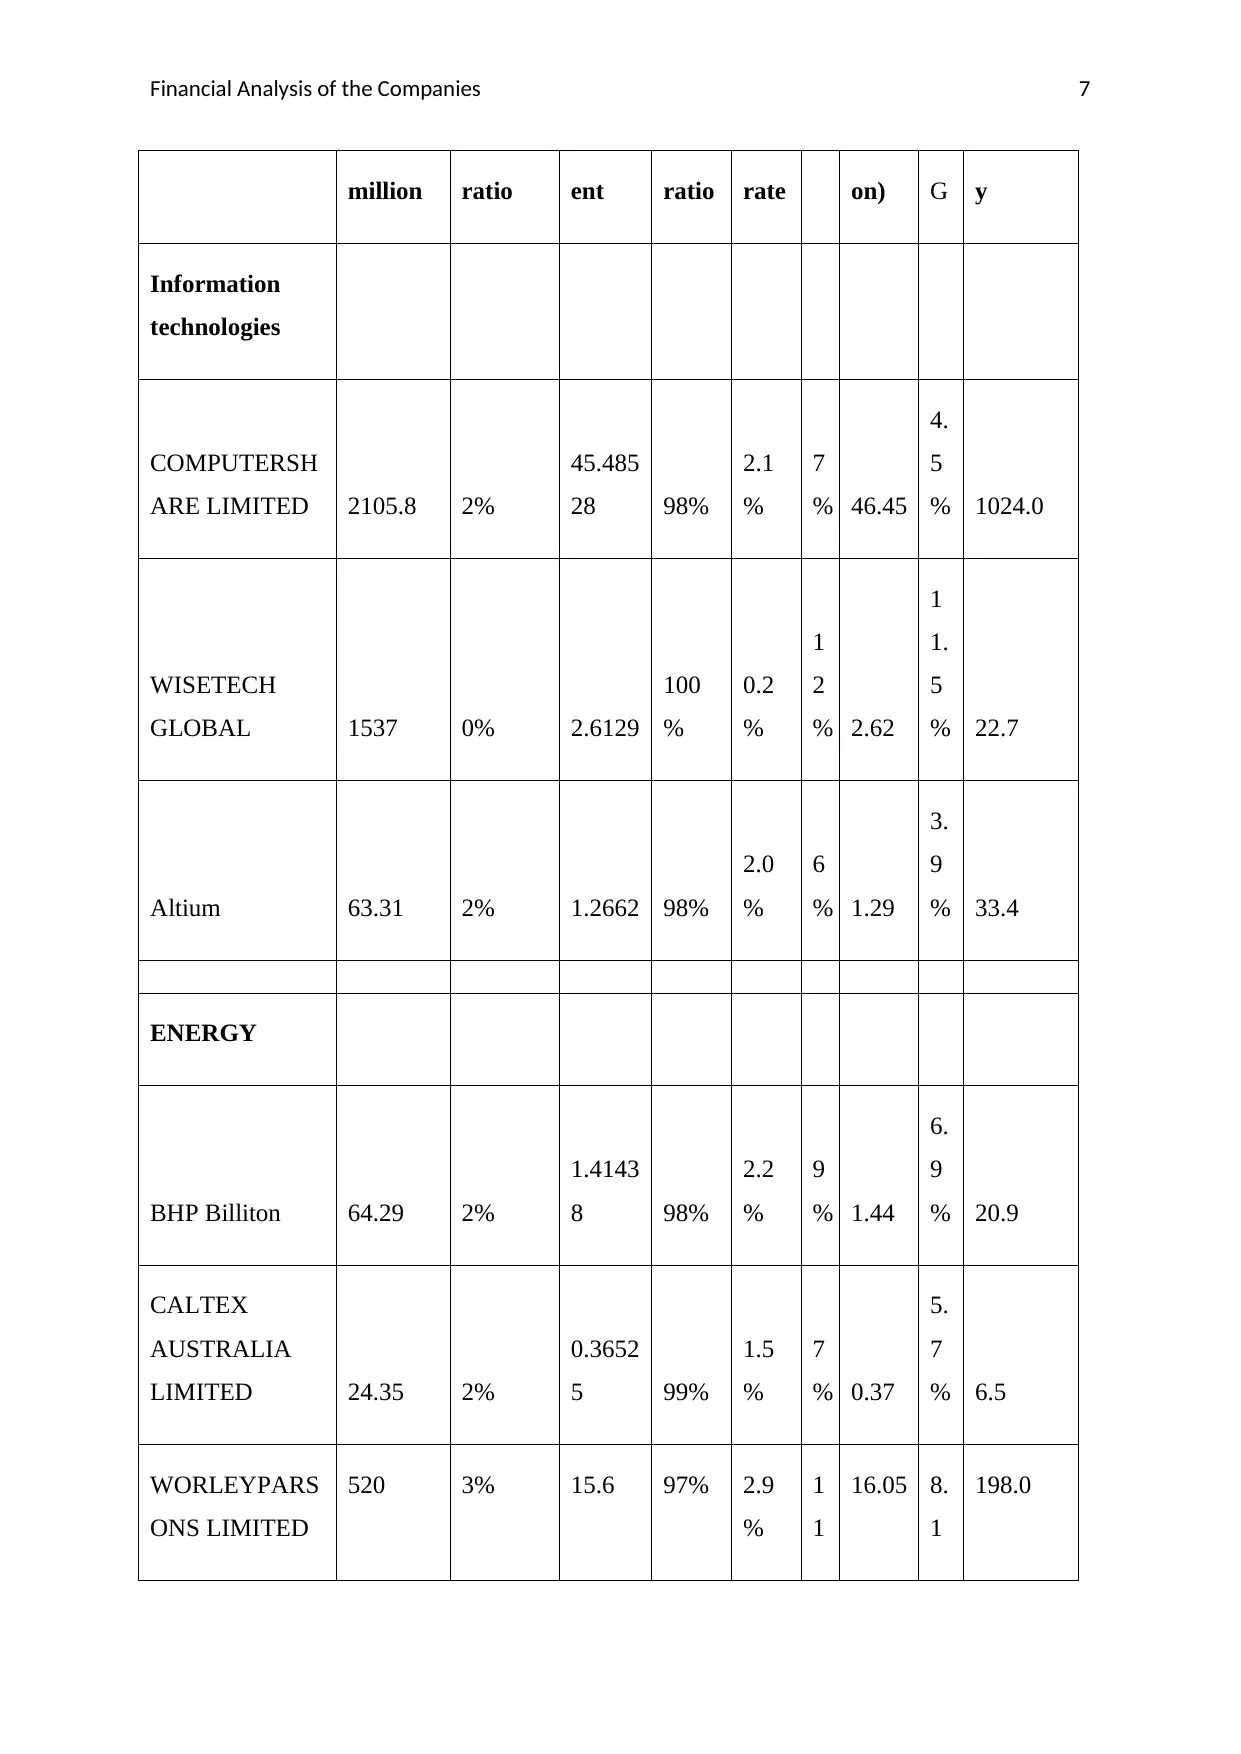
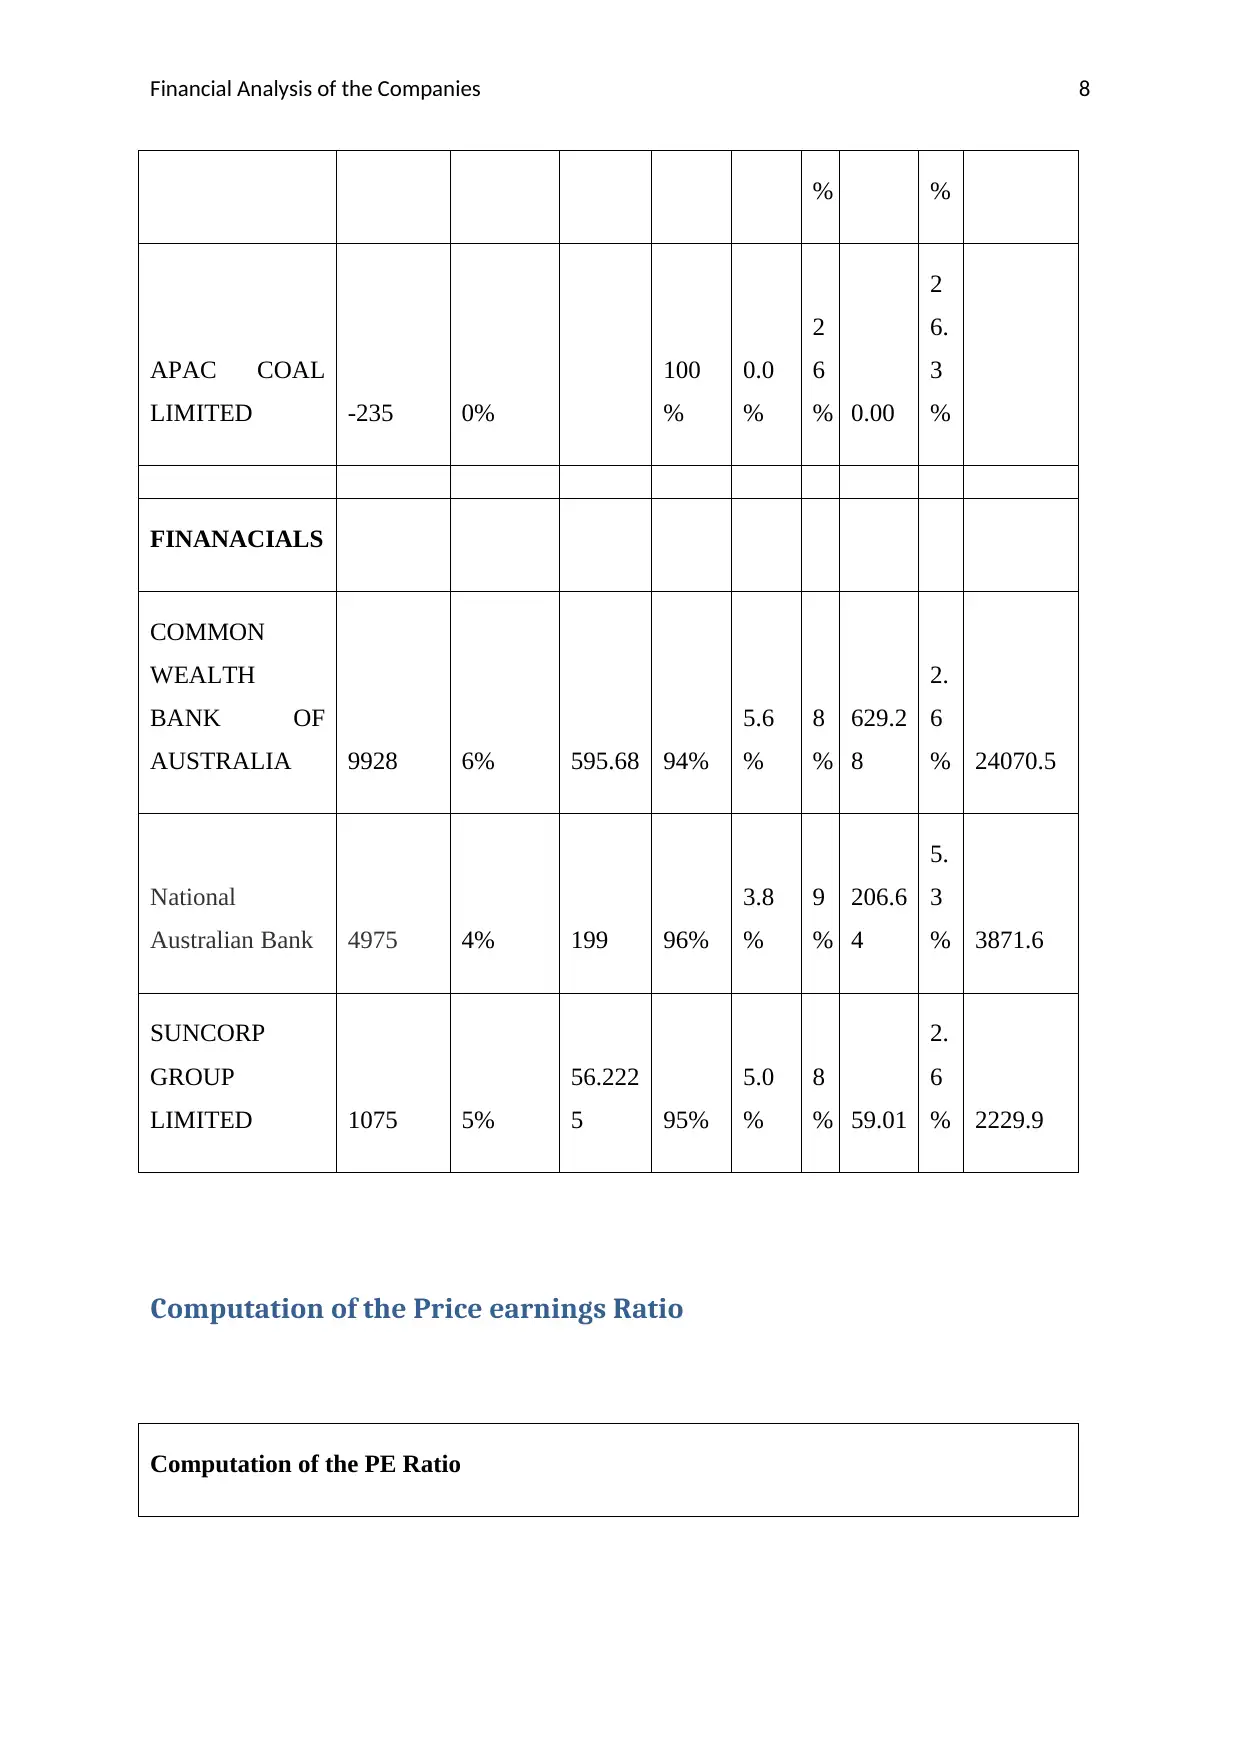
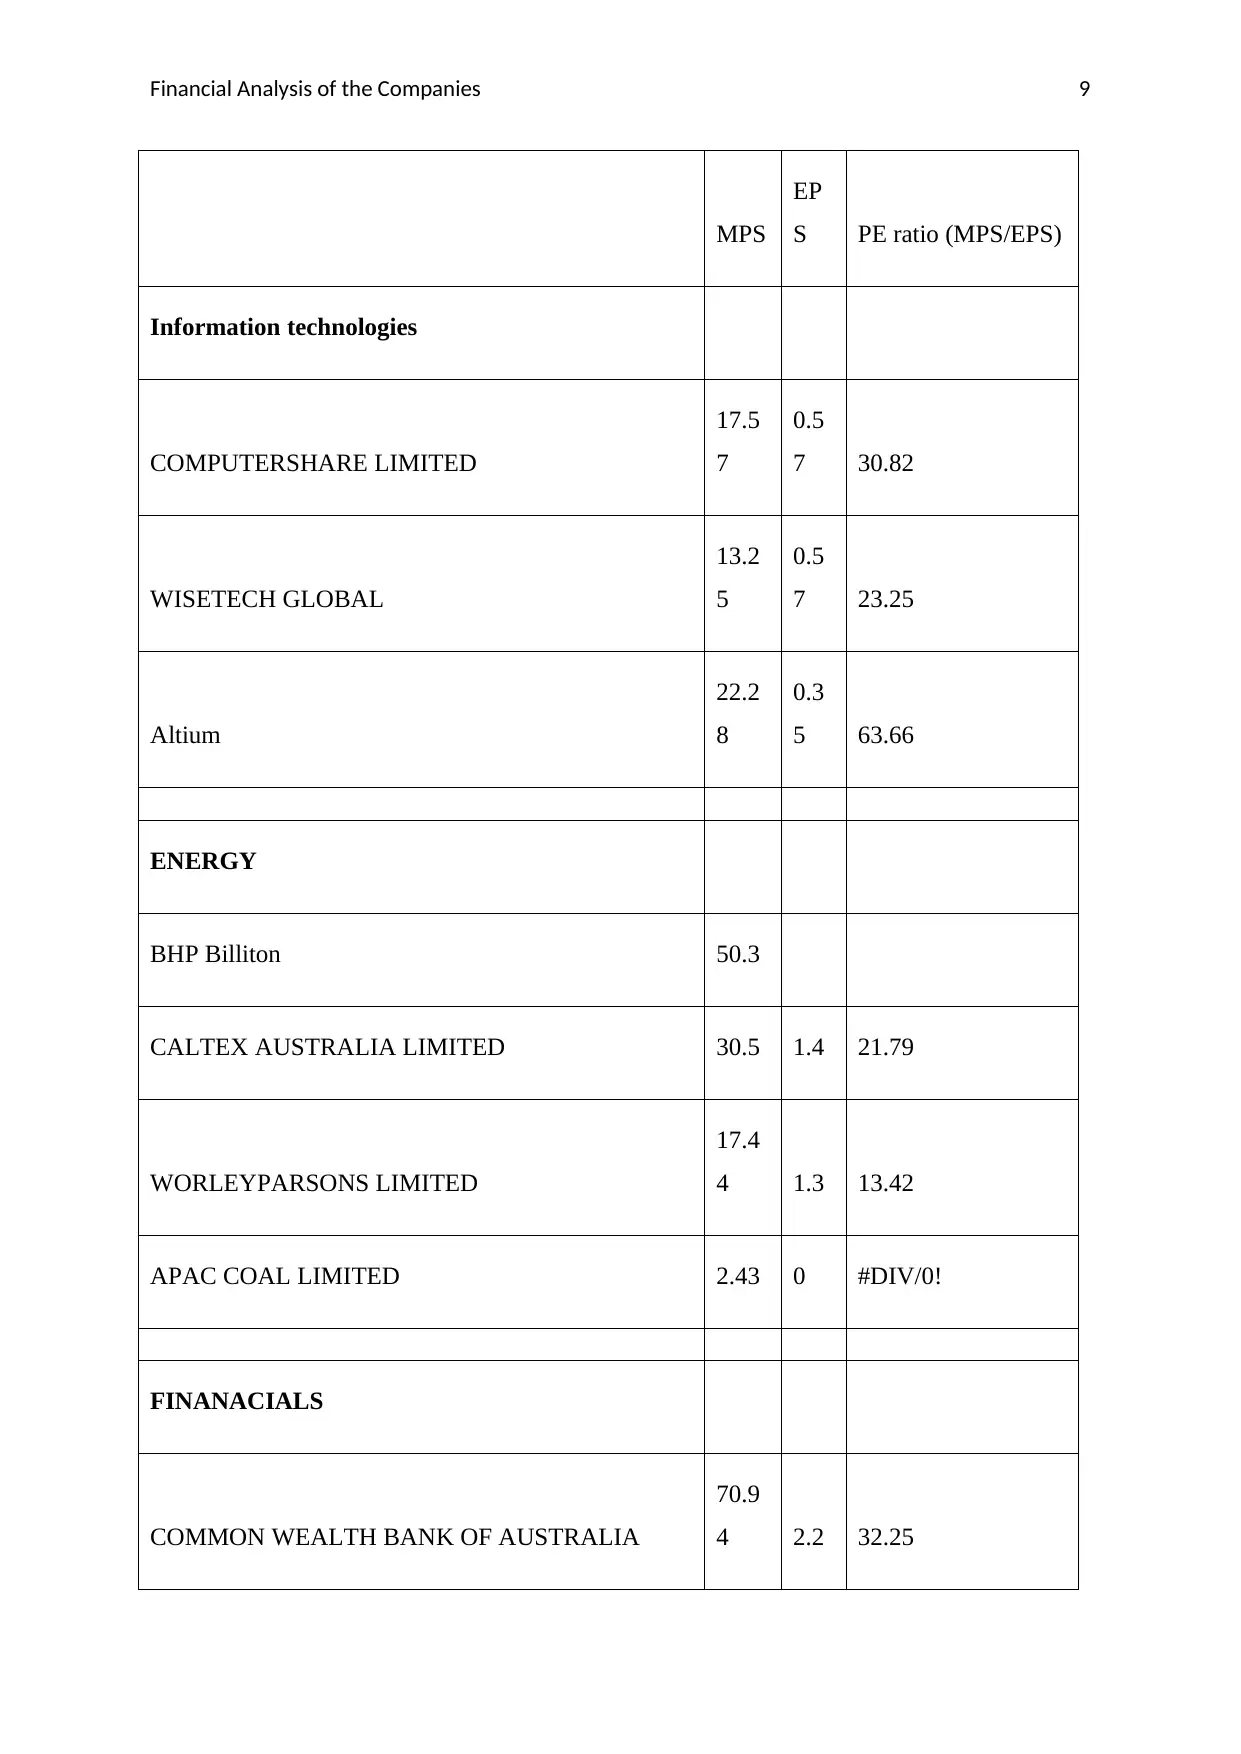
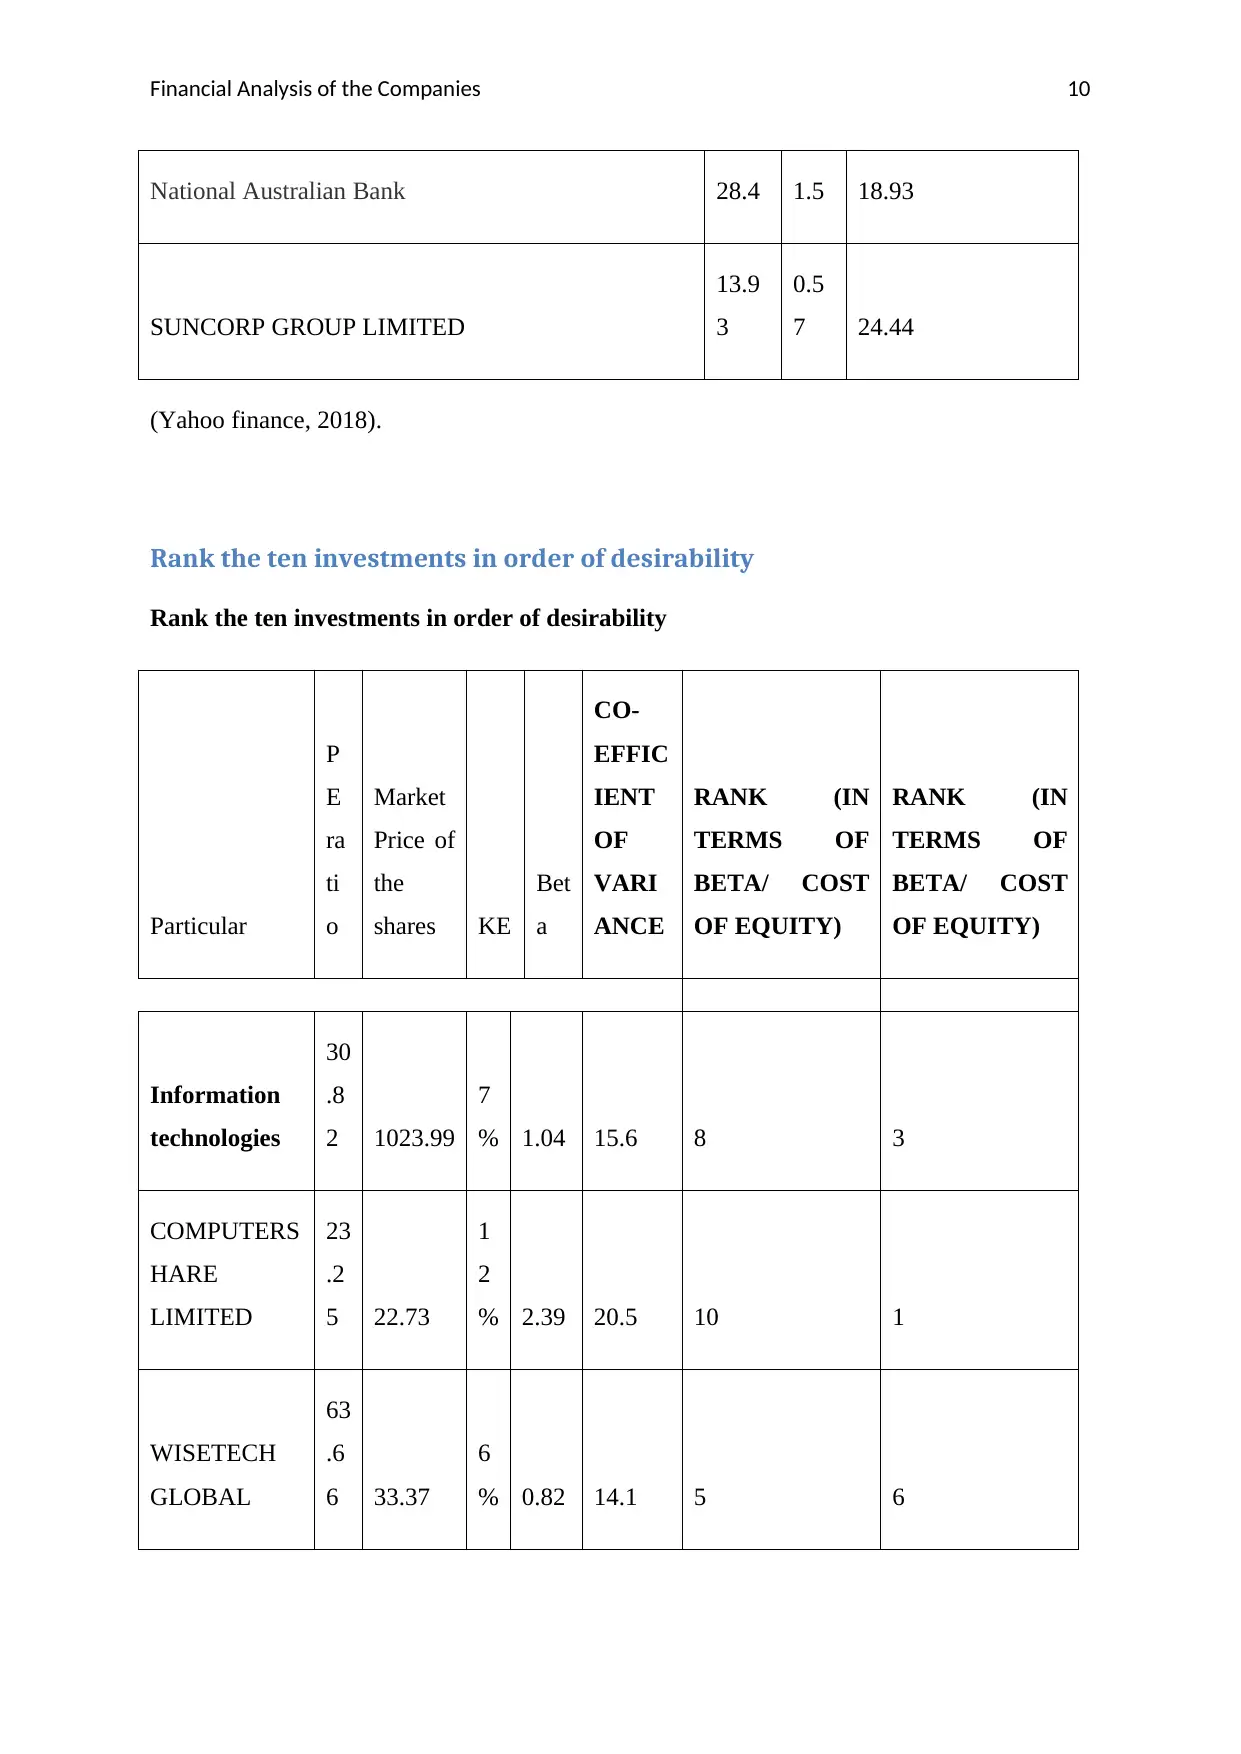
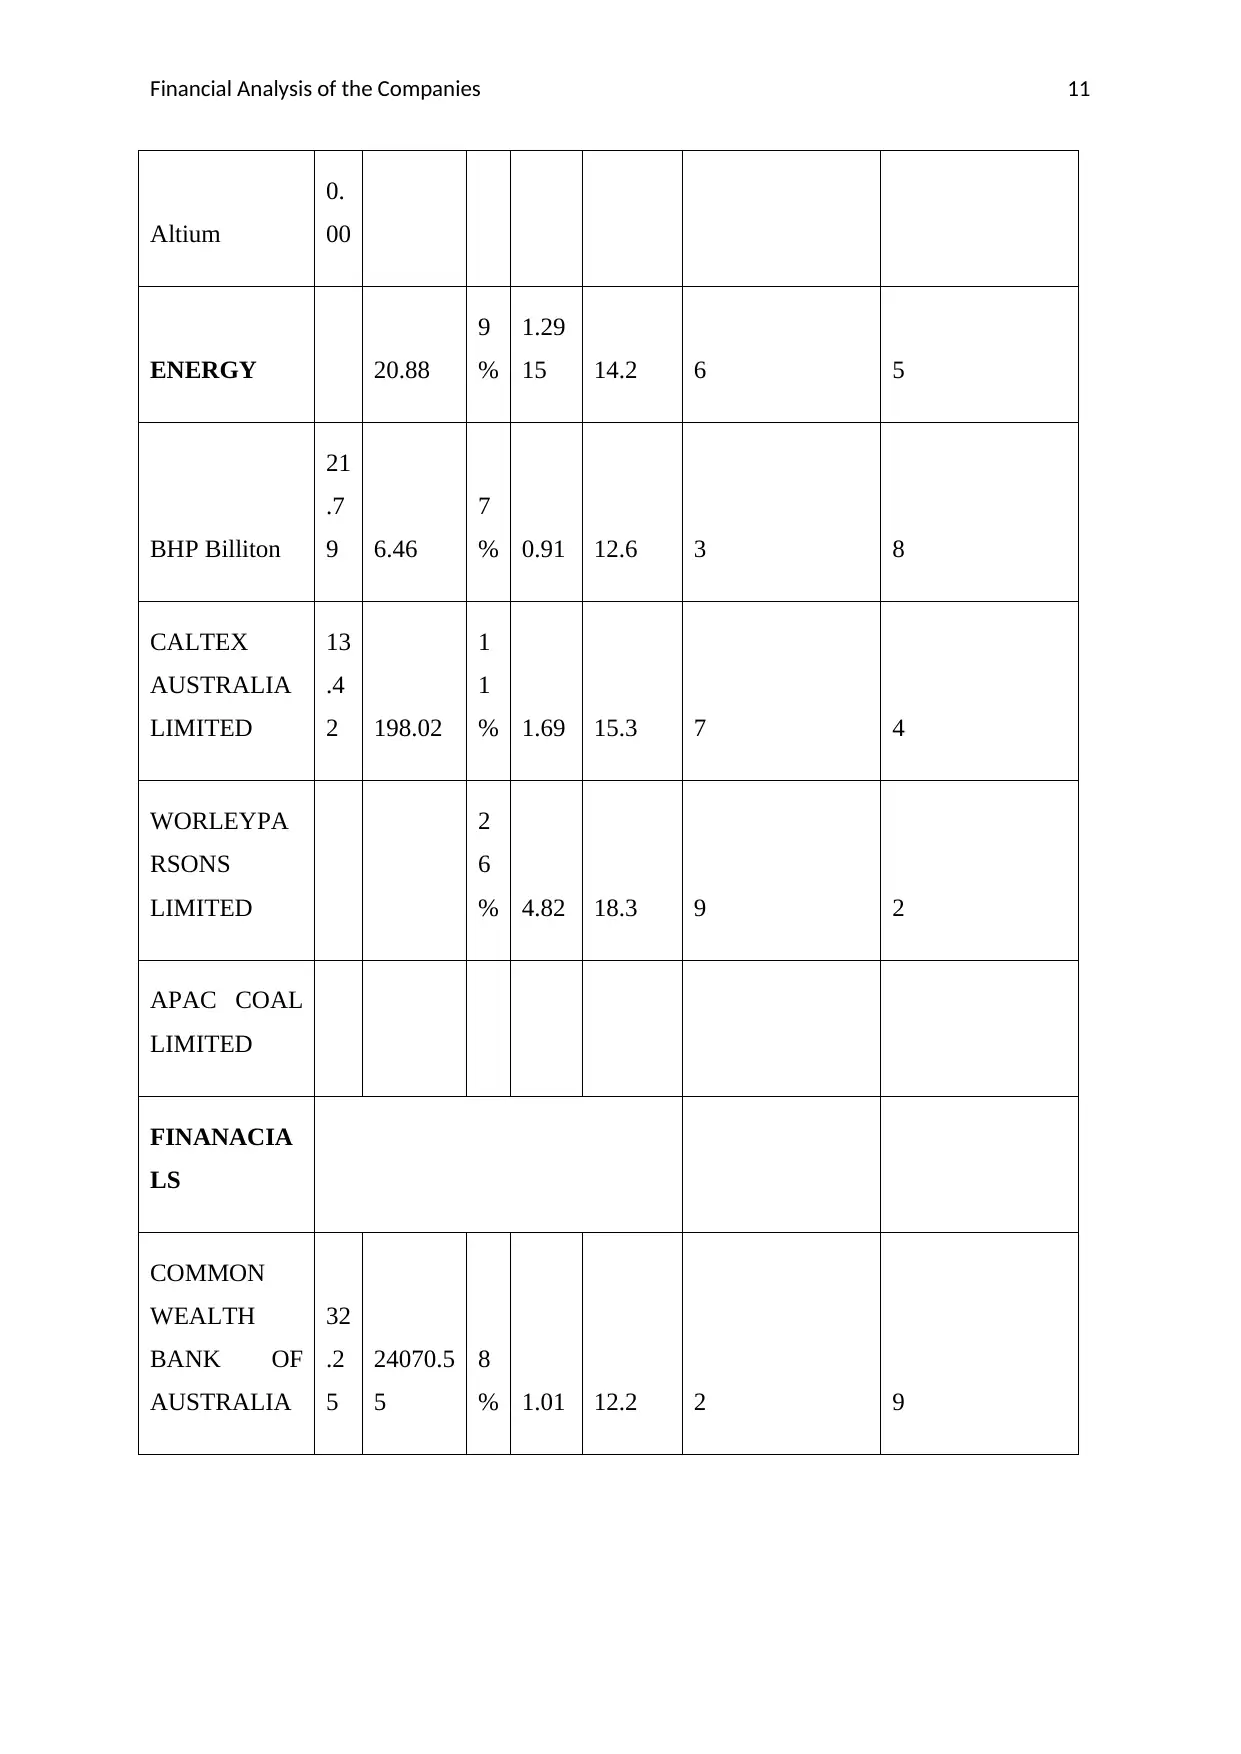
This report presents a financial analysis of ten selected companies, employing the Capital Asset Pricing Model (CAPM) and dividend discount models to determine equity values and share prices. The analysis includes the computation of Price-Earnings (P/E) ratios and the ranking of investments based on desirability, with a specific recommendation for investment. The report further delves into the investment strategies of Warren Buffet, summarizing his approach to share valuation and comparing it with the methodologies used in the initial analysis. The comparison focuses on key factors such as return on equity, financial leverage, profitability, and organizational characteristics, highlighting the similarities and differences in valuation techniques.

Running Head: Financial Analysis of the Companies
0
Financial Analysis of the Companies
0
Financial Analysis of the Companies
Paraphrase This Document
Need a fresh take? Get an instant paraphrase of this document with our AI Paraphraser

Financial Analysis of the Companies 1
Executive Summary
With the ramified changes in economy, investors needs to analysis the stock price,
return available on the equity investment and beta of the company to create value on their
investment. It is observed that investors needs to analysis whether the undertaken companies
in the portfolio will create value on the investment or not. It is observed investors needs to
select those companies which will have lower beta and market risk premium.

Financial Analysis of the Companies 2
Table of Contents
Executive Summary...............................................................................................................................2
Introduction...........................................................................................................................................2
Task 1....................................................................................................................................................3
Answer to question no-1.......................................................................................................................3
Use of equity valuation method........................................................................................................3
Dividend discount model...................................................................................................................3
Computation of the Price earnings Ratio...............................................................................................8
Rank the ten investments in order of desirability..............................................................................9
Which investment of the ten would you select...............................................................................12
Why the investment option selected...............................................................................................12
Task-2..................................................................................................................................................12
Research and summarise some interesting facts about Warren Buffet...............................................12
Task 3...................................................................................................................................................15
Compare Warren Buffet’s approach to share valuation and the share valuation methodology.........15
Share valuation Methodology..........................................................................................................16
Conclusion...........................................................................................................................................17
References...........................................................................................................................................17
Appendix.............................................................................................................................................19
⊘ This is a preview!⊘
Do you want full access?
Subscribe today to unlock all pages.

Trusted by 1+ million students worldwide

Financial Analysis of the Companies 3
Introduction
It is analyzed that Investors needs to assess whether the particular company in which
they will invest their capital will create value on their investment or not on the basis of
different valuation method. The profitability, rate of return, weighted average cost of capital
is some of the factors which affect the share price of company. In this report, valuation
method is used to value the share undertaken in this report. After that, approach Warren
Buffet has been used for the valuation of the share. In the end, comparisons of the Warren
Buffet’s approach with the share valuation have been done to evaluate the best share price
value of these selected companies.
Paraphrase This Document
Need a fresh take? Get an instant paraphrase of this document with our AI Paraphraser

Financial Analysis of the Companies 4
Task 1
Answer to question no-1
Use of equity valuation method
In order to compute the equity value of these 10 selected companies, Capital Assets
Pricing model will be used to determine the return on capital employed (Yahoo finance,
2018).
CAPM Method
RF Risk free rate of return
RM Market premium
Beta risk of the Company
Cost of equity RF+(RM-Rf)B
Dividend discount model
After that, Dividend discount model will be used to compute the share price of
company (Yahoo finance, 2018).
PARTICULARS
PRICE
OF
SHAR
ES
GR
O
WT
H
COST OF EQUITY
Computed by using
the CAPM model
RISK FREE
RATE OF
RETURN
B
E
T
A
MAR
KET
RATE
INFORMATIO
N

Financial Analysis of the Companies 5
TECHNOLOGY
COMPUTERSH
ARE LIMITED 17.57
-
0.28
% 7% 2.77%
1.
04 6.5%
WISETECH
GLOBAL 13.25
0.15
% 12% 2.77%
2.
39 6.5%
Altium 22.28
1.67
% 6% 2.77%
0.
82 6.5%
ENERGY
BHP Billiton 50.3
-
0.10
% 9% 2.77%
1.
29
15 7.7%
CALTEX
AUSTRALIA
LIMITED 30.5
2.11
% 7% 2.77%
0.
91 7.7%
WORLEYPARS
ONS LIMITED 17.44
1.99
% 11% 2.77%
1.
69 7.7%
APAC COAL
LIMITED 2.43
0.83
% 26% 2.77%
4.
82 7.7%
FINANACIALS
⊘ This is a preview!⊘
Do you want full access?
Subscribe today to unlock all pages.

Trusted by 1+ million students worldwide

Financial Analysis of the Companies 6
COMMON
WEALTH BANK
OF AUSTRALIA 70.94
-
0.06
% 8% 2.77%
1.
01 8.2%
National
Australian Bank 28.4
-
0.63
% 9% 2.77%
1.
18 8.2%
SUNCORP
GROUP
LIMITED 13.93
-
0.29
% 8% 2.77%
0.
89 8.2%
(Yahoo finance, 2018).
Computation of the share price of these different companies by using the Dividend
growth mode
Price of the company D1/ Ke-G
D1 Dividend payment
Ke= Cost of the equity
G= Growth rate
Particular Net
income(
$ in
Dividen
d pay-
out
Divide
nd
paym
Rete
ntion
Gro
wth
K
E
D1
(In
milli
K
E
-
Share
price of
Compan
Paraphrase This Document
Need a fresh take? Get an instant paraphrase of this document with our AI Paraphraser

Financial Analysis of the Companies 7
million ratio ent ratio rate on) G y
Information
technologies
COMPUTERSH
ARE LIMITED 2105.8 2%
45.485
28 98%
2.1
%
7
% 46.45
4.
5
% 1024.0
WISETECH
GLOBAL 1537 0% 2.6129
100
%
0.2
%
1
2
% 2.62
1
1.
5
% 22.7
Altium 63.31 2% 1.2662 98%
2.0
%
6
% 1.29
3.
9
% 33.4
ENERGY
BHP Billiton 64.29 2%
1.4143
8 98%
2.2
%
9
% 1.44
6.
9
% 20.9
CALTEX
AUSTRALIA
LIMITED 24.35 2%
0.3652
5 99%
1.5
%
7
% 0.37
5.
7
% 6.5
WORLEYPARS
ONS LIMITED
520 3% 15.6 97% 2.9
%
1
1
16.05 8.
1
198.0

Financial Analysis of the Companies 8
% %
APAC COAL
LIMITED -235 0%
100
%
0.0
%
2
6
% 0.00
2
6.
3
%
FINANACIALS
COMMON
WEALTH
BANK OF
AUSTRALIA 9928 6% 595.68 94%
5.6
%
8
%
629.2
8
2.
6
% 24070.5
National
Australian Bank 4975 4% 199 96%
3.8
%
9
%
206.6
4
5.
3
% 3871.6
SUNCORP
GROUP
LIMITED 1075 5%
56.222
5 95%
5.0
%
8
% 59.01
2.
6
% 2229.9
Computation of the Price earnings Ratio
Computation of the PE Ratio
⊘ This is a preview!⊘
Do you want full access?
Subscribe today to unlock all pages.

Trusted by 1+ million students worldwide

Financial Analysis of the Companies 9
MPS
EP
S PE ratio (MPS/EPS)
Information technologies
COMPUTERSHARE LIMITED
17.5
7
0.5
7 30.82
WISETECH GLOBAL
13.2
5
0.5
7 23.25
Altium
22.2
8
0.3
5 63.66
ENERGY
BHP Billiton 50.3
CALTEX AUSTRALIA LIMITED 30.5 1.4 21.79
WORLEYPARSONS LIMITED
17.4
4 1.3 13.42
APAC COAL LIMITED 2.43 0 #DIV/0!
FINANACIALS
COMMON WEALTH BANK OF AUSTRALIA
70.9
4 2.2 32.25
Paraphrase This Document
Need a fresh take? Get an instant paraphrase of this document with our AI Paraphraser

Financial Analysis of the Companies 10
National Australian Bank 28.4 1.5 18.93
SUNCORP GROUP LIMITED
13.9
3
0.5
7 24.44
(Yahoo finance, 2018).
Rank the ten investments in order of desirability
Particular
P
E
ra
ti
o
Market
Price of
the
shares KE
Bet
a
CO-
EFFIC
IENT
OF
VARI
ANCE
RANK (IN
TERMS OF
BETA/ COST
OF EQUITY)
RANK (IN
TERMS OF
BETA/ COST
OF EQUITY)
Information
technologies
30
.8
2 1023.99
7
% 1.04 15.6 8 3
COMPUTERS
HARE
LIMITED
23
.2
5 22.73
1
2
% 2.39 20.5 10 1
WISETECH
GLOBAL
63
.6
6 33.37
6
% 0.82 14.1 5 6

Financial Analysis of the Companies 11
Altium
0.
00
ENERGY 20.88
9
%
1.29
15 14.2 6 5
BHP Billiton
21
.7
9 6.46
7
% 0.91 12.6 3 8
CALTEX
AUSTRALIA
LIMITED
13
.4
2 198.02
1
1
% 1.69 15.3 7 4
WORLEYPA
RSONS
LIMITED
2
6
% 4.82 18.3 9 2
APAC COAL
LIMITED
FINANACIA
LS
COMMON
WEALTH
BANK OF
AUSTRALIA
32
.2
5
24070.5
5
8
% 1.01 12.2 2 9
Altium
0.
00
ENERGY 20.88
9
%
1.29
15 14.2 6 5
BHP Billiton
21
.7
9 6.46
7
% 0.91 12.6 3 8
CALTEX
AUSTRALIA
LIMITED
13
.4
2 198.02
1
1
% 1.69 15.3 7 4
WORLEYPA
RSONS
LIMITED
2
6
% 4.82 18.3 9 2
APAC COAL
LIMITED
FINANACIA
LS
COMMON
WEALTH
BANK OF
AUSTRALIA
32
.2
5
24070.5
5
8
% 1.01 12.2 2 9
⊘ This is a preview!⊘
Do you want full access?
Subscribe today to unlock all pages.

Trusted by 1+ million students worldwide
1 out of 22
Related Documents

Your All-in-One AI-Powered Toolkit for Academic Success.
 +13062052269
info@desklib.com
Available 24*7 on WhatsApp / Email
Unlock your academic potential
Copyright © 2020–2025 A2Z Services. All Rights Reserved. Developed and managed by ZUCOL.