Financial Analysis Report: Wells Fargo and Capital One Stocks

Verified

Added on  2023/04/19

|7
|517
|462
Report
AI Summary
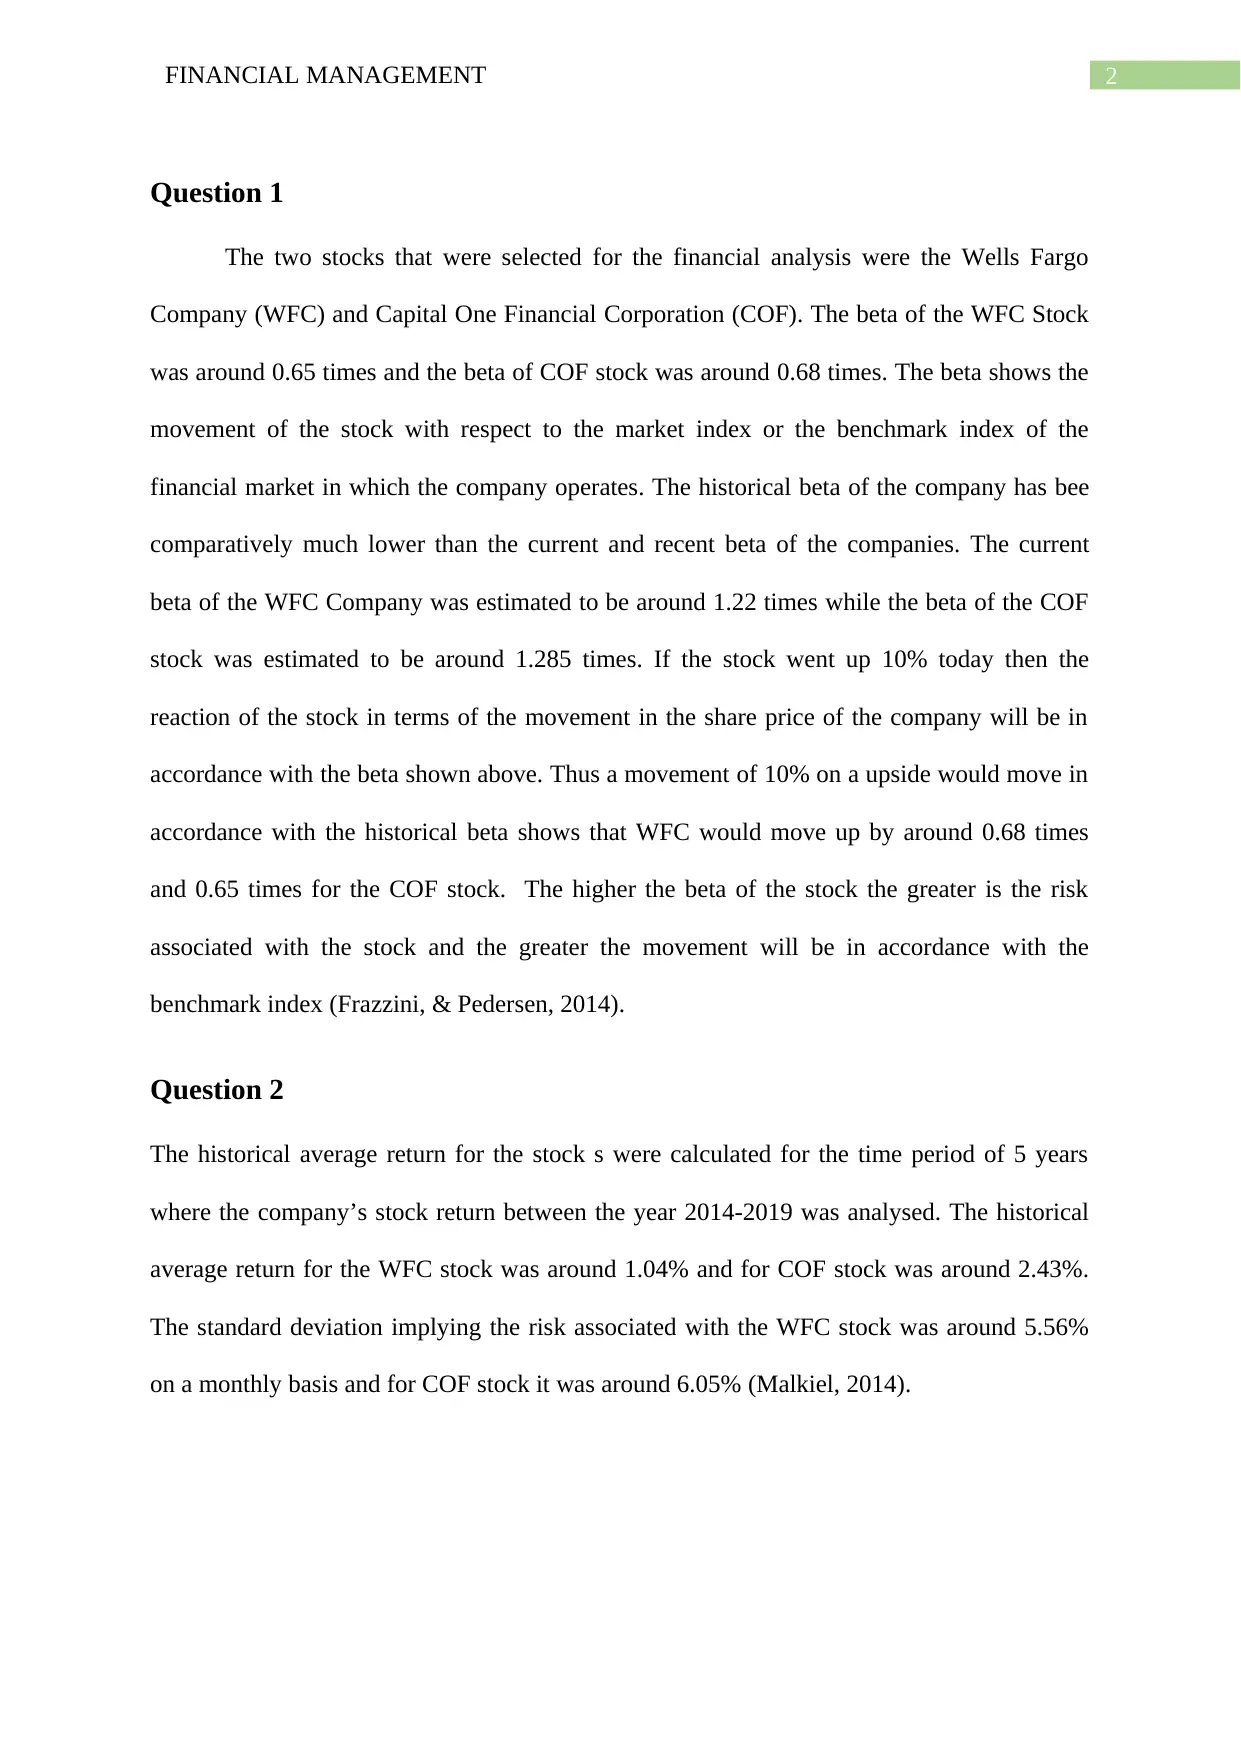
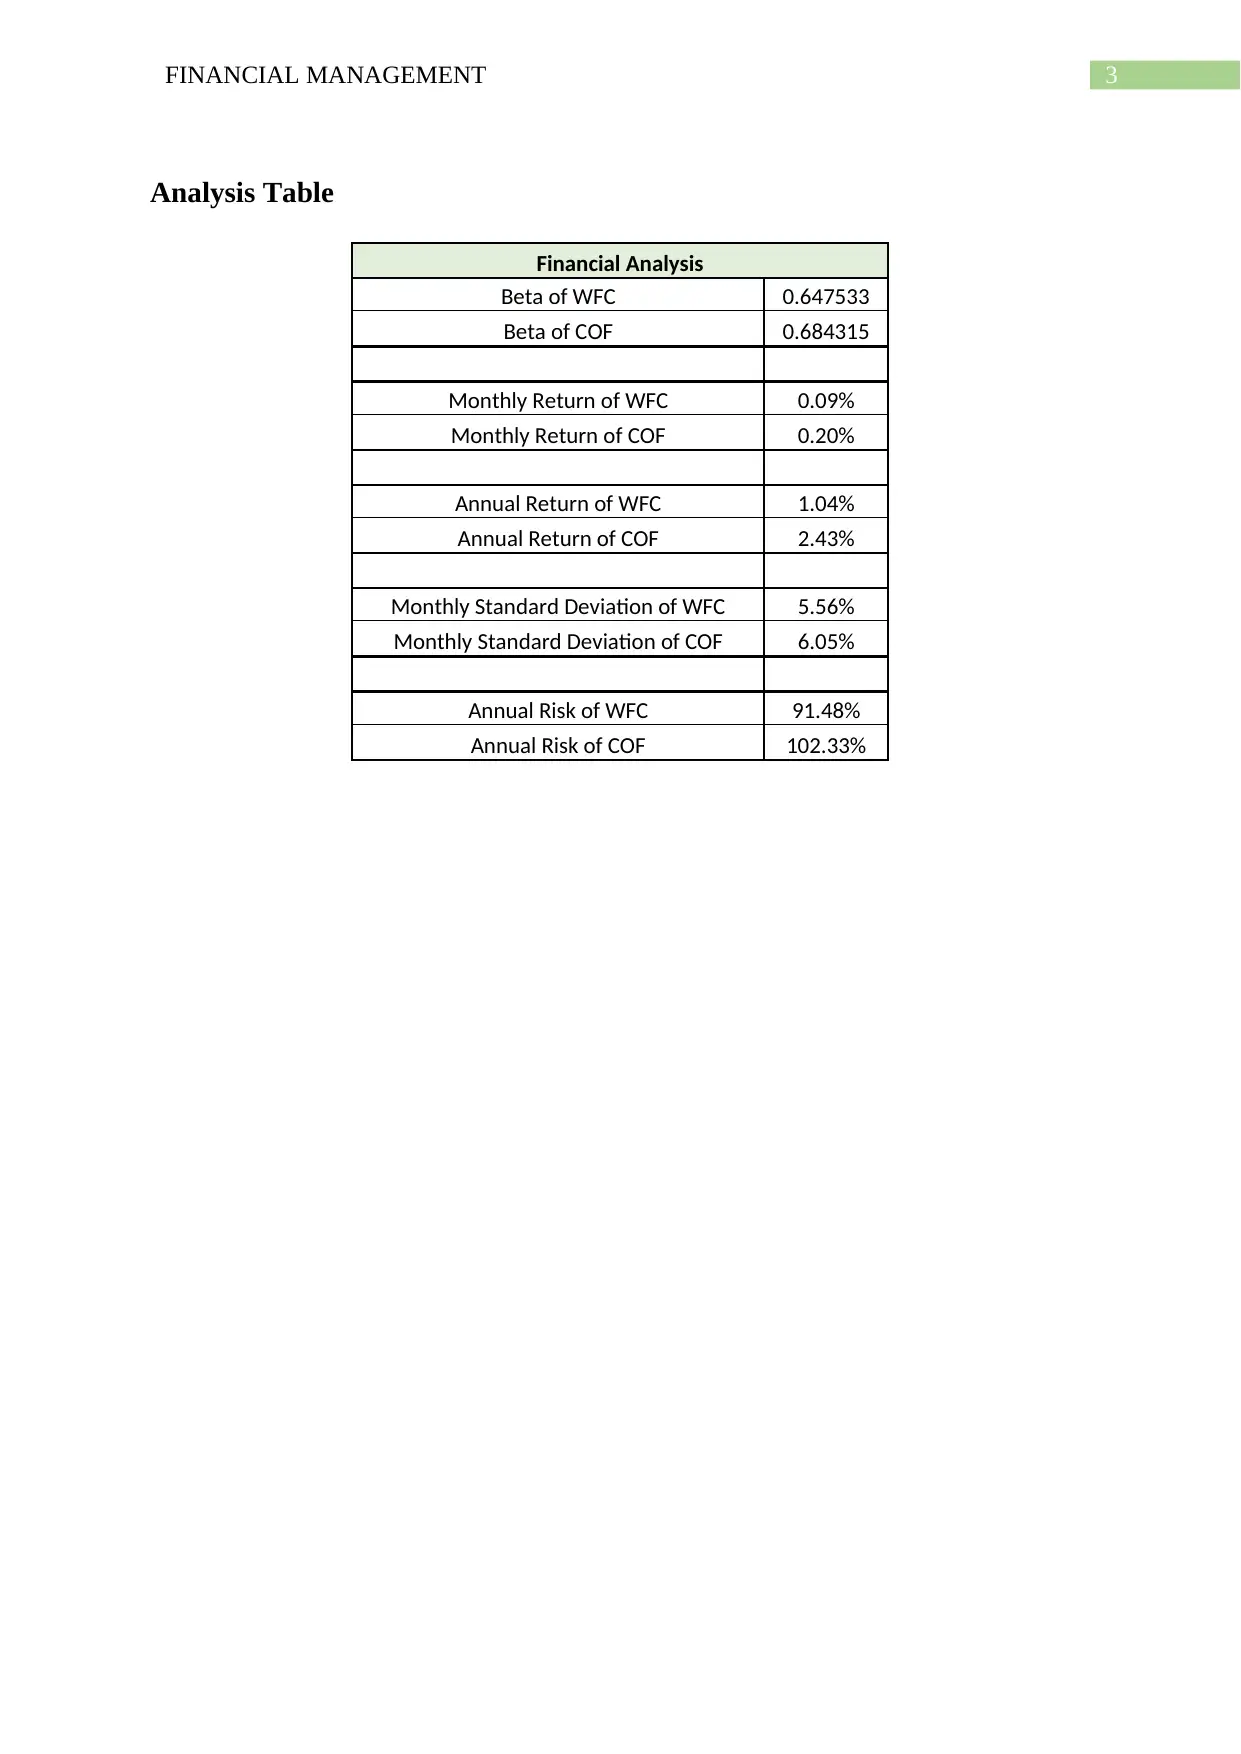
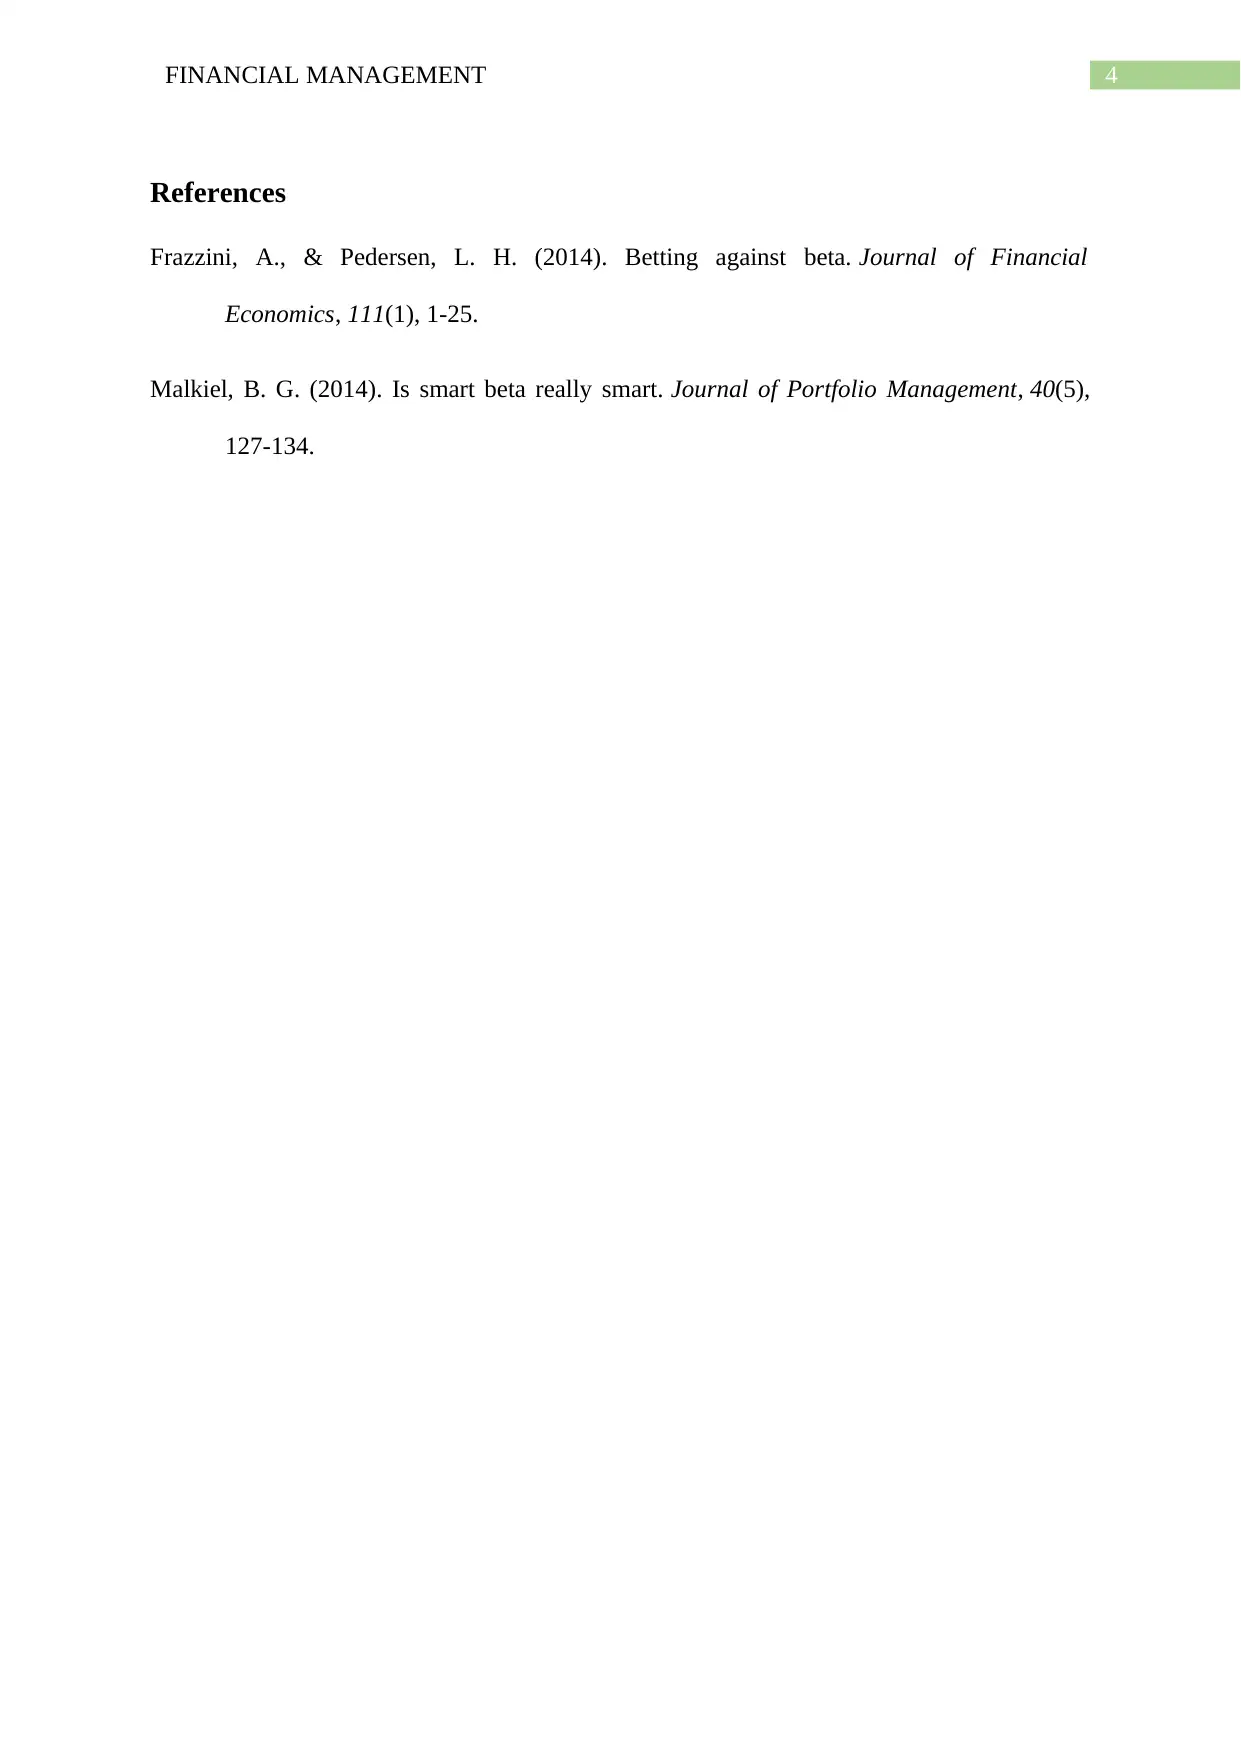
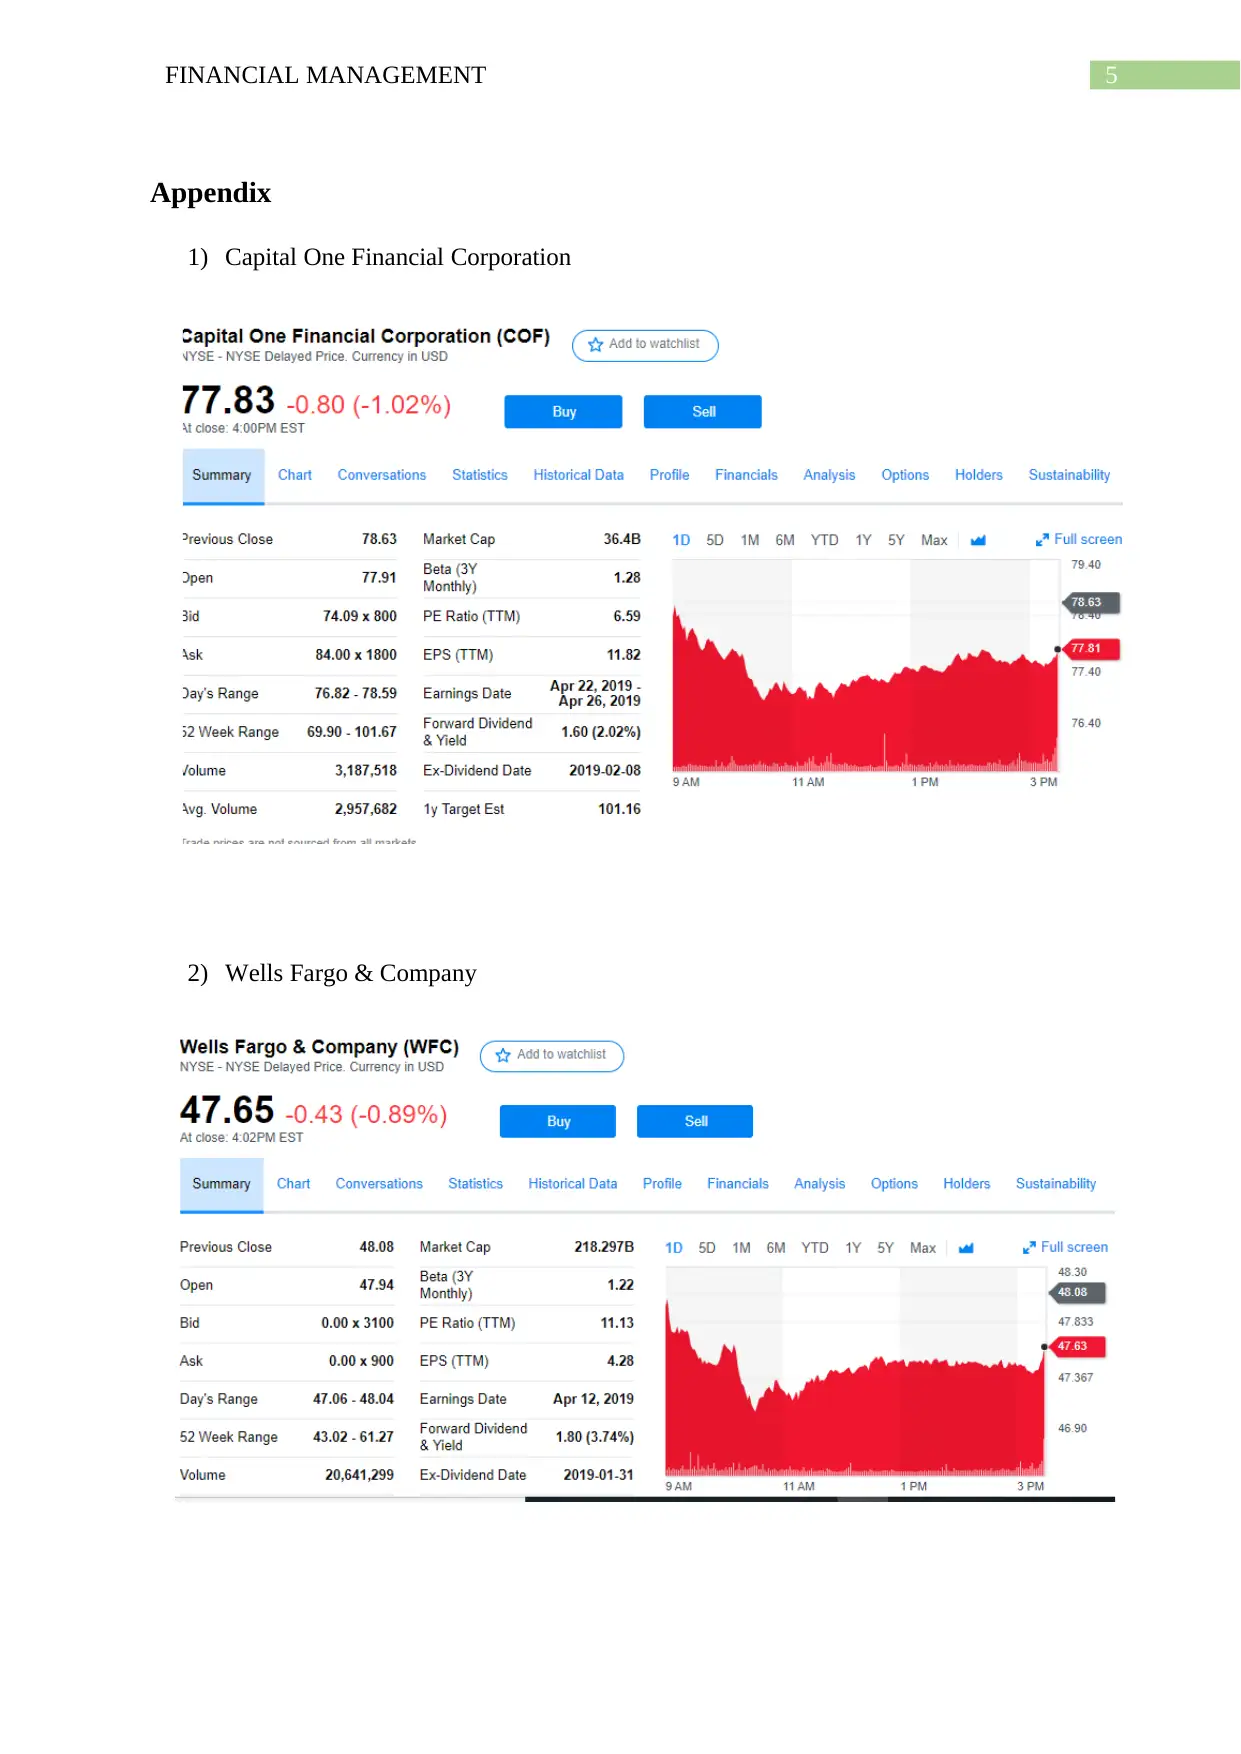
This report presents a financial analysis of two stocks: Wells Fargo and Capital One. It begins by examining the beta of each stock, indicating their volatility relative to the market, and then proceeds to analyze historical returns over a five-year period (2014-2019). The report provides the monthly and annual returns of the two stocks along with the standard deviations to assess the risk associated with each investment. The analysis includes an examination of the potential impact of changes in the benchmark index on the stock prices. The report concludes with a summary of the key financial metrics and risk assessments for both companies.
Document Page
Running head: FINANCIAL MANAGEMENT
Financial Management
Name of the Student:
Name of the University:
Author’s Note:
tabler-icon-diamond-filled.svg

Paraphrase This Document

Need a fresh take? Get an instant paraphrase of this document with our AI Paraphraser
Document Page
1FINANCIAL MANAGEMENT
Table of Contents
Question 1..................................................................................................................................2
Question 2..................................................................................................................................2
Analysis Table............................................................................................................................3
References..................................................................................................................................4
Appendix....................................................................................................................................5
Document Page
2FINANCIAL MANAGEMENT
Question 1
The two stocks that were selected for the financial analysis were the Wells Fargo
Company (WFC) and Capital One Financial Corporation (COF). The beta of the WFC Stock
was around 0.65 times and the beta of COF stock was around 0.68 times. The beta shows the
movement of the stock with respect to the market index or the benchmark index of the
financial market in which the company operates. The historical beta of the company has bee
comparatively much lower than the current and recent beta of the companies. The current
beta of the WFC Company was estimated to be around 1.22 times while the beta of the COF
stock was estimated to be around 1.285 times. If the stock went up 10% today then the
reaction of the stock in terms of the movement in the share price of the company will be in
accordance with the beta shown above. Thus a movement of 10% on a upside would move in
accordance with the historical beta shows that WFC would move up by around 0.68 times
and 0.65 times for the COF stock. The higher the beta of the stock the greater is the risk
associated with the stock and the greater the movement will be in accordance with the
benchmark index (Frazzini, & Pedersen, 2014).
Question 2
The historical average return for the stock s were calculated for the time period of 5 years
where the company’s stock return between the year 2014-2019 was analysed. The historical
average return for the WFC stock was around 1.04% and for COF stock was around 2.43%.
The standard deviation implying the risk associated with the WFC stock was around 5.56%
on a monthly basis and for COF stock it was around 6.05% (Malkiel, 2014).
Document Page
3FINANCIAL MANAGEMENT
Analysis Table
Financial Analysis
Beta of WFC 0.647533
Beta of COF 0.684315
Monthly Return of WFC 0.09%
Monthly Return of COF 0.20%
Annual Return of WFC 1.04%
Annual Return of COF 2.43%
Monthly Standard Deviation of WFC 5.56%
Monthly Standard Deviation of COF 6.05%
Annual Risk of WFC 91.48%
Annual Risk of COF 102.33%
tabler-icon-diamond-filled.svg

Paraphrase This Document

Need a fresh take? Get an instant paraphrase of this document with our AI Paraphraser
Document Page
4FINANCIAL MANAGEMENT
References
Frazzini, A., & Pedersen, L. H. (2014). Betting against beta. Journal of Financial
Economics, 111(1), 1-25.
Malkiel, B. G. (2014). Is smart beta really smart. Journal of Portfolio Management, 40(5),
127-134.
Document Page
5FINANCIAL MANAGEMENT
Appendix
1) Capital One Financial Corporation
2) Wells Fargo & Company
Document Page
6FINANCIAL MANAGEMENT
chevron_up_icon
1 out of 7
circle_padding
hide_on_mobile
zoom_out_icon
[object Object]