Financial Performance Analysis of Flagship Investments Ltd Report

Verified

Added on  2023/04/11

|10
|1413
|299
Report
AI Summary
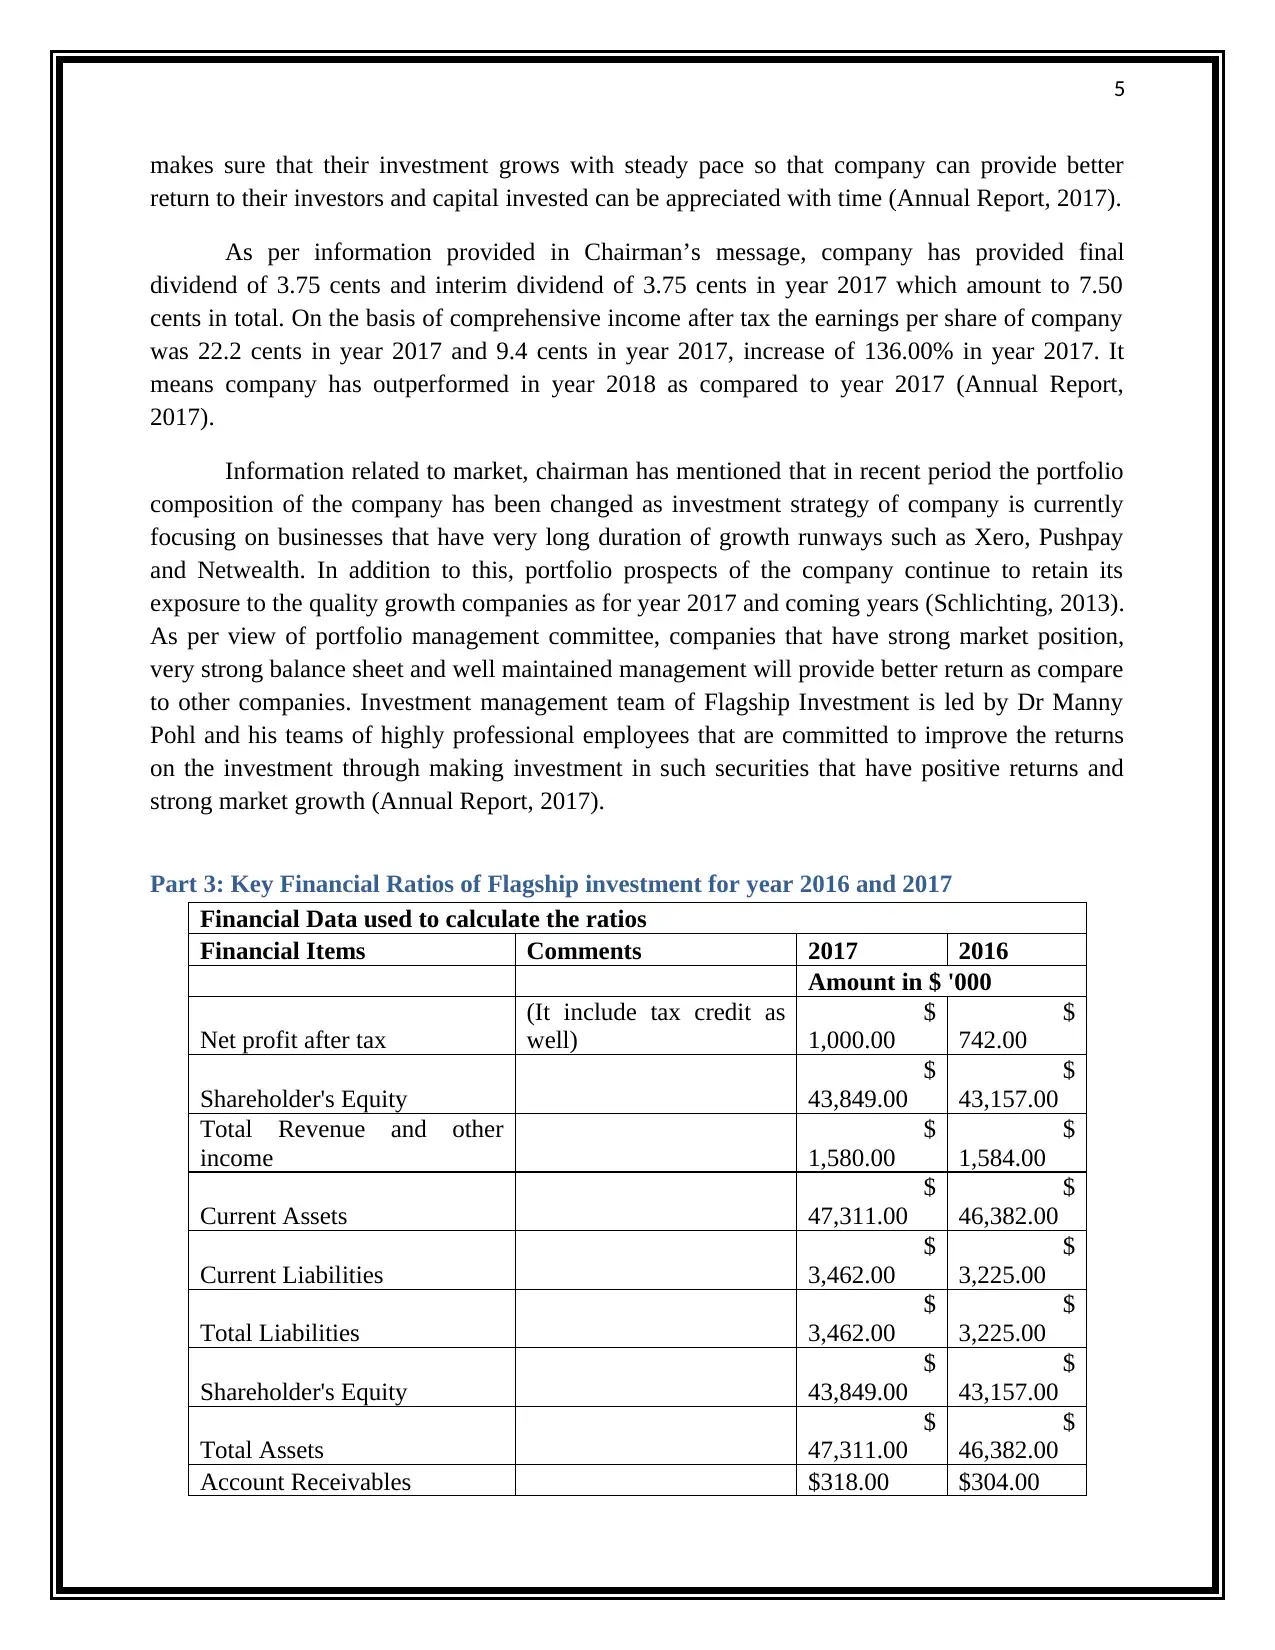
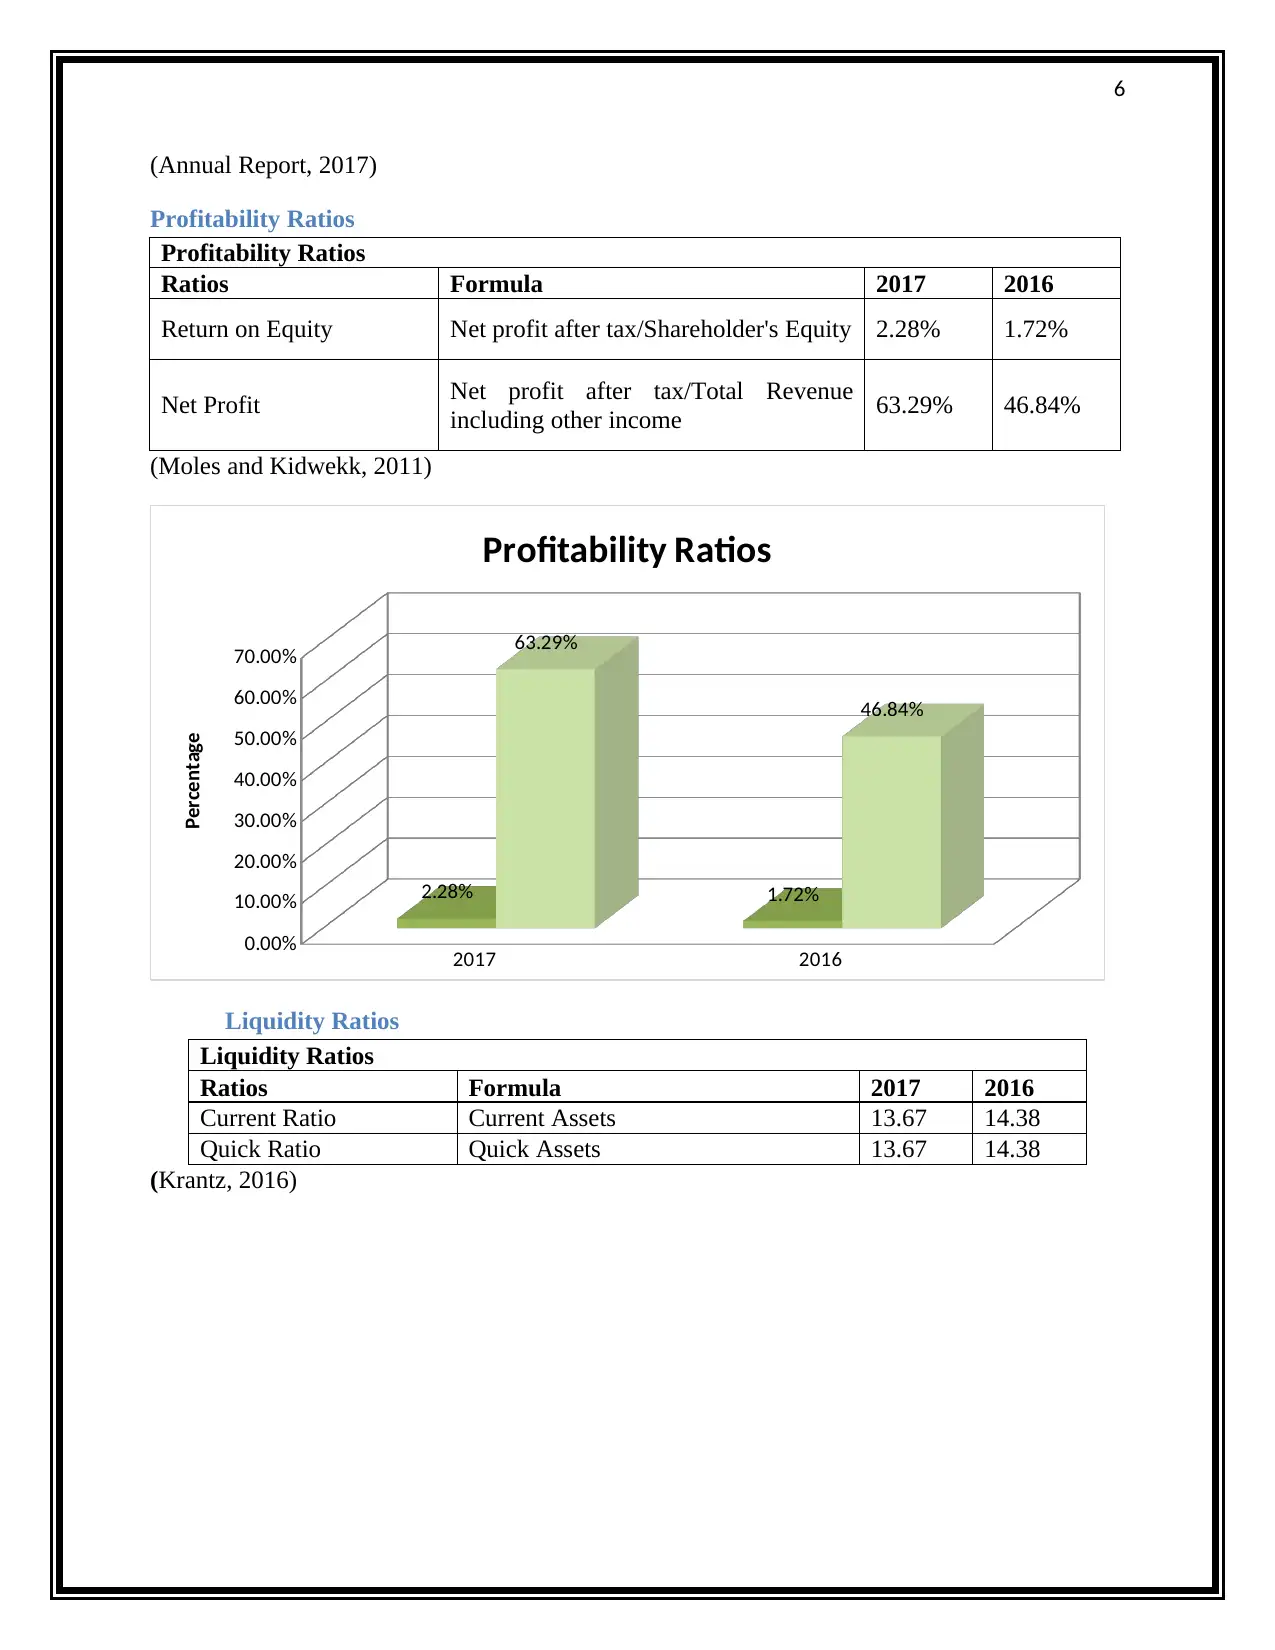
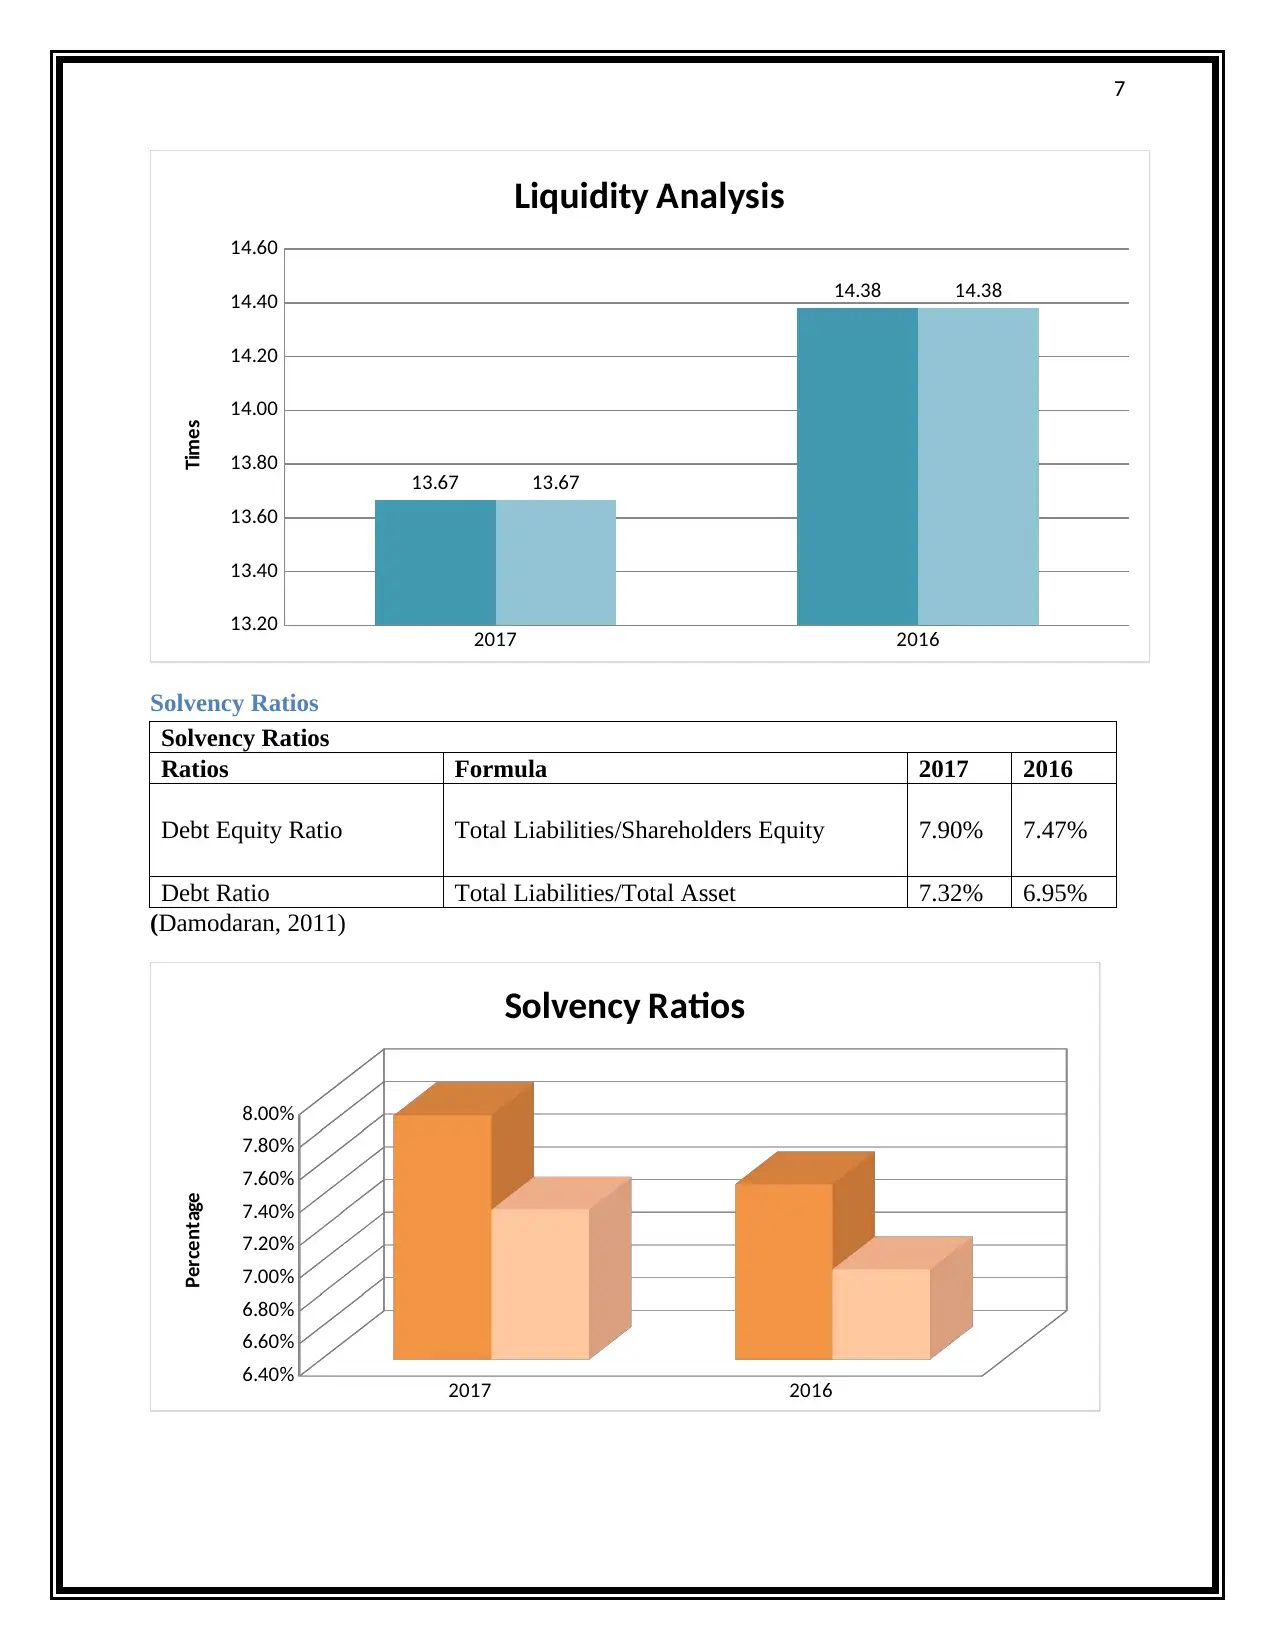
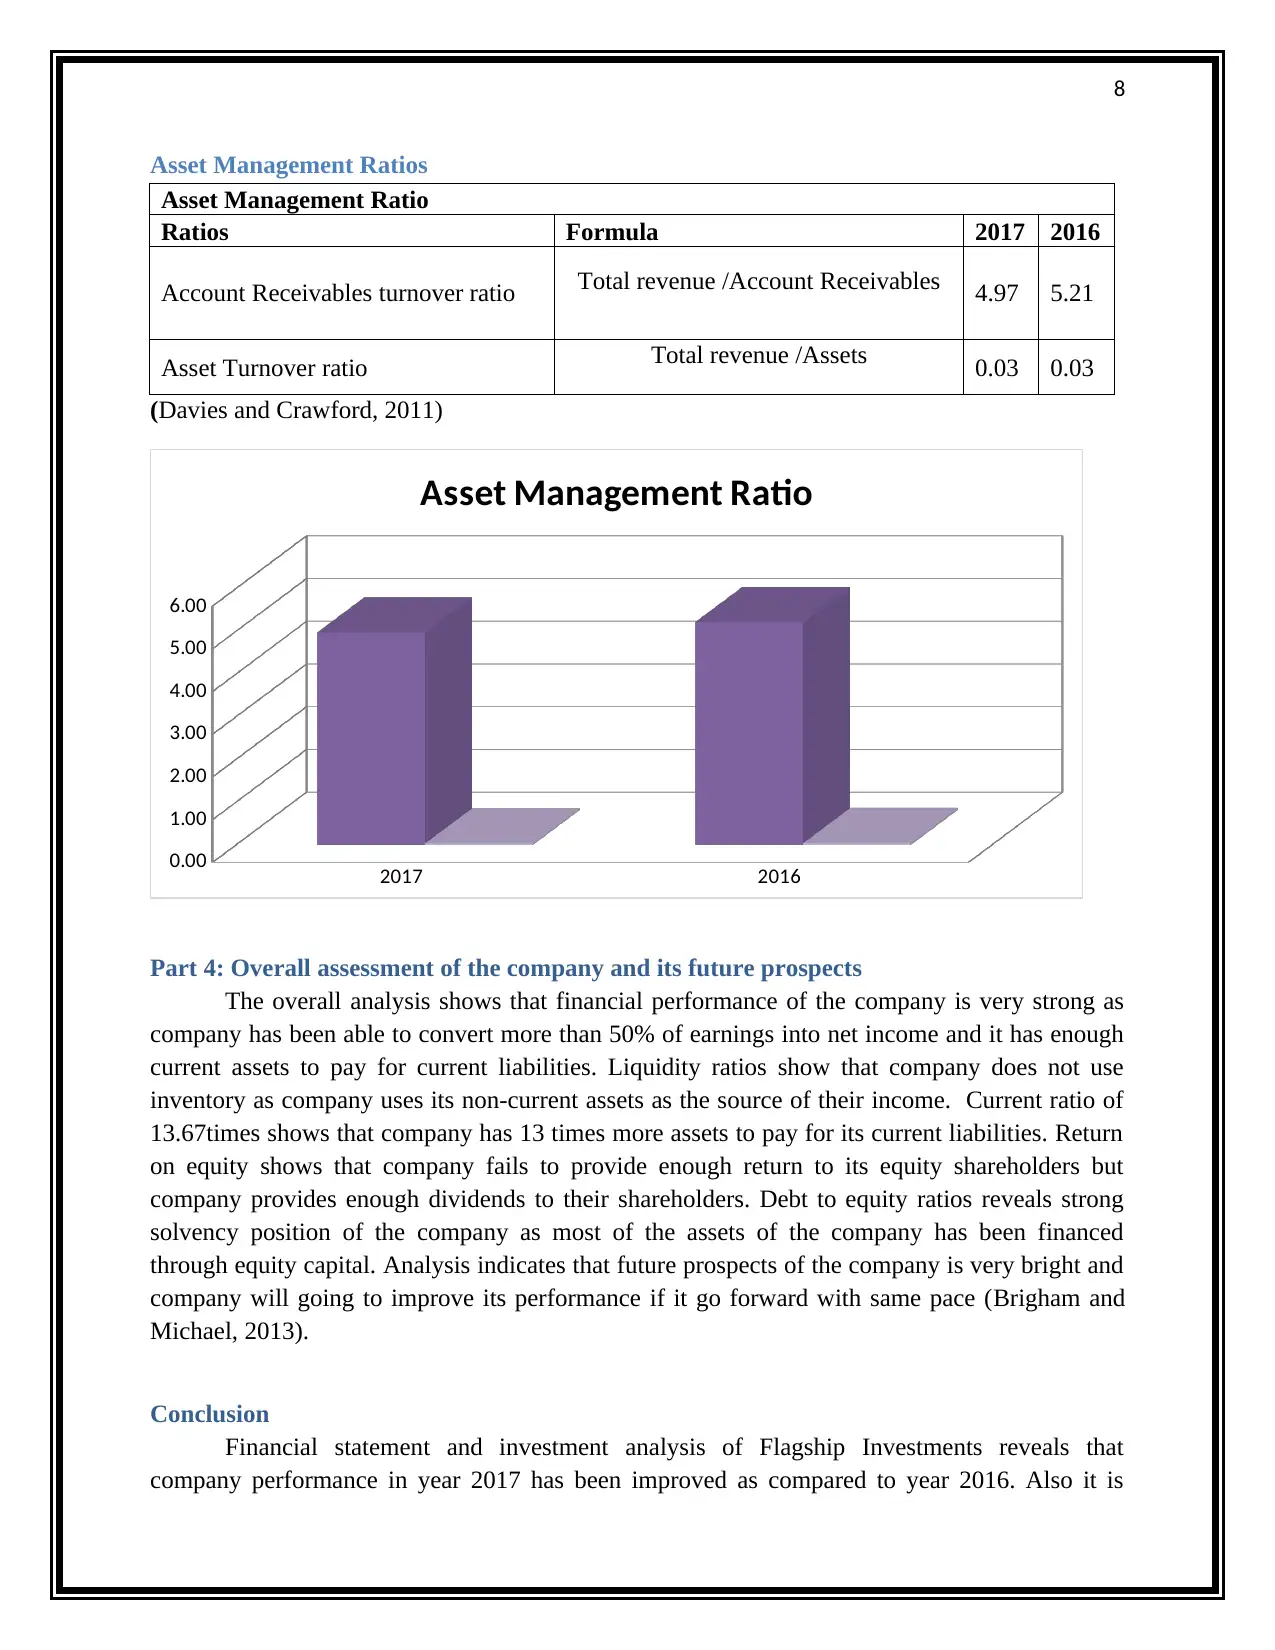
This report provides a comprehensive financial analysis of Flagship Investments Ltd for the fiscal year 2017-2018. It begins with an executive summary and introduction, followed by an overview of the company's core business activities. The report examines major changes in financial performance, drawing from the chairman's and managing director's reviews. Key financial ratios, including profitability, liquidity, solvency, and asset management ratios, are calculated and analyzed for the years 2016 and 2017. The analysis includes detailed financial data and ratio calculations, along with a comparative analysis. The report concludes with an overall assessment of the company's financial health and future prospects, highlighting its strong financial position, bright future and recommendations for investors. The report references the company's annual reports and relevant academic literature.
Document Page
1
BAP42A Financial Statements and Investments Analysis
tabler-icon-diamond-filled.svg

Paraphrase This Document

Need a fresh take? Get an instant paraphrase of this document with our AI Paraphraser
Document Page
2
Executive Summary
This report has evaluated the financial performance of the company Flagship Investments
Ltd for the financial year 2017-2018. This has been calculated with the use of financial ratios
such as profitability, liquidity, solvency and asset management ratios. It has been analyzed on the
basis of financial ratios that the company has maintained a sound financial position over the
selected financial period.
Document Page
3
Contents
Executive Summary.........................................................................................................................2
Introduction......................................................................................................................................4
Findings...........................................................................................................................................4
Part 1: Core business activities of Flagship Investments Limited...................................................4
Part 2: Major changes in the financial performance of Flagship investment from the chairman’s
message or managing director’s review..........................................................................................4
Part 3: Key Financial Ratios of Flagship investment for year 2016 and 2017................................5
Profitability Ratios.......................................................................................................................6
Liquidity Ratios............................................................................................................................6
Solvency Ratios............................................................................................................................7
Asset Management Ratios............................................................................................................8
Part 4: Overall assessment of the company and its future prospects...............................................8
Conclusion.......................................................................................................................................8
References........................................................................................................................................9
Document Page
4
Introduction
The present report is developed for analyzing the financial statements of a selected
company, that is, Flagship Investments Ltd, an investment company of Australia. In this context,
it has undertaken a description of the core business activity of the company and major changes in
its financial performance as per the view of its managing director. This is followed by calculating
the key financial ratios of the company by conducting thorough analysis of financial statements
for the year 2016-2017. Lastly, it has provided an overall assessment of the company and its
future growth prospects.
Findings
Part 1: Core business activities of Flagship Investments Limited
Flagship Investments Limited is an Australia investment company that is involved in
providing access to the investors of expertly crafted quality portfolio of Australian growth
companies. The mission statement of the company is creating maximum wealth for shareholders
through active management of portfolio of ASX listed companies. The core activities of the
company include promoting investment in securities listed with ASX for promoting their
medium to long-term capital growth. It operates its business within investment industry. The
managing director of the company has considered business to consist of only just one reporting
segment (Annual Report, 2017).
Part 2: Major changes in the financial performance of Flagship investment from the
chairman’s message or managing director’s review
Chairman of Flagship Investments Limited has provided detailed financial review of the
company in annual report of year 2017. As per the information given in the Chairman’s message
and director report, revenue of the company has increased moderately to 8.9% and total assets
(fair value of all investments, cash and dividend receivables) has increased by 12.3% in year
2017. After tax profit of the company has increased by 10.20% in current year which indicate
growth prospects and return provided to the investors. Performance fee increased by 4.7% and
total performance fees paid or payable to the manager in current year is $1212781. Chairman
added to his statement that the portfolio of Flagship Investment has performed much better as
compared to market as it has increased by 20.1% in the 12 month period which is much greater
than market performance. It has helped the company to provide the net tangible asset per share of
198.2 cents representing an increase of 8.5%. Net Tangible asset of 198.2 cents per share is after
the dividend of 7.5 cents per share paid to the shareholders of the company. Chairman has
mentioned in its report that Flagship Investment pays more focus on the quality companies that
have ability to prosper and proper stable earnings and dividend per year. Flagship Investment
tabler-icon-diamond-filled.svg

Paraphrase This Document

Need a fresh take? Get an instant paraphrase of this document with our AI Paraphraser
Document Page
5
makes sure that their investment grows with steady pace so that company can provide better
return to their investors and capital invested can be appreciated with time (Annual Report, 2017).
As per information provided in Chairman’s message, company has provided final
dividend of 3.75 cents and interim dividend of 3.75 cents in year 2017 which amount to 7.50
cents in total. On the basis of comprehensive income after tax the earnings per share of company
was 22.2 cents in year 2017 and 9.4 cents in year 2017, increase of 136.00% in year 2017. It
means company has outperformed in year 2018 as compared to year 2017 (Annual Report,
2017).
Information related to market, chairman has mentioned that in recent period the portfolio
composition of the company has been changed as investment strategy of company is currently
focusing on businesses that have very long duration of growth runways such as Xero, Pushpay
and Netwealth. In addition to this, portfolio prospects of the company continue to retain its
exposure to the quality growth companies as for year 2017 and coming years (Schlichting, 2013).
As per view of portfolio management committee, companies that have strong market position,
very strong balance sheet and well maintained management will provide better return as compare
to other companies. Investment management team of Flagship Investment is led by Dr Manny
Pohl and his teams of highly professional employees that are committed to improve the returns
on the investment through making investment in such securities that have positive returns and
strong market growth (Annual Report, 2017).
Part 3: Key Financial Ratios of Flagship investment for year 2016 and 2017
Financial Data used to calculate the ratios
Financial Items Comments 2017 2016
Amount in $ '000
Net profit after tax
(It include tax credit as
well)
$
1,000.00
$
742.00
Shareholder's Equity
$
43,849.00
$
43,157.00
Total Revenue and other
income
$
1,580.00
$
1,584.00
Current Assets
$
47,311.00
$
46,382.00
Current Liabilities
$
3,462.00
$
3,225.00
Total Liabilities
$
3,462.00
$
3,225.00
Shareholder's Equity
$
43,849.00
$
43,157.00
Total Assets
$
47,311.00
$
46,382.00
Account Receivables $318.00 $304.00
Document Page
6
(Annual Report, 2017)
Profitability Ratios
Ratios Formula 2017 2016
Return on Equity Net profit after tax/Shareholder's Equity 2.28% 1.72%
Net Profit Net profit after tax/Total Revenue
including other income 63.29% 46.84%
(Moles and Kidwekk, 2011)
2017 2016
0.00%
10.00%
20.00%
30.00%
40.00%
50.00%
60.00%
70.00%
2.28% 1.72%
63.29%
46.84%
Profitability Ratios
Percentage
Liquidity Ratios
Liquidity Ratios
Ratios Formula 2017 2016
Current Ratio Current Assets 13.67 14.38
Quick Ratio Quick Assets 13.67 14.38
(Krantz, 2016)
Document Page
7
2017 2016
13.20
13.40
13.60
13.80
14.00
14.20
14.40
14.60
13.67
14.38
13.67
14.38
Liquidity Analysis
Times
Solvency Ratios
Solvency Ratios
Ratios Formula 2017 2016
Debt Equity Ratio Total Liabilities/Shareholders Equity 7.90% 7.47%
Debt Ratio Total Liabilities/Total Asset 7.32% 6.95%
(Damodaran, 2011)
2017 2016
6.40%
6.60%
6.80%
7.00%
7.20%
7.40%
7.60%
7.80%
8.00%
Solvency Ratios
Percentage
tabler-icon-diamond-filled.svg

Paraphrase This Document

Need a fresh take? Get an instant paraphrase of this document with our AI Paraphraser
Document Page
8
Asset Management Ratios
Asset Management Ratio
Ratios Formula 2017 2016
Account Receivables turnover ratio Total revenue /Account Receivables 4.97 5.21
Asset Turnover ratio Total revenue /Assets 0.03 0.03
(Davies and Crawford, 2011)
2017 2016
0.00
1.00
2.00
3.00
4.00
5.00
6.00
Asset Management Ratio
Part 4: Overall assessment of the company and its future prospects
The overall analysis shows that financial performance of the company is very strong as
company has been able to convert more than 50% of earnings into net income and it has enough
current assets to pay for current liabilities. Liquidity ratios show that company does not use
inventory as company uses its non-current assets as the source of their income. Current ratio of
13.67times shows that company has 13 times more assets to pay for its current liabilities. Return
on equity shows that company fails to provide enough return to its equity shareholders but
company provides enough dividends to their shareholders. Debt to equity ratios reveals strong
solvency position of the company as most of the assets of the company has been financed
through equity capital. Analysis indicates that future prospects of the company is very bright and
company will going to improve its performance if it go forward with same pace (Brigham and
Michael, 2013).
Conclusion
Financial statement and investment analysis of Flagship Investments reveals that
company performance in year 2017 has been improved as compared to year 2016. Also it is
Document Page
9
highly recommended to the investors to invest in the company and hold the shares to earn better
holding period return.
Document Page
10
References
Annual Report. 2017. Flagship Investments. [Online]. Available at:
https://www.flagshipinvestments.com.au/wp-content/uploads/2017/09/FSI-2017-Annual-Report-
FINAL.pdf [Accessed on: 3 April, 2019].
Brigham, F., and Michael C. 2013. Financial management: Theory & practice. Canada: Cengage
Learning.
Damodaran, A, 2011. Applied corporate finance. USA: John Wiley & sons.
Davies, T. and Crawford, I., 2011. Business accounting and finance. USA: Pearson.
Krantz, M. 2016. Fundamental Analysis for Dummies. USA: John Wiley & Sons.
Moles, P. and Kidwekk, D. 2011. Corporate finance. USA: John Wiley &sons.
Schlichting, T. 2013. Fundamental Analysis, Behavioral Finance and Technical Analysis on the
Stock Market. Australia: GRIN Verlag.
chevron_up_icon
1 out of 10
circle_padding
hide_on_mobile
zoom_out_icon
[object Object]