Financial Analysis for Managers: Construction Company Report
VerifiedAdded on 2023/06/10
|28
|6853
|117
Report
AI Summary
This report presents a financial analysis of Alpine Construction Ltd. and Maple Builders Ltd., prepared for Taggart Transpacific Ltd. to assist in investment decisions. The analysis compares the companies' performance over two financial years (2017-2018) using eleven financial ratios, including profitability, asset utilization, financial market, working capital management, and solvency ratios. The report highlights the declining profitability of Alpine Construction, while Maple Builders demonstrates improvements. The analysis includes industry benchmarking, a solvency test for Alpine, and a discussion of the limitations of the analysis, emphasizing the need for more than two years' data for comprehensive evaluation. The report concludes with findings and recommendations for the board of directors of Taggart Transpacific Ltd.
1
DIPLOMAINBUSINESS&ENTERPRISE MANAGEMENT(L7)
FINANCIALANALYSISFORMANAGERS
UNIT11624-
DEMONSTRATEANDAPPLYKNOWLE
DGEOF FINANCIALANALYSIS (V8)
(10 CREDITS,L5)
&
UNIT9685-
WRITEANANALYTICALREPORT (V7)
(5 CREDITS,L5)
ASSESSMENT2:A SSIGNMENT/R EPORT
DUE:26/06/2018
Date of
Submission:
25/06/18
Name:Keyur Solanki
Student ID:181003C
Tutor: Bryce Hartel and Aimen Ubaid
Keyur solanki: 181008C
Paraphrase This Document
Need a fresh take? Get an instant paraphrase of this document with our AI Paraphraser
2
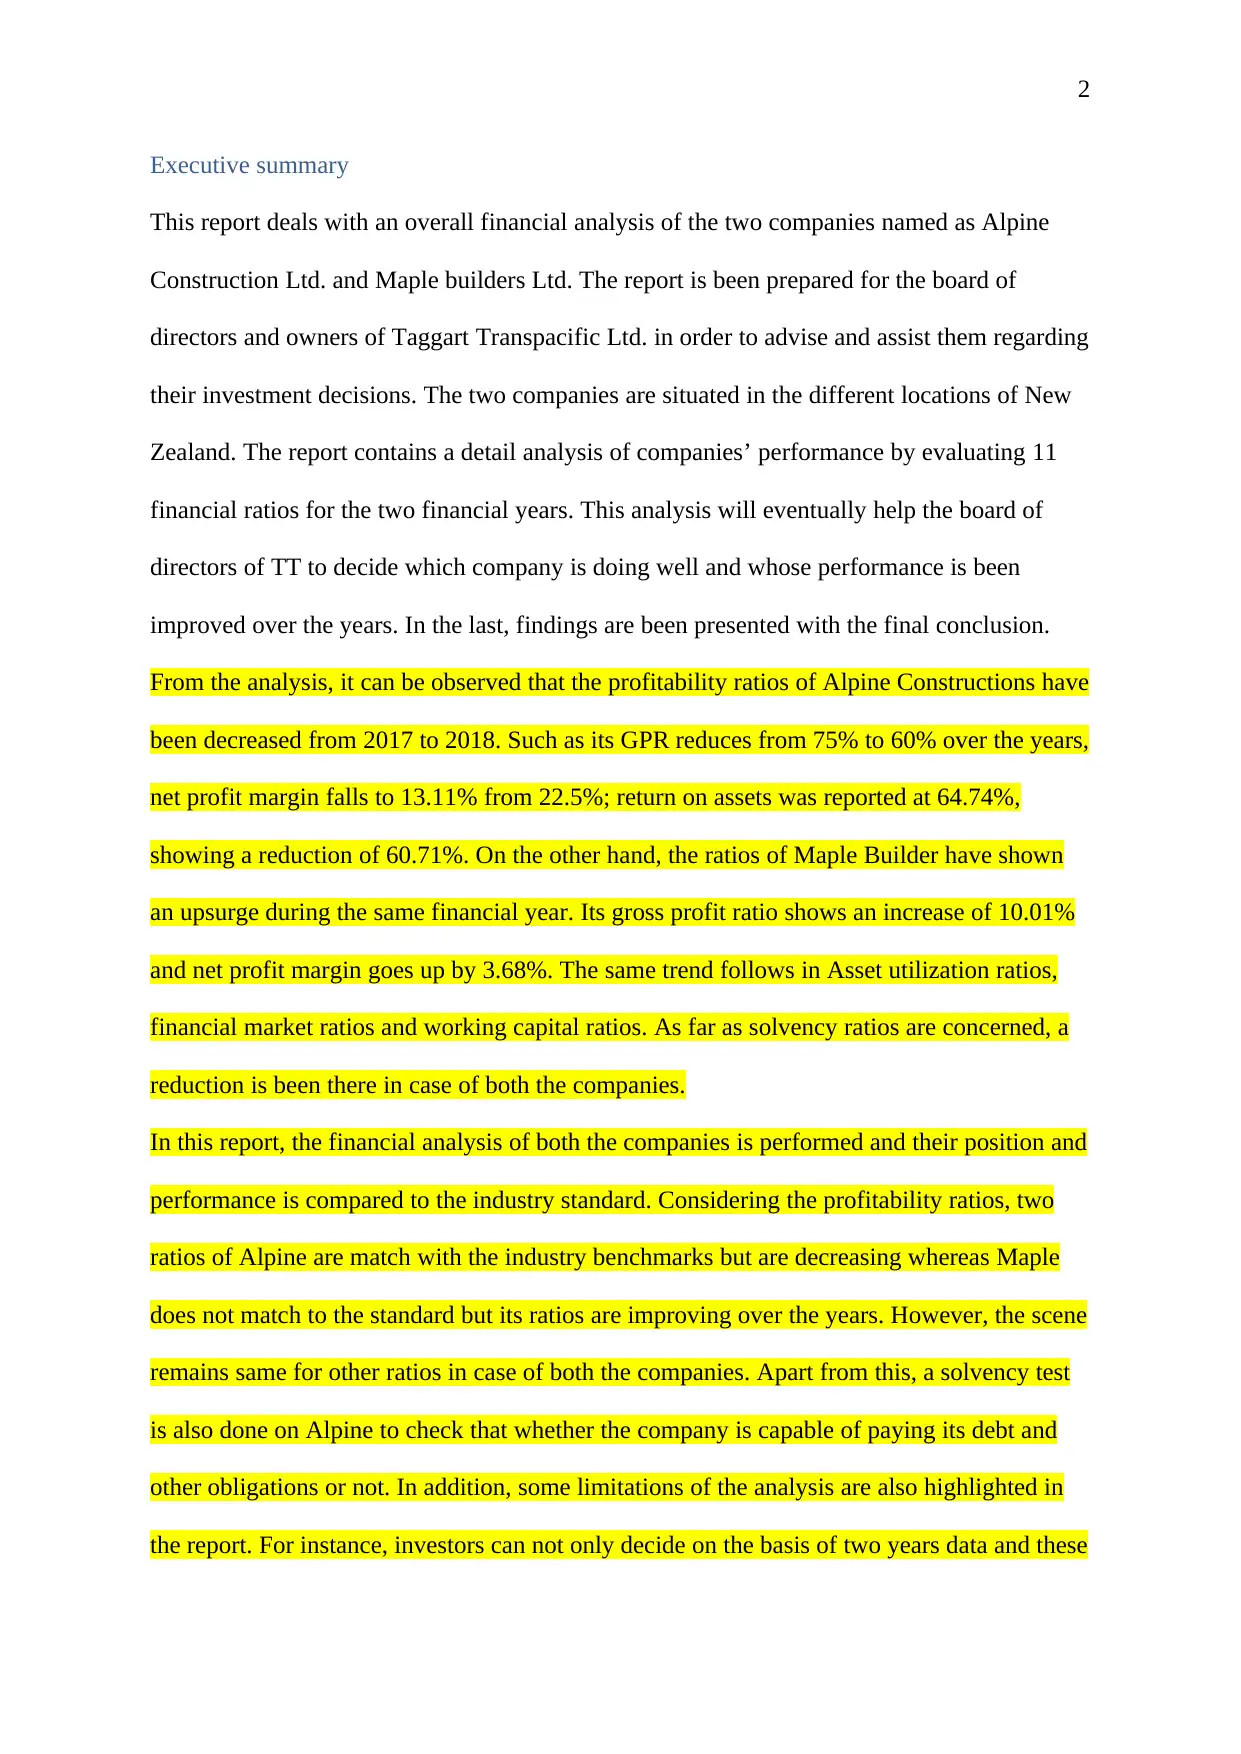
Executive summary
This report deals with an overall financial analysis of the two companies named as Alpine
Construction Ltd. and Maple builders Ltd. The report is been prepared for the board of
directors and owners of Taggart Transpacific Ltd. in order to advise and assist them regarding
their investment decisions. The two companies are situated in the different locations of New
Zealand. The report contains a detail analysis of companies’ performance by evaluating 11
financial ratios for the two financial years. This analysis will eventually help the board of
directors of TT to decide which company is doing well and whose performance is been
improved over the years. In the last, findings are been presented with the final conclusion.
From the analysis, it can be observed that the profitability ratios of Alpine Constructions have
been decreased from 2017 to 2018. Such as its GPR reduces from 75% to 60% over the years,
net profit margin falls to 13.11% from 22.5%; return on assets was reported at 64.74%,
showing a reduction of 60.71%. On the other hand, the ratios of Maple Builder have shown
an upsurge during the same financial year. Its gross profit ratio shows an increase of 10.01%
and net profit margin goes up by 3.68%. The same trend follows in Asset utilization ratios,
financial market ratios and working capital ratios. As far as solvency ratios are concerned, a
reduction is been there in case of both the companies.
In this report, the financial analysis of both the companies is performed and their position and
performance is compared to the industry standard. Considering the profitability ratios, two
ratios of Alpine are match with the industry benchmarks but are decreasing whereas Maple
does not match to the standard but its ratios are improving over the years. However, the scene
remains same for other ratios in case of both the companies. Apart from this, a solvency test
is also done on Alpine to check that whether the company is capable of paying its debt and
other obligations or not. In addition, some limitations of the analysis are also highlighted in
the report. For instance, investors can not only decide on the basis of two years data and these

3
ratios are not sufficient to judge a company’s position and performance. From this analysis,
investors can only figure out one thing that Alpine’s ratios has decreased over the years and
Maple’s numbers have increased.
Contents
ratios are not sufficient to judge a company’s position and performance. From this analysis,
investors can only figure out one thing that Alpine’s ratios has decreased over the years and
Maple’s numbers have increased.
Contents
⊘ This is a preview!⊘
Do you want full access?
Subscribe today to unlock all pages.
Trusted by 1+ million students worldwide
4
Executive summary....................................................................................................................2
1.0...............................................................................................................................................5
1.1 Profitability.......................................................................................................................5
Gross profit ratio.................................................................................................................5
Net profit ratio....................................................................................................................6
Return on Total Asset.........................................................................................................6
1.2 Working capital management...........................................................................................7
Current ratio........................................................................................................................7
Quick ratio..........................................................................................................................8
1.3 Asset utilization................................................................................................................8
Accounts receivables turnover ratio...................................................................................8
Inventory turnover ratio......................................................................................................9
1.4 Financial markets..............................................................................................................9
Earnings per share...............................................................................................................9
Dividend per share............................................................................................................10
1.5 Solvency.........................................................................................................................11
Debt to assets ratios..........................................................................................................11
Debt to equity ratio...........................................................................................................11
1.6 Industry Benchmarking..................................................................................................12
2 Conclusions...........................................................................................................................13
3 Recommendation...................................................................................................................14
3.1 Which company to Divest from.....................................................................................14
3.2 Suggestions for improvements.......................................................................................15
4.0.............................................................................................................................................15
4.1 Solvency Test.....................................................................................................................15
4.2 Conclusion......................................................................................................................16
5 Limitation & Variations........................................................................................................16
Paraphrase This Document
Need a fresh take? Get an instant paraphrase of this document with our AI Paraphraser
5
5.1 Limitations......................................................................................................................16
5.2 Variations for different users..........................................................................................16
6.0 Appendix 1:........................................................................................................................17
6.1 Report Planning..............................................................................................................17
6.2 Purpose...........................................................................................................................17
6.3 Audience.........................................................................................................................17
6.4 Scope..............................................................................................................................17
6.5 Structure of the report.....................................................................................................18
7.0 Appendix 2.........................................................................................................................19
References................................................................................................................................20
List of Tables
Table 1: Gross Profit Ratio........................................................................................................4
Table 2: Net Profit Margin.........................................................................................................4
Table 3: Return on Total Assets.................................................................................................5
Table 4: Current ratios...............................................................................................................5
Table 5: Quick ratio...................................................................................................................6
Table 6: Accounts Receivables turnover ratio...........................................................................6
Table 7: Inventory Turnover ratio..............................................................................................6
Table 8: Earnings per share........................................................................................................7
Table 9: Dividend per share.......................................................................................................7
Table 10: Debt to total asset ratio..............................................................................................7
Table 11: Debt to equity ratio....................................................................................................8
Table 12: Industry Benchmarking..............................................................................................9
Introduction
6
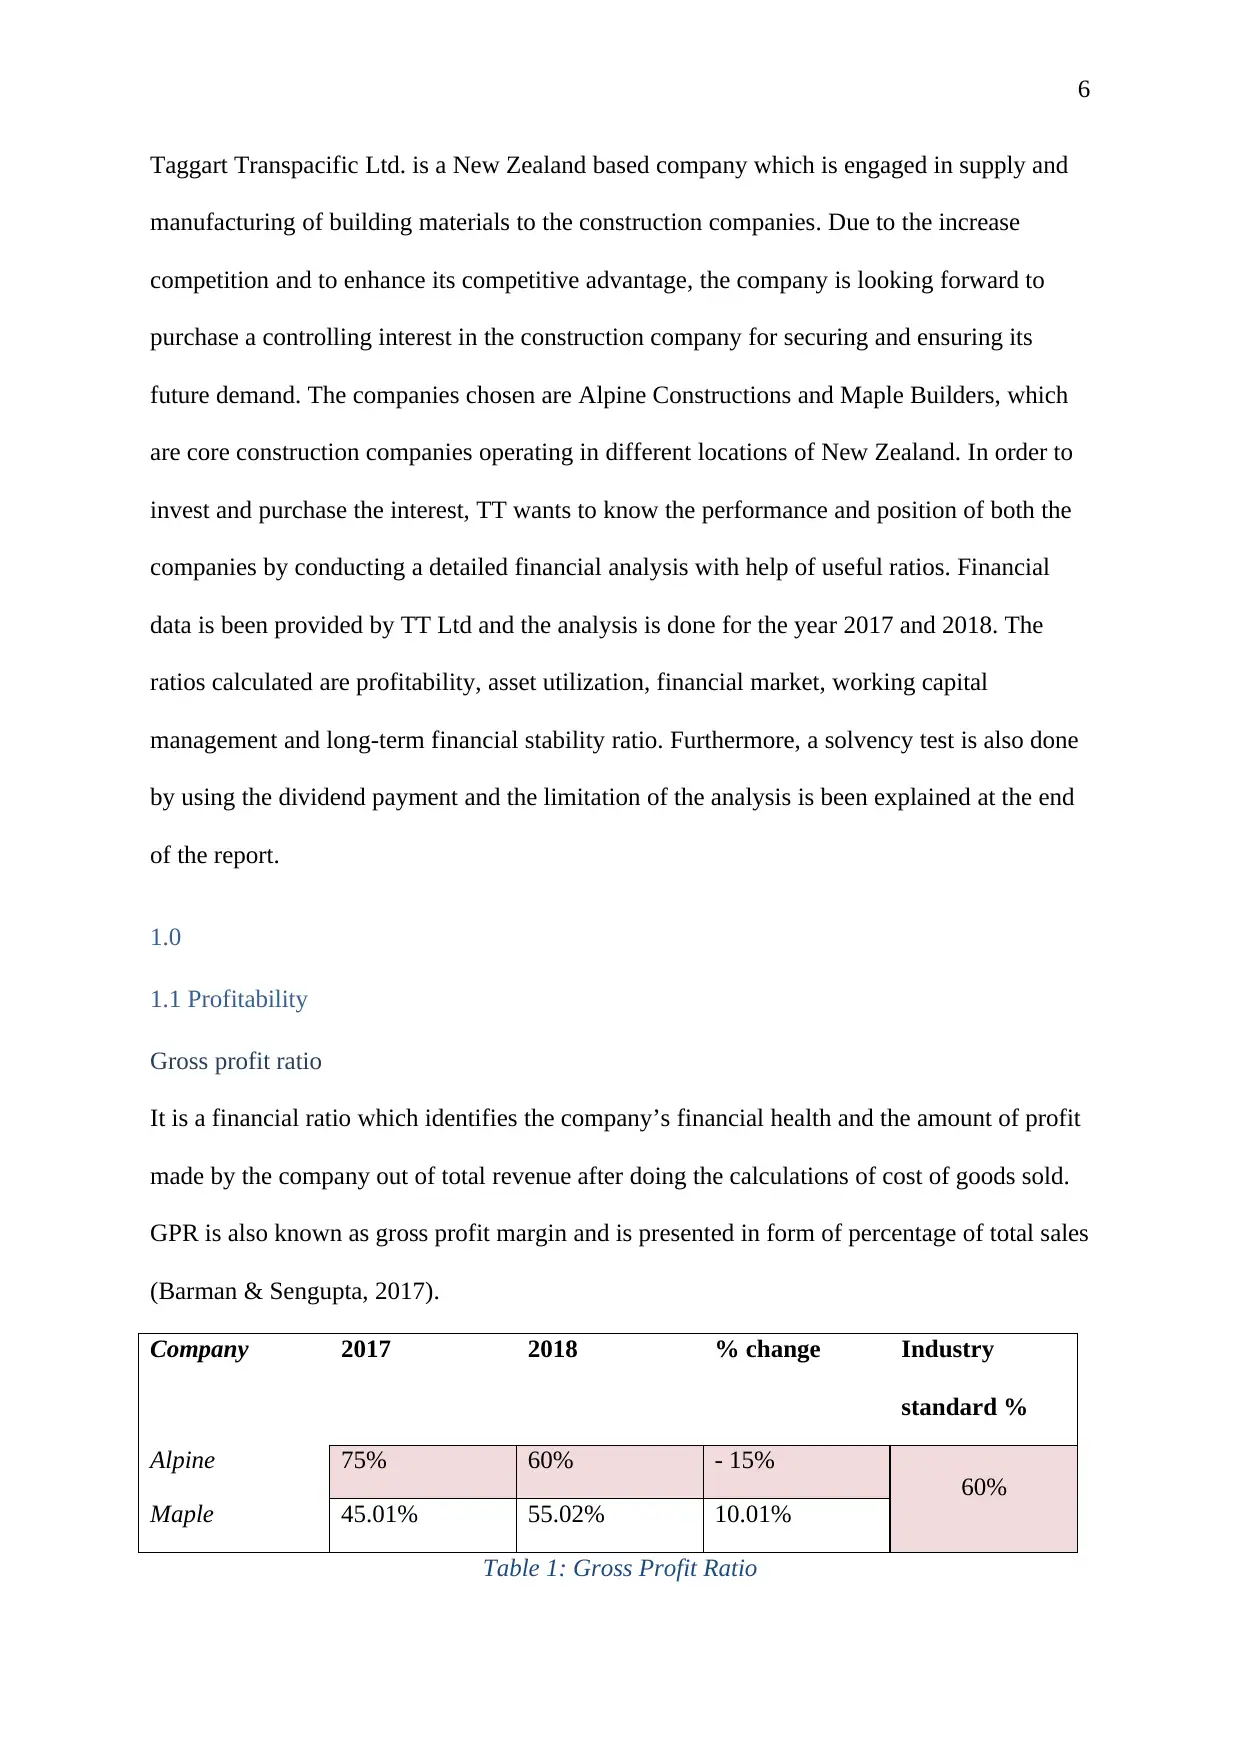
Taggart Transpacific Ltd. is a New Zealand based company which is engaged in supply and
manufacturing of building materials to the construction companies. Due to the increase
competition and to enhance its competitive advantage, the company is looking forward to
purchase a controlling interest in the construction company for securing and ensuring its
future demand. The companies chosen are Alpine Constructions and Maple Builders, which
are core construction companies operating in different locations of New Zealand. In order to
invest and purchase the interest, TT wants to know the performance and position of both the
companies by conducting a detailed financial analysis with help of useful ratios. Financial
data is been provided by TT Ltd and the analysis is done for the year 2017 and 2018. The
ratios calculated are profitability, asset utilization, financial market, working capital
management and long-term financial stability ratio. Furthermore, a solvency test is also done
by using the dividend payment and the limitation of the analysis is been explained at the end
of the report.
1.0
1.1 Profitability
Gross profit ratio
It is a financial ratio which identifies the company’s financial health and the amount of profit
made by the company out of total revenue after doing the calculations of cost of goods sold.
GPR is also known as gross profit margin and is presented in form of percentage of total sales
(Barman & Sengupta, 2017).
Company 2017 2018 % change Industry
standard %
Alpine 75% 60% - 15%
60%
Maple 45.01% 55.02% 10.01%
Table 1: Gross Profit Ratio
⊘ This is a preview!⊘
Do you want full access?
Subscribe today to unlock all pages.
Trusted by 1+ million students worldwide
7
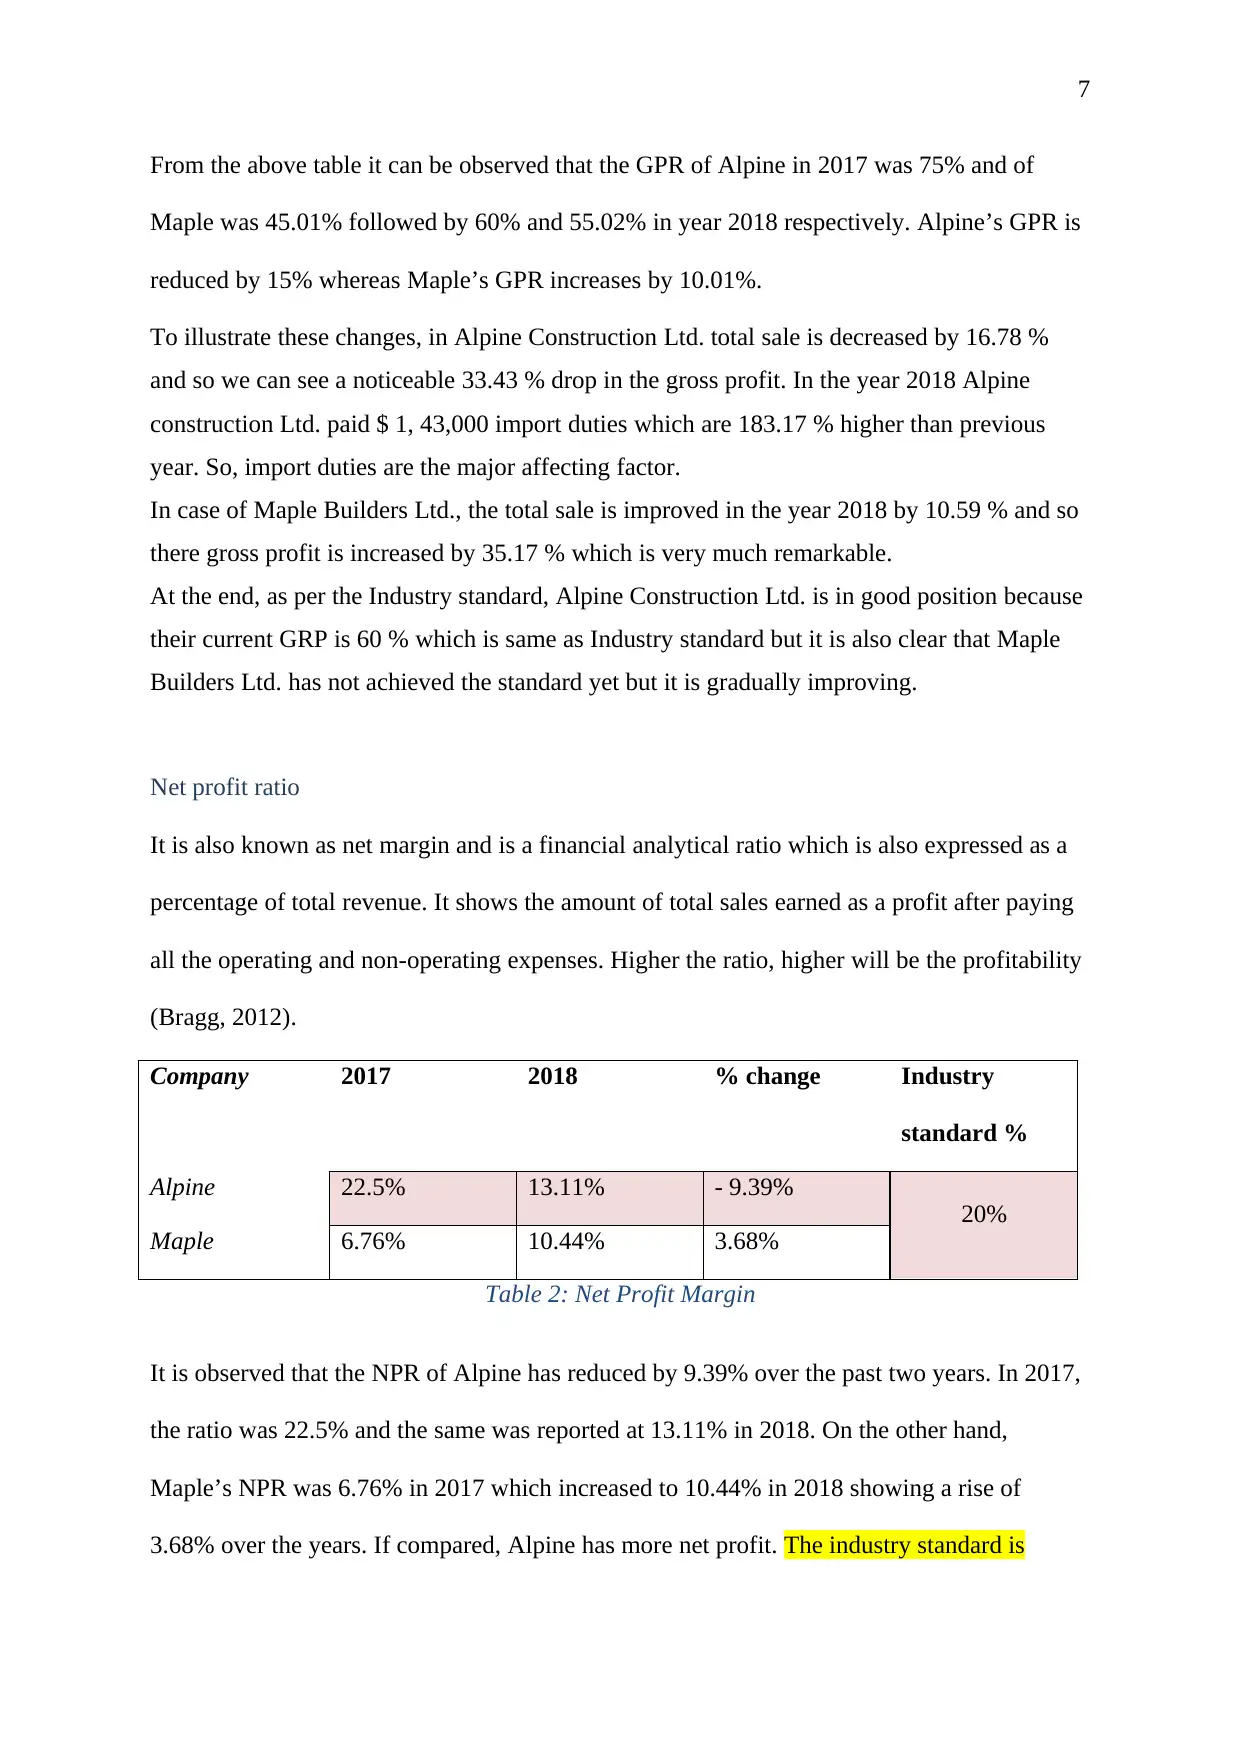
From the above table it can be observed that the GPR of Alpine in 2017 was 75% and of
Maple was 45.01% followed by 60% and 55.02% in year 2018 respectively. Alpine’s GPR is
reduced by 15% whereas Maple’s GPR increases by 10.01%.
To illustrate these changes, in Alpine Construction Ltd. total sale is decreased by 16.78 %
and so we can see a noticeable 33.43 % drop in the gross profit. In the year 2018 Alpine
construction Ltd. paid $ 1, 43,000 import duties which are 183.17 % higher than previous
year. So, import duties are the major affecting factor.
In case of Maple Builders Ltd., the total sale is improved in the year 2018 by 10.59 % and so
there gross profit is increased by 35.17 % which is very much remarkable.
At the end, as per the Industry standard, Alpine Construction Ltd. is in good position because
their current GRP is 60 % which is same as Industry standard but it is also clear that Maple
Builders Ltd. has not achieved the standard yet but it is gradually improving.
Net profit ratio
It is also known as net margin and is a financial analytical ratio which is also expressed as a
percentage of total revenue. It shows the amount of total sales earned as a profit after paying
all the operating and non-operating expenses. Higher the ratio, higher will be the profitability
(Bragg, 2012).
Company 2017 2018 % change Industry
standard %
Alpine 22.5% 13.11% - 9.39%
20%
Maple 6.76% 10.44% 3.68%
Table 2: Net Profit Margin
It is observed that the NPR of Alpine has reduced by 9.39% over the past two years. In 2017,
the ratio was 22.5% and the same was reported at 13.11% in 2018. On the other hand,
Maple’s NPR was 6.76% in 2017 which increased to 10.44% in 2018 showing a rise of
3.68% over the years. If compared, Alpine has more net profit. The industry standard is
Paraphrase This Document
Need a fresh take? Get an instant paraphrase of this document with our AI Paraphraser
8
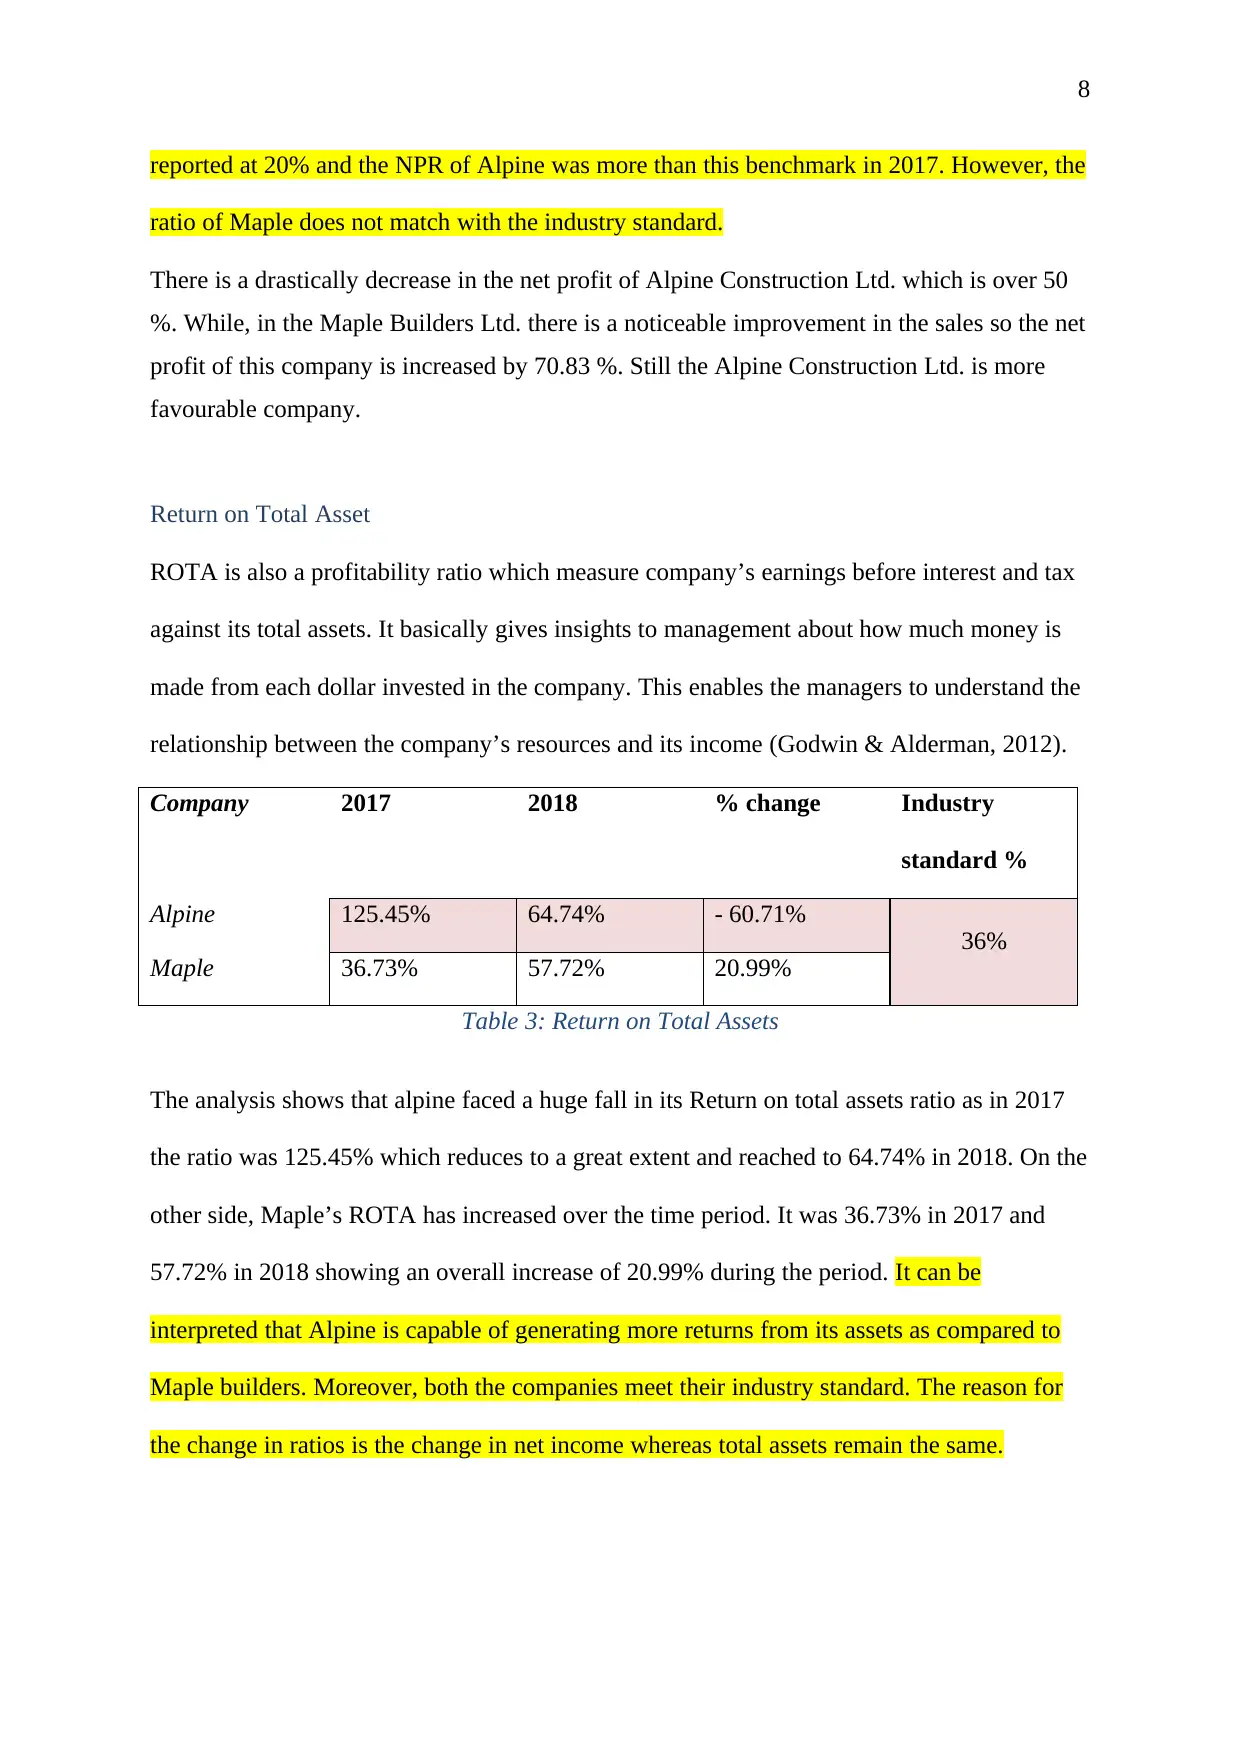
reported at 20% and the NPR of Alpine was more than this benchmark in 2017. However, the
ratio of Maple does not match with the industry standard.
There is a drastically decrease in the net profit of Alpine Construction Ltd. which is over 50
%. While, in the Maple Builders Ltd. there is a noticeable improvement in the sales so the net
profit of this company is increased by 70.83 %. Still the Alpine Construction Ltd. is more
favourable company.
Return on Total Asset
ROTA is also a profitability ratio which measure company’s earnings before interest and tax
against its total assets. It basically gives insights to management about how much money is
made from each dollar invested in the company. This enables the managers to understand the
relationship between the company’s resources and its income (Godwin & Alderman, 2012).
Company 2017 2018 % change Industry
standard %
Alpine 125.45% 64.74% - 60.71%
36%
Maple 36.73% 57.72% 20.99%
Table 3: Return on Total Assets
The analysis shows that alpine faced a huge fall in its Return on total assets ratio as in 2017
the ratio was 125.45% which reduces to a great extent and reached to 64.74% in 2018. On the
other side, Maple’s ROTA has increased over the time period. It was 36.73% in 2017 and
57.72% in 2018 showing an overall increase of 20.99% during the period. It can be
interpreted that Alpine is capable of generating more returns from its assets as compared to
Maple builders. Moreover, both the companies meet their industry standard. The reason for
the change in ratios is the change in net income whereas total assets remain the same.
9
1.2 Working capital management
Current ratio
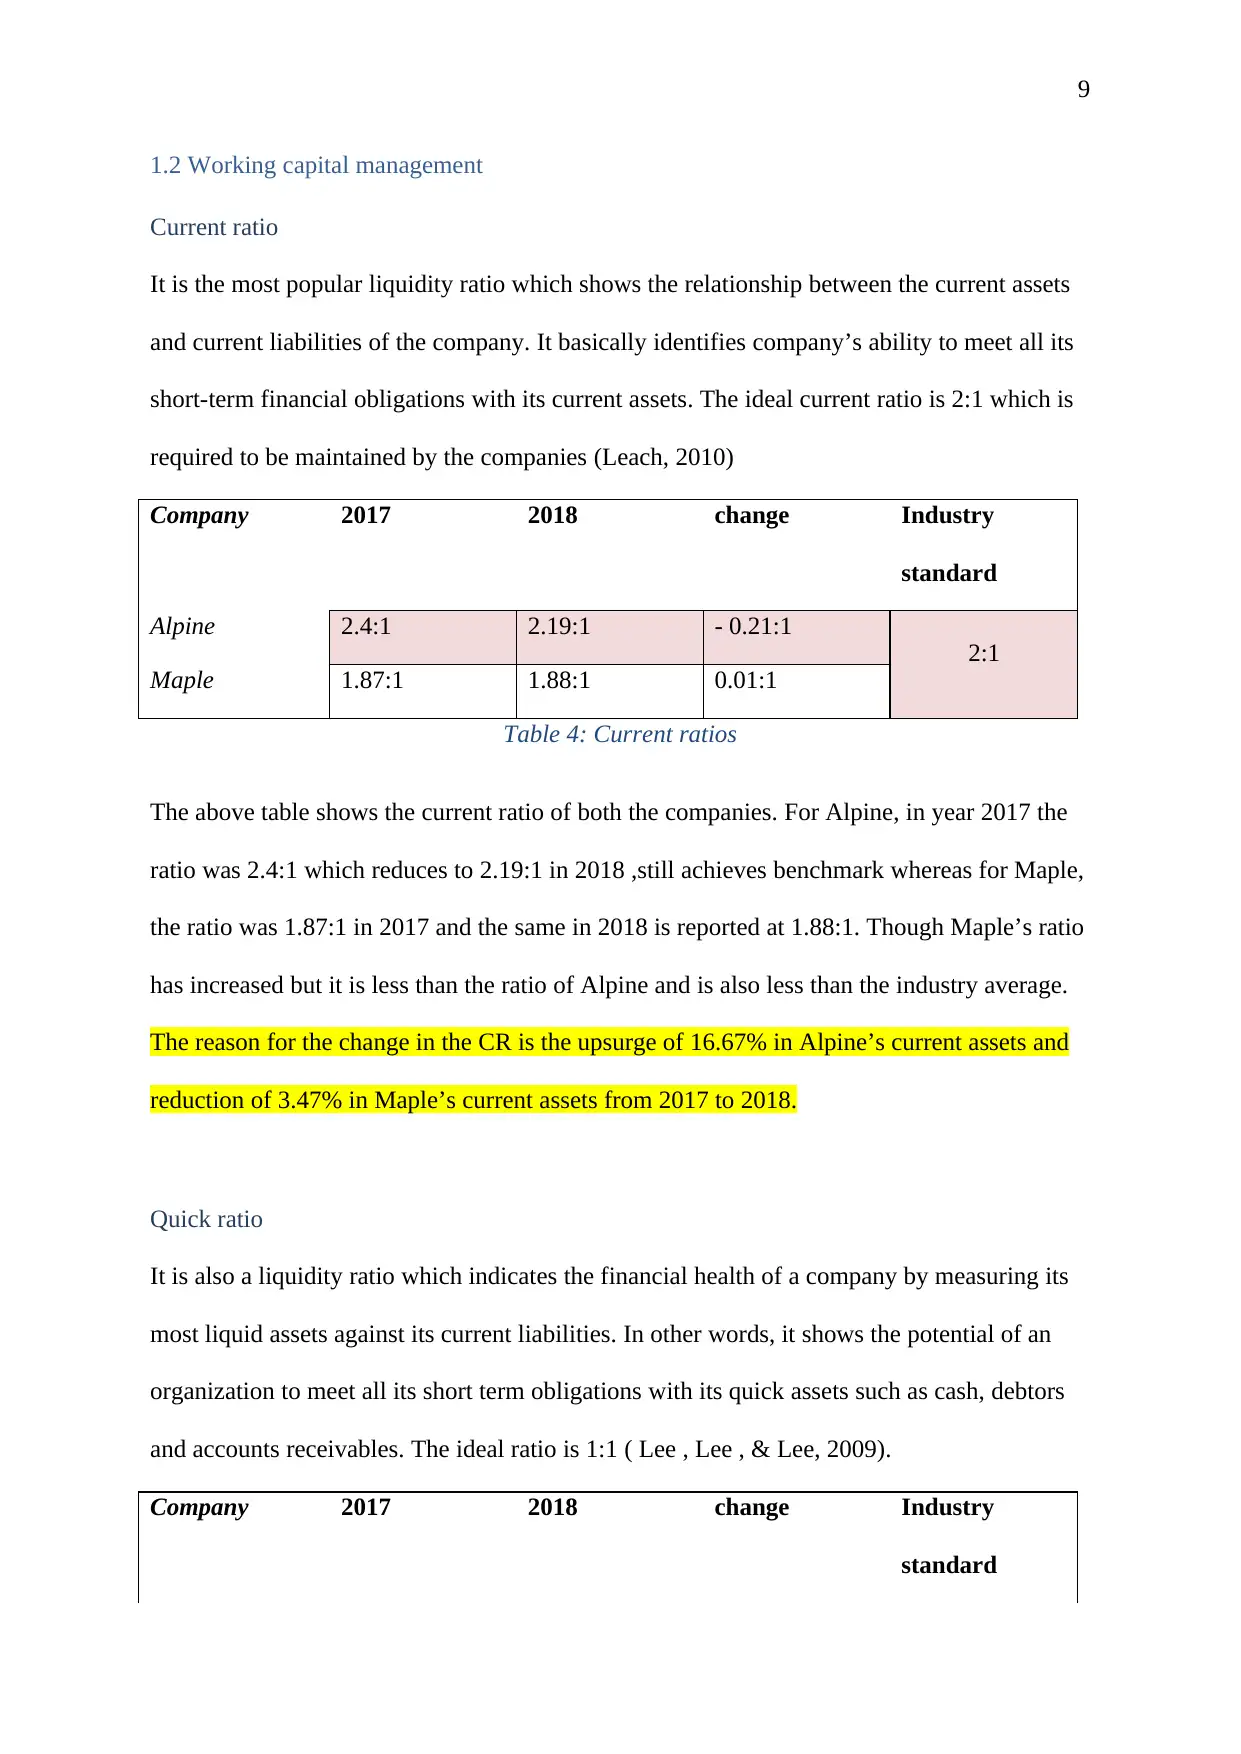
It is the most popular liquidity ratio which shows the relationship between the current assets
and current liabilities of the company. It basically identifies company’s ability to meet all its
short-term financial obligations with its current assets. The ideal current ratio is 2:1 which is
required to be maintained by the companies (Leach, 2010)
Company 2017 2018 change Industry
standard
Alpine 2.4:1 2.19:1 - 0.21:1
2:1
Maple 1.87:1 1.88:1 0.01:1
Table 4: Current ratios
The above table shows the current ratio of both the companies. For Alpine, in year 2017 the
ratio was 2.4:1 which reduces to 2.19:1 in 2018 ,still achieves benchmark whereas for Maple,
the ratio was 1.87:1 in 2017 and the same in 2018 is reported at 1.88:1. Though Maple’s ratio
has increased but it is less than the ratio of Alpine and is also less than the industry average.
The reason for the change in the CR is the upsurge of 16.67% in Alpine’s current assets and
reduction of 3.47% in Maple’s current assets from 2017 to 2018.
Quick ratio
It is also a liquidity ratio which indicates the financial health of a company by measuring its
most liquid assets against its current liabilities. In other words, it shows the potential of an
organization to meet all its short term obligations with its quick assets such as cash, debtors
and accounts receivables. The ideal ratio is 1:1 ( Lee , Lee , & Lee, 2009).
Company 2017 2018 change Industry
standard
1.2 Working capital management
Current ratio
It is the most popular liquidity ratio which shows the relationship between the current assets
and current liabilities of the company. It basically identifies company’s ability to meet all its
short-term financial obligations with its current assets. The ideal current ratio is 2:1 which is
required to be maintained by the companies (Leach, 2010)
Company 2017 2018 change Industry
standard
Alpine 2.4:1 2.19:1 - 0.21:1
2:1
Maple 1.87:1 1.88:1 0.01:1
Table 4: Current ratios
The above table shows the current ratio of both the companies. For Alpine, in year 2017 the
ratio was 2.4:1 which reduces to 2.19:1 in 2018 ,still achieves benchmark whereas for Maple,
the ratio was 1.87:1 in 2017 and the same in 2018 is reported at 1.88:1. Though Maple’s ratio
has increased but it is less than the ratio of Alpine and is also less than the industry average.
The reason for the change in the CR is the upsurge of 16.67% in Alpine’s current assets and
reduction of 3.47% in Maple’s current assets from 2017 to 2018.
Quick ratio
It is also a liquidity ratio which indicates the financial health of a company by measuring its
most liquid assets against its current liabilities. In other words, it shows the potential of an
organization to meet all its short term obligations with its quick assets such as cash, debtors
and accounts receivables. The ideal ratio is 1:1 ( Lee , Lee , & Lee, 2009).
Company 2017 2018 change Industry
standard
⊘ This is a preview!⊘
Do you want full access?
Subscribe today to unlock all pages.
Trusted by 1+ million students worldwide
10
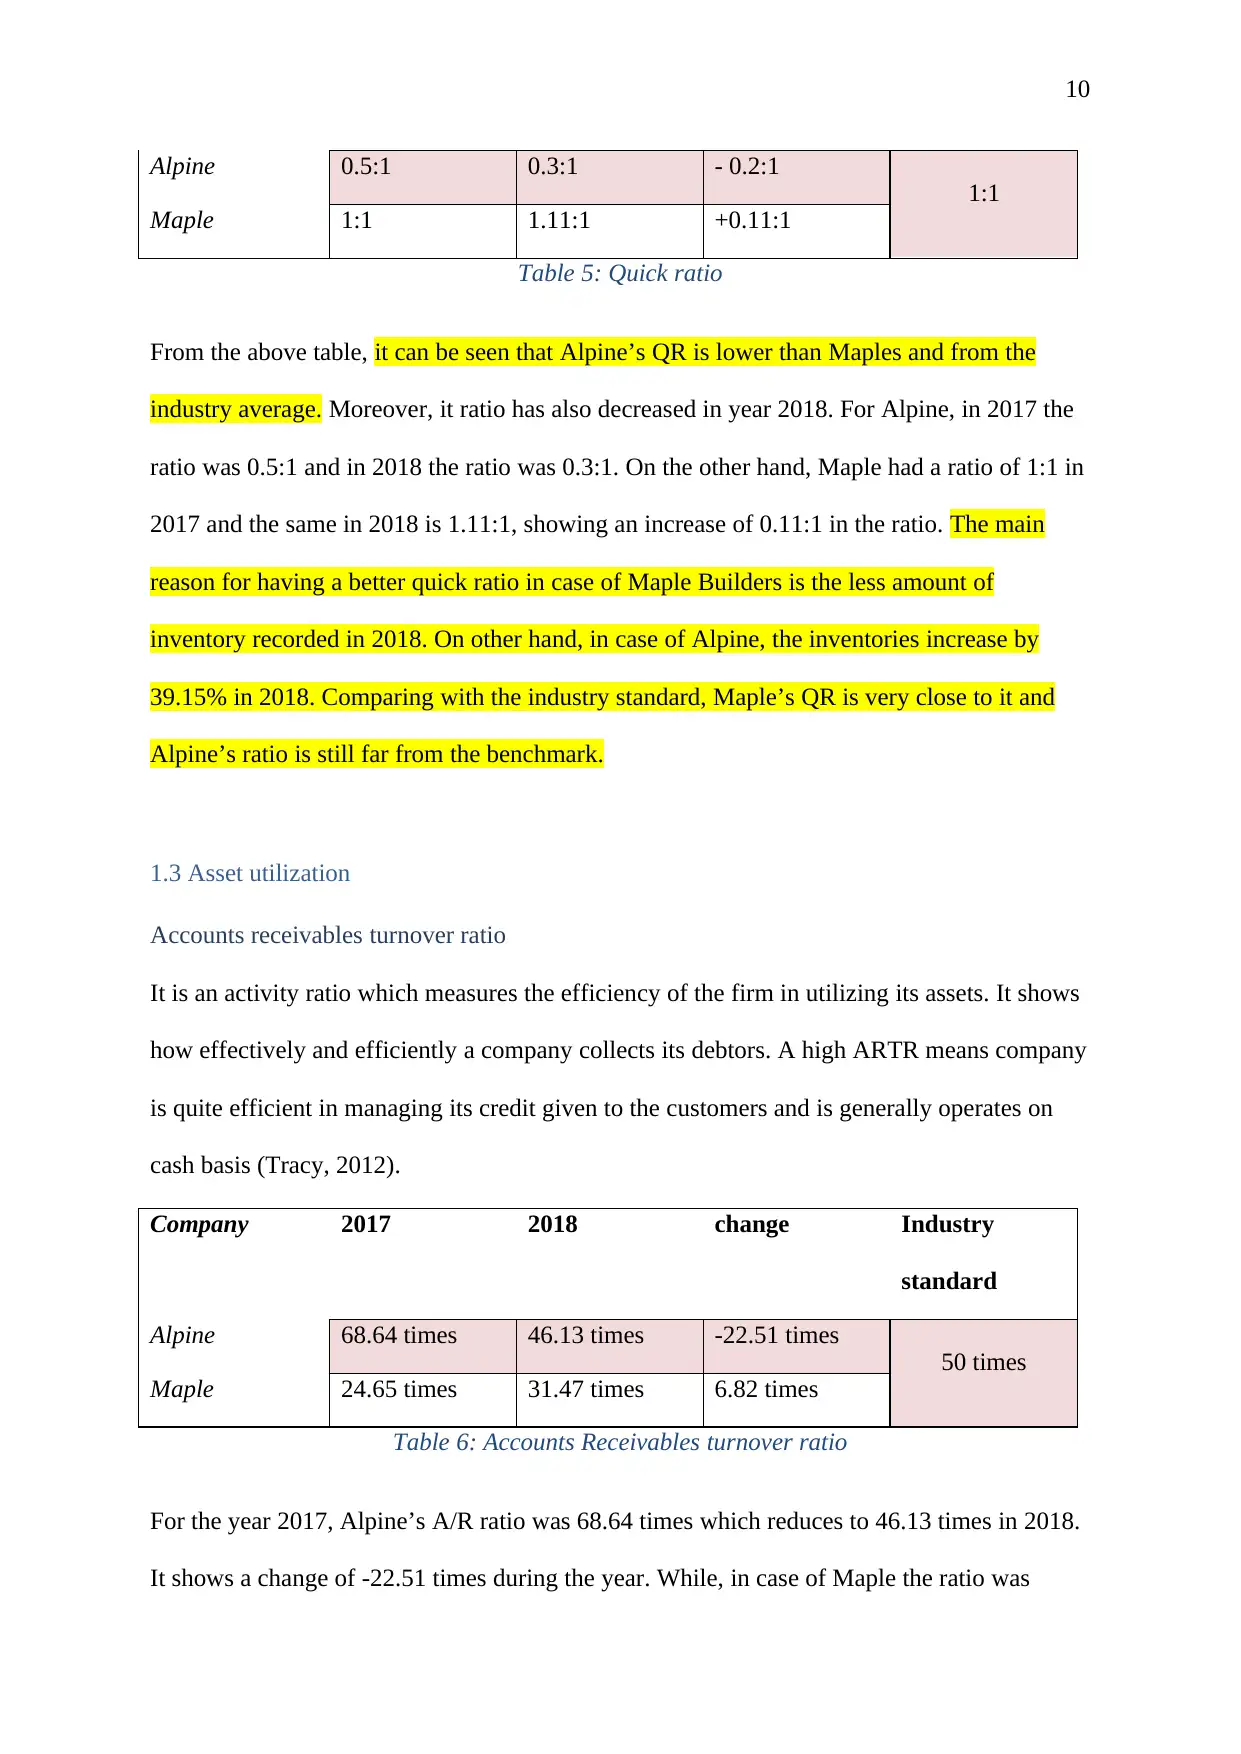
Alpine 0.5:1 0.3:1 - 0.2:1
1:1
Maple 1:1 1.11:1 +0.11:1
Table 5: Quick ratio
From the above table, it can be seen that Alpine’s QR is lower than Maples and from the
industry average. Moreover, it ratio has also decreased in year 2018. For Alpine, in 2017 the
ratio was 0.5:1 and in 2018 the ratio was 0.3:1. On the other hand, Maple had a ratio of 1:1 in
2017 and the same in 2018 is 1.11:1, showing an increase of 0.11:1 in the ratio. The main
reason for having a better quick ratio in case of Maple Builders is the less amount of
inventory recorded in 2018. On other hand, in case of Alpine, the inventories increase by
39.15% in 2018. Comparing with the industry standard, Maple’s QR is very close to it and
Alpine’s ratio is still far from the benchmark.
1.3 Asset utilization
Accounts receivables turnover ratio
It is an activity ratio which measures the efficiency of the firm in utilizing its assets. It shows
how effectively and efficiently a company collects its debtors. A high ARTR means company
is quite efficient in managing its credit given to the customers and is generally operates on
cash basis (Tracy, 2012).
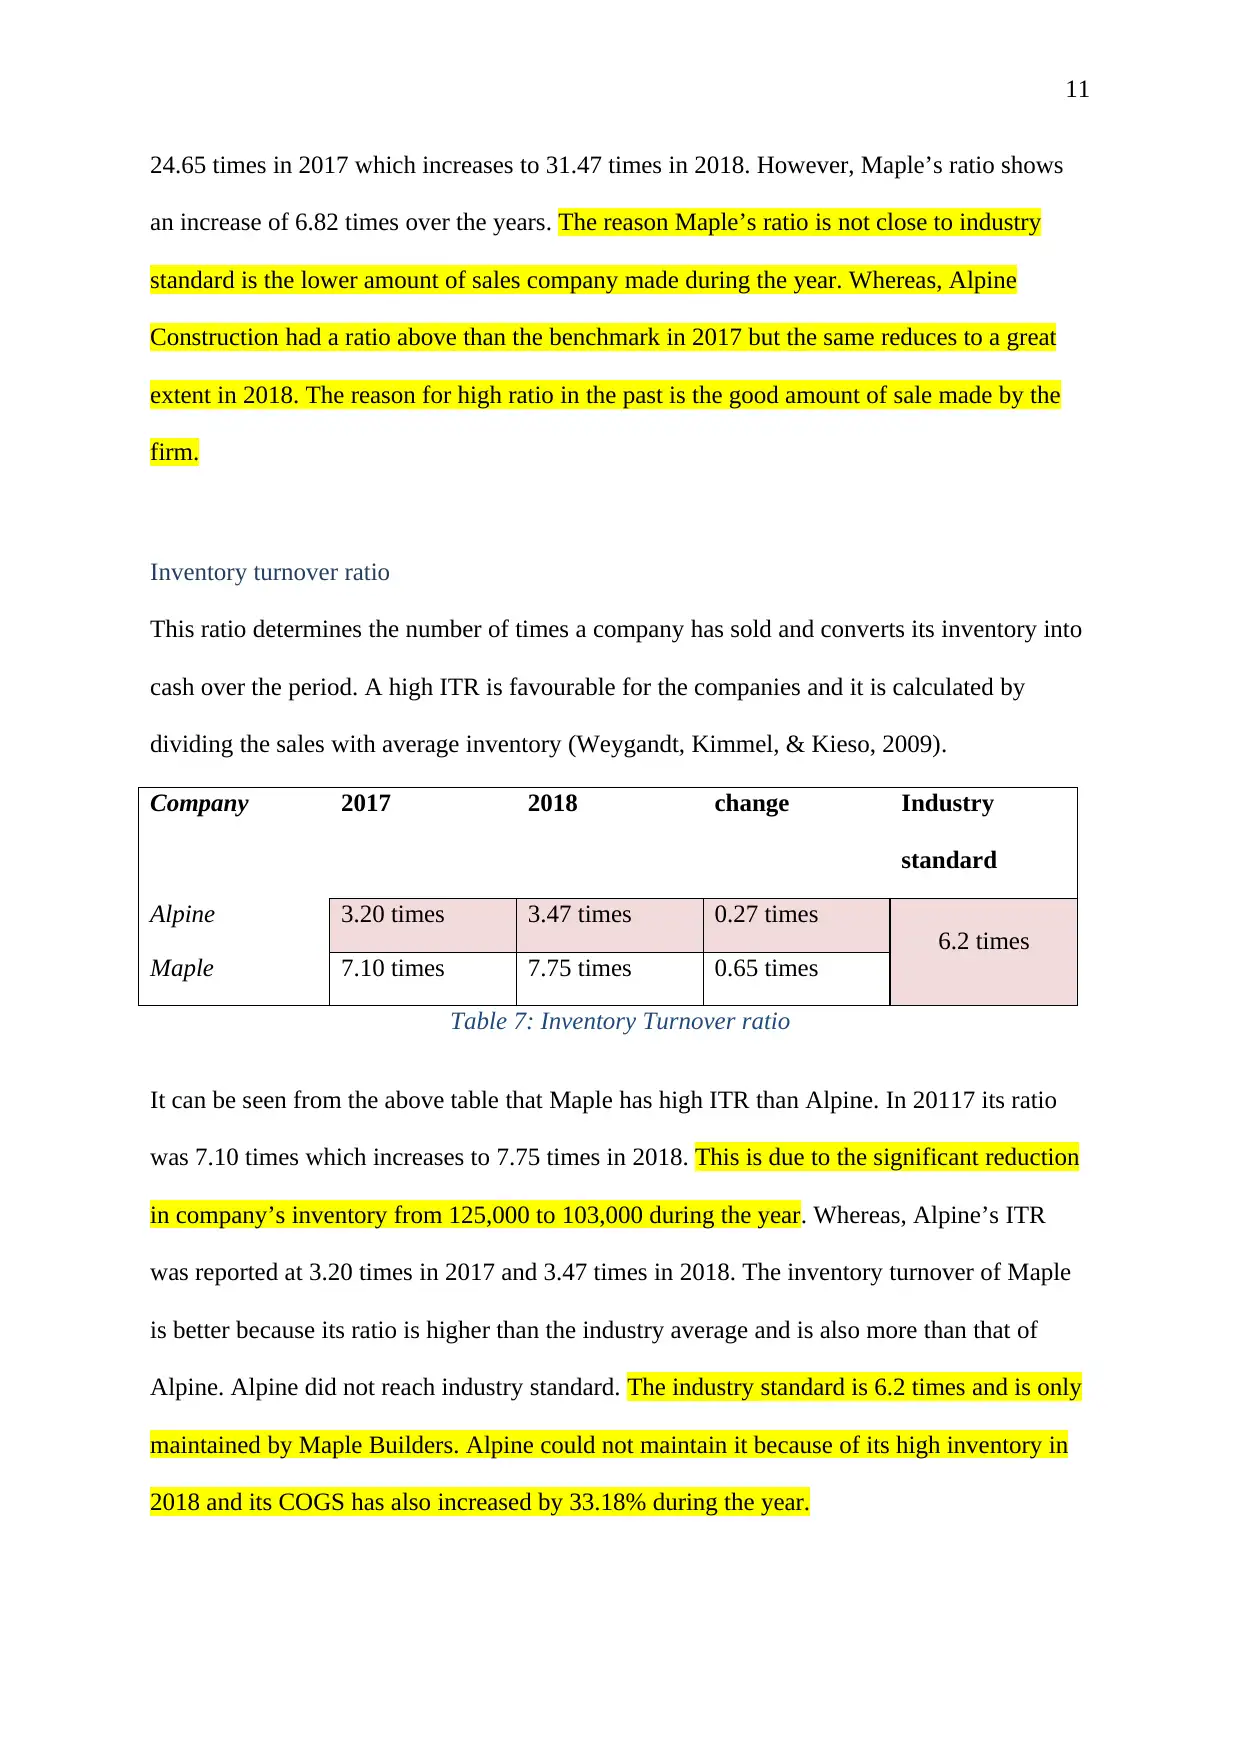
Company 2017 2018 change Industry
standard
Alpine 68.64 times 46.13 times -22.51 times
50 times
Maple 24.65 times 31.47 times 6.82 times
Table 6: Accounts Receivables turnover ratio
For the year 2017, Alpine’s A/R ratio was 68.64 times which reduces to 46.13 times in 2018.
It shows a change of -22.51 times during the year. While, in case of Maple the ratio was
Alpine 0.5:1 0.3:1 - 0.2:1
1:1
Maple 1:1 1.11:1 +0.11:1
Table 5: Quick ratio
From the above table, it can be seen that Alpine’s QR is lower than Maples and from the
industry average. Moreover, it ratio has also decreased in year 2018. For Alpine, in 2017 the
ratio was 0.5:1 and in 2018 the ratio was 0.3:1. On the other hand, Maple had a ratio of 1:1 in
2017 and the same in 2018 is 1.11:1, showing an increase of 0.11:1 in the ratio. The main
reason for having a better quick ratio in case of Maple Builders is the less amount of
inventory recorded in 2018. On other hand, in case of Alpine, the inventories increase by
39.15% in 2018. Comparing with the industry standard, Maple’s QR is very close to it and
Alpine’s ratio is still far from the benchmark.
1.3 Asset utilization
Accounts receivables turnover ratio
It is an activity ratio which measures the efficiency of the firm in utilizing its assets. It shows
how effectively and efficiently a company collects its debtors. A high ARTR means company
is quite efficient in managing its credit given to the customers and is generally operates on
cash basis (Tracy, 2012).
Company 2017 2018 change Industry
standard
Alpine 68.64 times 46.13 times -22.51 times
50 times
Maple 24.65 times 31.47 times 6.82 times
Table 6: Accounts Receivables turnover ratio
For the year 2017, Alpine’s A/R ratio was 68.64 times which reduces to 46.13 times in 2018.
It shows a change of -22.51 times during the year. While, in case of Maple the ratio was
Paraphrase This Document
Need a fresh take? Get an instant paraphrase of this document with our AI Paraphraser
11
24.65 times in 2017 which increases to 31.47 times in 2018. However, Maple’s ratio shows
an increase of 6.82 times over the years. The reason Maple’s ratio is not close to industry
standard is the lower amount of sales company made during the year. Whereas, Alpine
Construction had a ratio above than the benchmark in 2017 but the same reduces to a great
extent in 2018. The reason for high ratio in the past is the good amount of sale made by the
firm.
Inventory turnover ratio
This ratio determines the number of times a company has sold and converts its inventory into
cash over the period. A high ITR is favourable for the companies and it is calculated by
dividing the sales with average inventory (Weygandt, Kimmel, & Kieso, 2009).
Company 2017 2018 change Industry
standard
Alpine 3.20 times 3.47 times 0.27 times
6.2 times
Maple 7.10 times 7.75 times 0.65 times
Table 7: Inventory Turnover ratio
It can be seen from the above table that Maple has high ITR than Alpine. In 20117 its ratio
was 7.10 times which increases to 7.75 times in 2018. This is due to the significant reduction
in company’s inventory from 125,000 to 103,000 during the year. Whereas, Alpine’s ITR
was reported at 3.20 times in 2017 and 3.47 times in 2018. The inventory turnover of Maple
is better because its ratio is higher than the industry average and is also more than that of
Alpine. Alpine did not reach industry standard. The industry standard is 6.2 times and is only
maintained by Maple Builders. Alpine could not maintain it because of its high inventory in
2018 and its COGS has also increased by 33.18% during the year.
12
1.4 Financial markets
Earnings per share
This ratio indicates company’s profitability and is considered as a part of profit of company’s
profit divided among the each outstanding share of the common stock (Jenter & Lewellen,
2011).
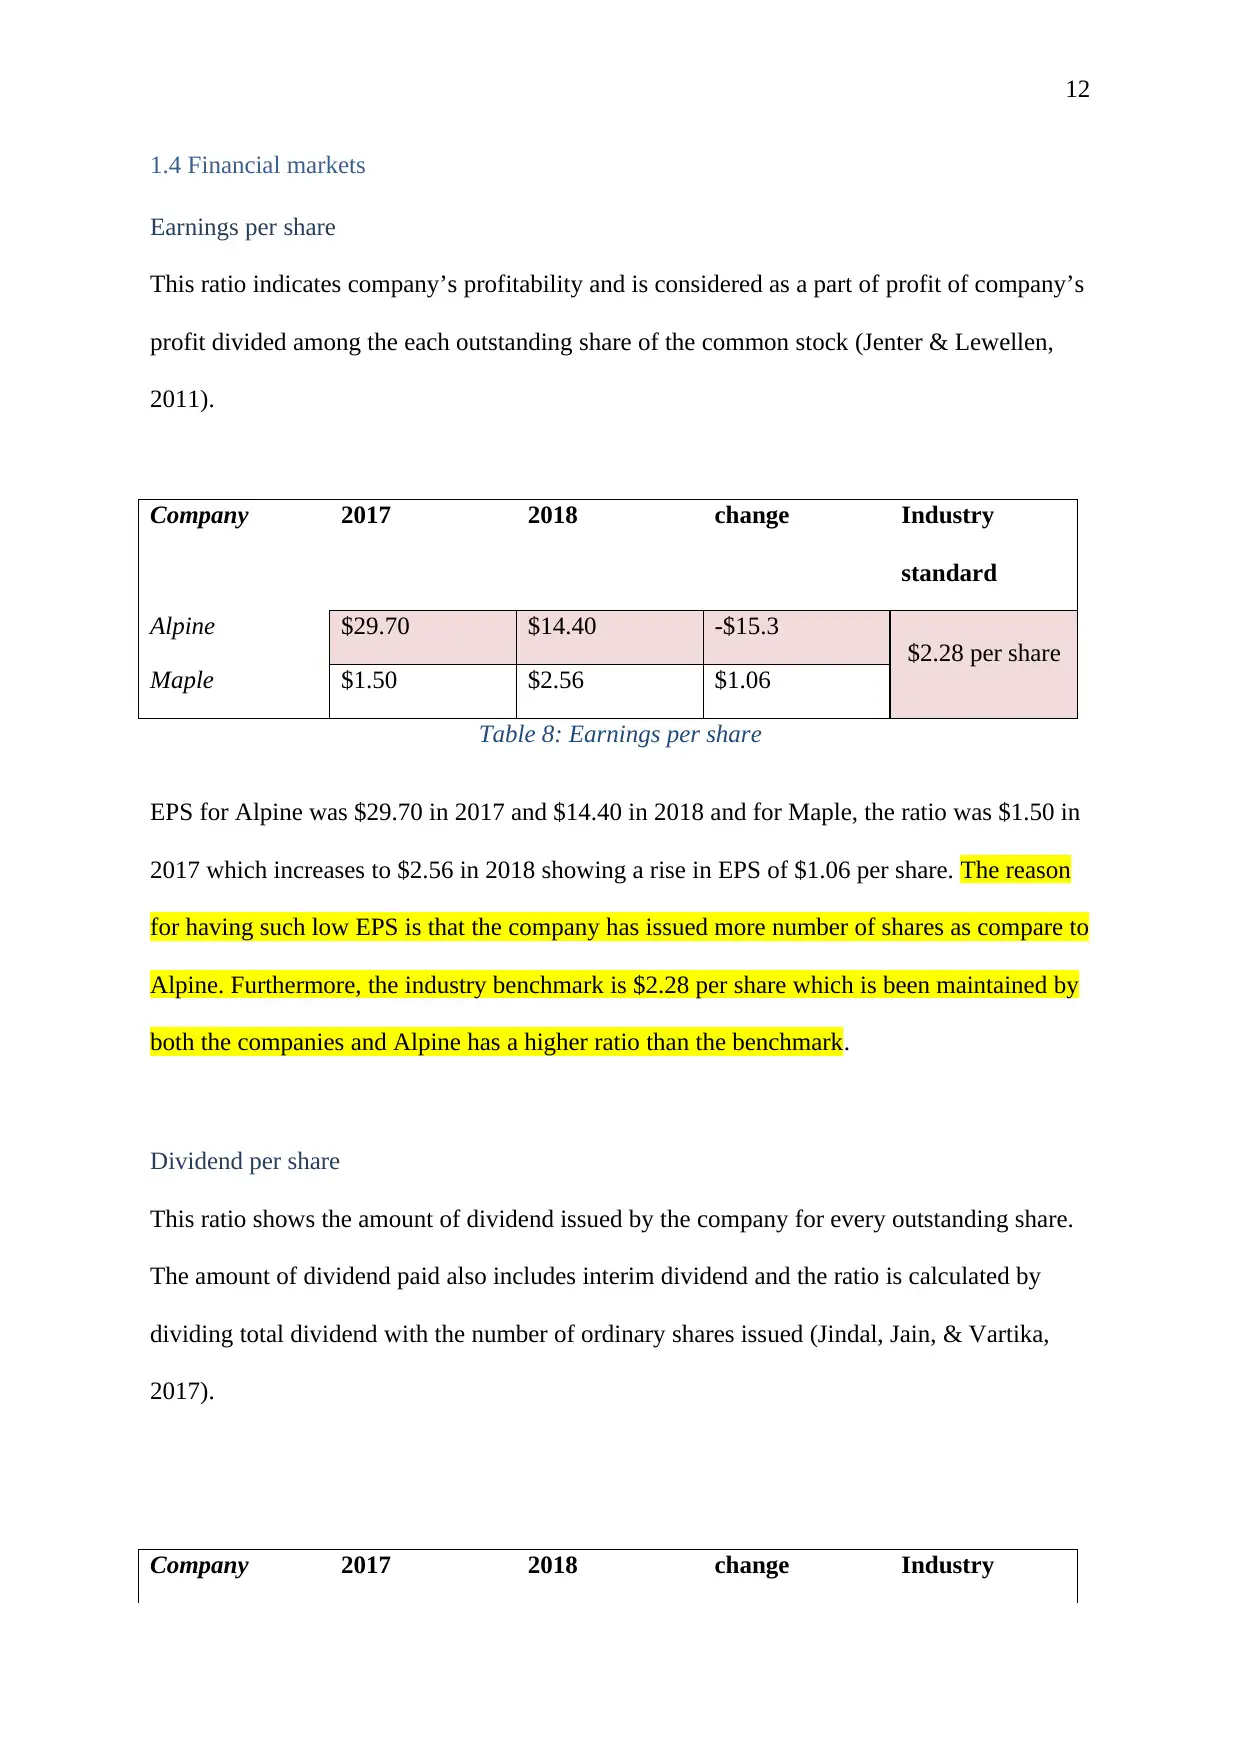
Company 2017 2018 change Industry
standard
Alpine $29.70 $14.40 -$15.3
$2.28 per share
Maple $1.50 $2.56 $1.06
Table 8: Earnings per share
EPS for Alpine was $29.70 in 2017 and $14.40 in 2018 and for Maple, the ratio was $1.50 in
2017 which increases to $2.56 in 2018 showing a rise in EPS of $1.06 per share. The reason
for having such low EPS is that the company has issued more number of shares as compare to
Alpine. Furthermore, the industry benchmark is $2.28 per share which is been maintained by
both the companies and Alpine has a higher ratio than the benchmark.
Dividend per share
This ratio shows the amount of dividend issued by the company for every outstanding share.
The amount of dividend paid also includes interim dividend and the ratio is calculated by
dividing total dividend with the number of ordinary shares issued (Jindal, Jain, & Vartika,
2017).
Company 2017 2018 change Industry
1.4 Financial markets
Earnings per share
This ratio indicates company’s profitability and is considered as a part of profit of company’s
profit divided among the each outstanding share of the common stock (Jenter & Lewellen,
2011).
Company 2017 2018 change Industry
standard
Alpine $29.70 $14.40 -$15.3
$2.28 per share
Maple $1.50 $2.56 $1.06
Table 8: Earnings per share
EPS for Alpine was $29.70 in 2017 and $14.40 in 2018 and for Maple, the ratio was $1.50 in
2017 which increases to $2.56 in 2018 showing a rise in EPS of $1.06 per share. The reason
for having such low EPS is that the company has issued more number of shares as compare to
Alpine. Furthermore, the industry benchmark is $2.28 per share which is been maintained by
both the companies and Alpine has a higher ratio than the benchmark.
Dividend per share
This ratio shows the amount of dividend issued by the company for every outstanding share.
The amount of dividend paid also includes interim dividend and the ratio is calculated by
dividing total dividend with the number of ordinary shares issued (Jindal, Jain, & Vartika,
2017).
Company 2017 2018 change Industry
⊘ This is a preview!⊘
Do you want full access?
Subscribe today to unlock all pages.
Trusted by 1+ million students worldwide
1 out of 28
Related Documents


Your All-in-One AI-Powered Toolkit for Academic Success.
+13062052269
info@desklib.com
Available 24*7 on WhatsApp / Email
![[object Object]](/_next/static/media/star-bottom.7253800d.svg)
Unlock your academic potential
Copyright © 2020–2026 A2Z Services. All Rights Reserved. Developed and managed by ZUCOL.