CX554001 Accounting: Financial Analysis Report of Smart Computers
VerifiedAdded on 2023/04/24
|14
|2390
|313
Report
AI Summary
This comprehensive accounting report analyzes the financial performance of Smart Computers, a sole trader selling Dell computers. The report is structured into four key requirements. Requirement 1 provides a detailed financial analysis, evaluating profitability (gross profit, net profit, and return on equity), financial stability (current, liquidity, and equity ratios), and asset utilization (inventory and accounts receivable turnover). Requirement 2 focuses on budgeting, while Requirement 3 examines variance analysis, comparing budgeted and actual figures to identify favorable and unfavorable variances. Finally, Requirement 4 applies CVP (Cost-Volume-Profit) analysis. The analysis reveals Smart Computers' strong profitability but also highlights liquidity and asset utilization challenges. The report includes tables, calculations, and conclusions, demonstrating an understanding of key accounting concepts and their practical application.

Running head: INTRODUCTION TO ACCOUNTING
Introduction to Accounting
Name of the Student
Name of the University
Author’s Note
Introduction to Accounting
Name of the Student
Name of the University
Author’s Note
Paraphrase This Document
Need a fresh take? Get an instant paraphrase of this document with our AI Paraphraser

1INTRODUCTION TO ACCOUNTING
Table of Contents
Requirement 1 – Financial Analysis Report..............................................................................2
1. Introduction........................................................................................................................2
2. Financial Analysis..............................................................................................................2
a. Calculation of Ratios......................................................................................................2
b. Business Profitability Analysis......................................................................................4
c. Financial Stability Analysis............................................................................................5
d. Asset Utilization Analysis..............................................................................................6
3. Conclusion..........................................................................................................................6
Requirement 2 – Budget.............................................................................................................7
Requirement 3 – Variance Analysis...........................................................................................8
Answer to a and b...................................................................................................................8
Answer to c............................................................................................................................8
Requirement 4 – CVP Analysis.................................................................................................9
Answer to a............................................................................................................................9
Answer to b............................................................................................................................9
Answer to c............................................................................................................................9
Answer to d..........................................................................................................................10
References................................................................................................................................11

2INTRODUCTION TO ACCOUNTING
Requirement 1 – Financial Analysis Report
1. Introduction
a. The main objective of this report is the analysis as well as evaluation of the financial
standing of Smart Computers. Smart Computers can be classified as a sole trader and the
main business operation of the company can be seen in selling the Dell Computers in Mt
Wellington area in Auckland. The achievement of this objective is helpful in gaining a deep
insight about the financial performance of Smart Computers.
b. The main purpose of financial analysis is to gain insight about the relationships and trends
between the financial statements of the companies. Thus, the output of financial analysis of a
company provides the internal management and external users of the financial statements
with the information about the profitability, solvency and liquidity of the firm (Delen, Kuzey
& Uyar, 2013). For the purpose of the financial analysis of Smart Computers, the analysis of
certain ratios is considered for achieving the target related to financial analysis.
c. As per the structure, the report starts with an introduction. The next part of the report
involves in the analysis of certain financial ratios of Smart Computers for gaining insight into
the profitability, stability and asset utilisation. The last part involves in providing a
conclusion.
2. Financial Analysis
a. Calculation of Ratios
i. Gross Profit Ratio, Net Profit Ratio and Return on Equity Ratio
⊘ This is a preview!⊘
Do you want full access?
Subscribe today to unlock all pages.
Trusted by 1+ million students worldwide

3INTRODUCTION TO ACCOUNTING
Table 1: Profitability Ratios
(Source: As created by Author)
ii. Current Ratio, Liquidity Ratio and Equity Ratio
Table 2: Financial Stability Ratios
(Source: As created by Author)
iii. Inventory Turnover Ratio (Times and Days) and Accounts Receivable Turnover Ratio
(Times and Days)
Table 1: Profitability Ratios
(Source: As created by Author)
ii. Current Ratio, Liquidity Ratio and Equity Ratio
Table 2: Financial Stability Ratios
(Source: As created by Author)
iii. Inventory Turnover Ratio (Times and Days) and Accounts Receivable Turnover Ratio
(Times and Days)
Paraphrase This Document
Need a fresh take? Get an instant paraphrase of this document with our AI Paraphraser
4INTRODUCTION TO ACCOUNTING
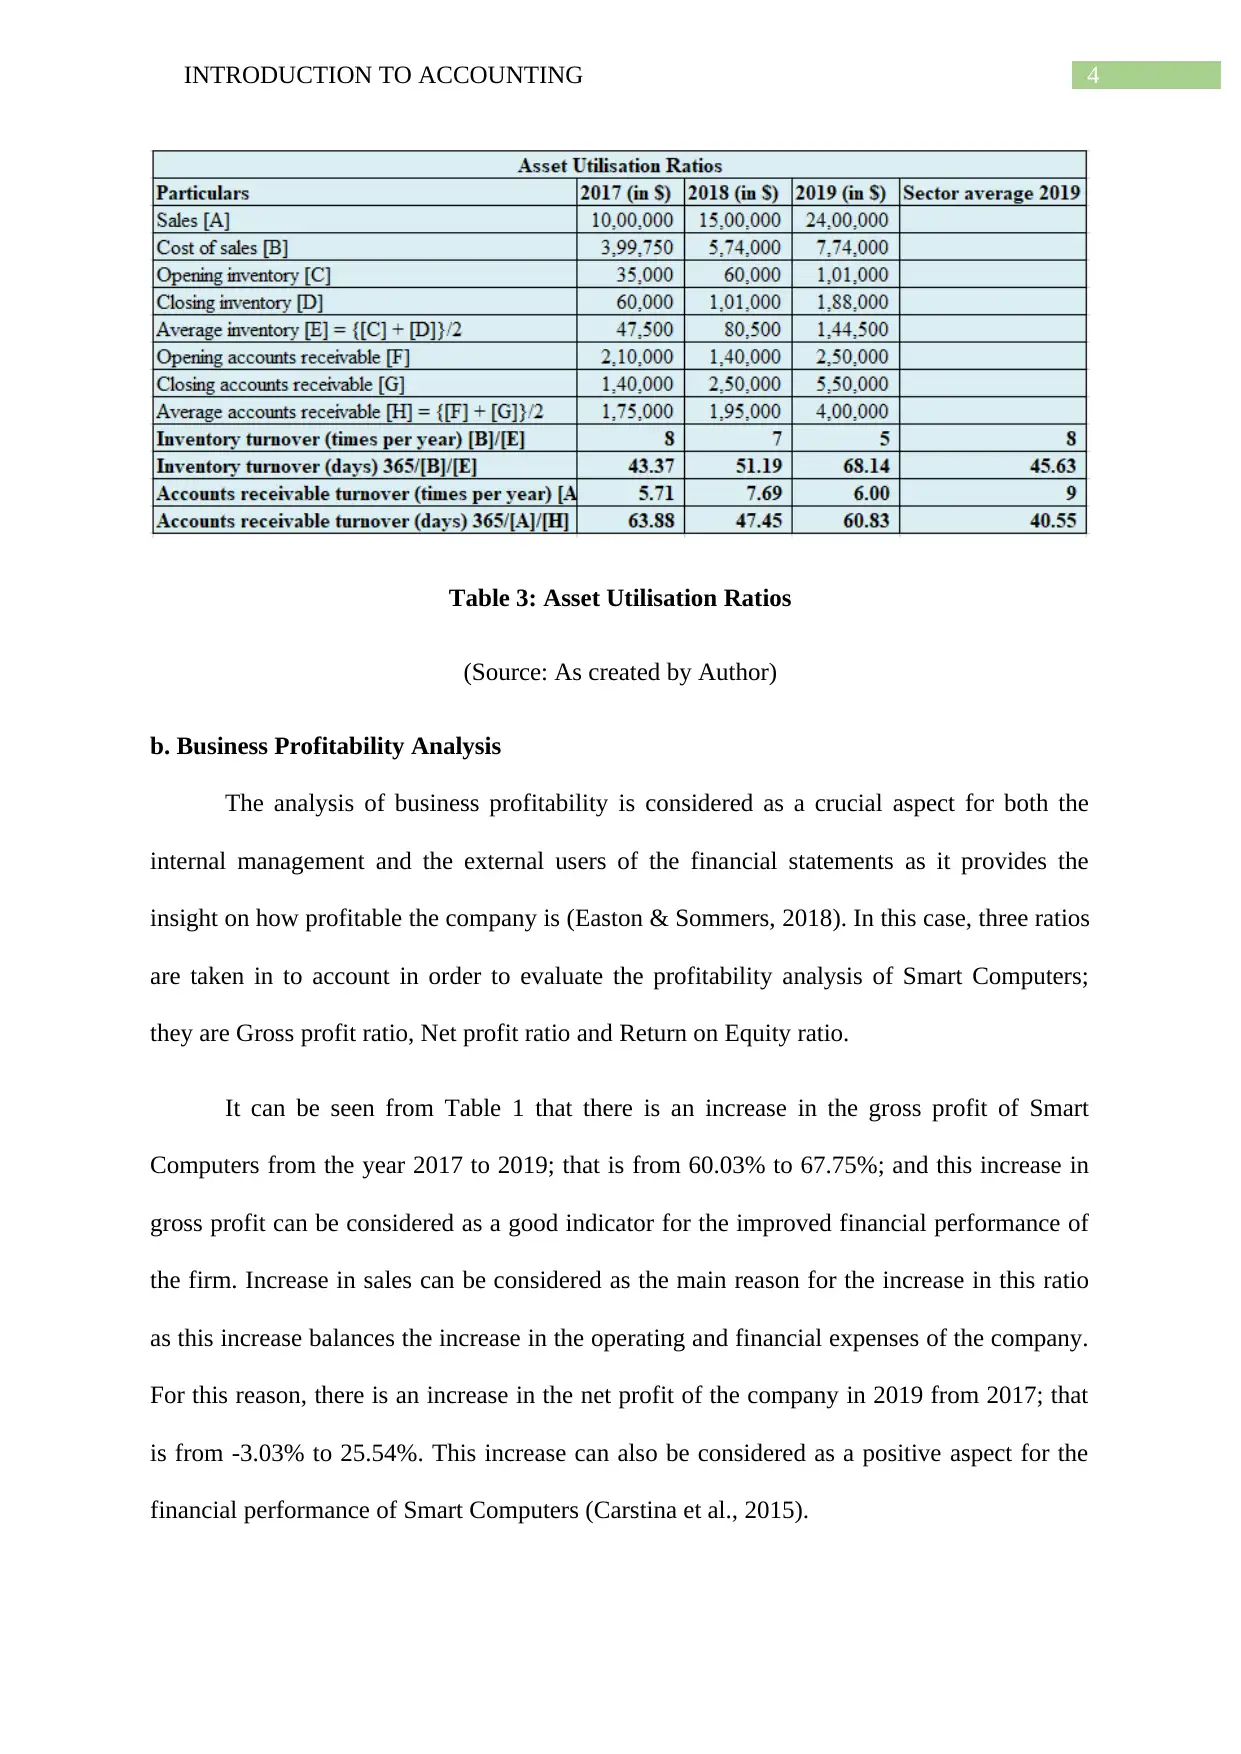
Table 3: Asset Utilisation Ratios
(Source: As created by Author)
b. Business Profitability Analysis
The analysis of business profitability is considered as a crucial aspect for both the
internal management and the external users of the financial statements as it provides the
insight on how profitable the company is (Easton & Sommers, 2018). In this case, three ratios
are taken in to account in order to evaluate the profitability analysis of Smart Computers;
they are Gross profit ratio, Net profit ratio and Return on Equity ratio.
It can be seen from Table 1 that there is an increase in the gross profit of Smart
Computers from the year 2017 to 2019; that is from 60.03% to 67.75%; and this increase in
gross profit can be considered as a good indicator for the improved financial performance of
the firm. Increase in sales can be considered as the main reason for the increase in this ratio
as this increase balances the increase in the operating and financial expenses of the company.
For this reason, there is an increase in the net profit of the company in 2019 from 2017; that
is from -3.03% to 25.54%. This increase can also be considered as a positive aspect for the
financial performance of Smart Computers (Carstina et al., 2015).

5INTRODUCTION TO ACCOUNTING
At the same time, according to the same table, there is a major improvement in the
return on equity ratio of Smart Computers as it become positive in 2019 from negative in
2017; that is from -1.94% to 48.96%. This increase indicates towards the ability of the
company in generating additional profit in the absence of more shareholders’ capital. This
can also be regarded as a positive aspect for the financial performance of Smart Computers.
In this context, it is crucial to mention that all the profitability rations of Smart Computers in
the recent year are more than the industry average that shows the superiority in the
profitability position of the firm (Boadi, Antwi & Lartey, 2013).
c. Financial Stability Analysis
It is fundamental for all companies to have sound, stable and healthy financial system
due to the fact that it supports the correct allocation of resources along with the effective
distribution of risks across the economy; and there is not any exception of this fact in case of
Smart Computers as financial stability is crucial for the business sustainability of the firm
(Caccioli et al., 2014). Three specific ratios are taken into account to analyse and evaluate the
financial stability of Smart Computers; they are Current Ratio, Liquidity ratio and Equity
ratio.
According to Table 2, there is a decrease in the current ratio of Smart Computers in
2019 when compared to 2017; that is from 2.81 to 1.25. It can also be seen that current ratio
of Smart Computers in 2019 is below the industry standard that is 1.90. The main reason for
this decrease is the major increase in the accounts payable of Smart Computers in 2019. This
condition indicates towards the ineffective liquidity position of the firm (Babalola & Abiola,
2013).
Presence of the same aspect can be seen in case of liquidity ratio as decrease can be
seen in this ratio in 2019 from 2017; that is from 2.06 to 0.93. Like current ratio, this ratio is
⊘ This is a preview!⊘
Do you want full access?
Subscribe today to unlock all pages.
Trusted by 1+ million students worldwide

6INTRODUCTION TO ACCOUNTING
also lower than the industry average of 1.15. This aspect indicates towards the ineffective
liquidity position of Smart Computers due to the fact that the firm does not have the needed
liquid ratio to pay off the current liabilities. It can also be seen from the same table that there
is a decrease in the equity ratio of Smart Computers in 2019 as compared to 2017; that is
from 79.39% to 51.78%. Moreover, this ratio is also below the industry average. Decrease in
total equity in 2019 from 2017 can be considered as the main reason for this ineffective
equity ratio of the firm (Warrad, 2014).
d. Asset Utilisation Analysis
The analysis of asset utilisation is considered as essential for the companies as the
success of asset utilization is positively related to the company’s ability for managing and
leveraging its assets; and the same is applicable for Smart Computers (Latino, Latino &
Latino, 2016). Two specific ratios are taken into account for analysing the asset utilization of
Smart Computers; they are Inventory turnover ratio and Accounts receivable turnover ratio;
and both in terms of times and days.
It can be seen from Table 3 that there is a decrease in inventory turnover ratio in times
in 2019 from 2017; that is from 8 times to 5 times. However, when considered inventory
turnover in days, it increases in 2019 from 2017; that is from 43.37 days to 68.14 days. Smart
Computers has maintained huge inventory that surpasses market demand in spite of the
increase in sales and it is the reason for the current situation (Curtis, Lewis-Western &
Toynbee, 2015).
According to the same table, increase can be seen in the accounts receivable ratio in
2019 from 2017 in both the cases of times and days. However, at the same time, major
fluctuations can be seen in this ratio over the period of these three years. This cannot be
considered as a favourable situation for Smart Computers as it indicates towards the fact that
Paraphrase This Document
Need a fresh take? Get an instant paraphrase of this document with our AI Paraphraser

7INTRODUCTION TO ACCOUNTING
the company is holding too much unused cash along with working capital (Sarangarajan &
Lourthuraj, 2013). In addition, these ratios are much higher than the industry averages that
are not favourable for Smart Computers.
3. Conclusion
a. It can be seen from the above discussion that Smart Computers has a strong profitability
position due to the fact that there is increase in the company’s both gross profit and net profit
margin along with the increase return on equity. However, the company is facing liquidity
related issues due to the lack of both current and liquid assets for paying off the current
business obligations. Another issue is that Smart Computers is holding too much stock due to
the demand in market; they are also holding idle cash that is affecting the asset utilization
position of the firm.
b. Since financial analysis is done based on historical costs, it is unable to reflect the recent
changes in the values of assets, liabilities and others. In addition, the considered values are
not adjusted against inflation. In addition, financial analysis is based on specific time period.
These limitations of financial analysis can provide misleading information about the firm’s
financial performance and position.

8INTRODUCTION TO ACCOUNTING
Requirement 2 – Budget
Requirement 2 – Budget
⊘ This is a preview!⊘
Do you want full access?
Subscribe today to unlock all pages.
Trusted by 1+ million students worldwide

9INTRODUCTION TO ACCOUNTING
Requirement 3 – Variance Analysis
Answer to a and b
Answer to c
It can be seen from the above table that the actual revenue is greater than the budgeted
revenue. In spite of the little increase in cost of sales, actual gross profit is greater than the
budgeted one. Decrease in advertisement expenses is there in the presence of little increase in
sales bonus and delivery. However, financial expenses can be considered as unfavourable
variable as is more than the budgeted one. For Smart Computers, the overall variable is good
(Gorgotskaya & Selyutina, 2013).
It is needed to investigate two variable; they are debt and sales bonus and delivery.
They need to be investigated as the actual sales bonus and delivery is worth $11,200 greater
than the budgeted one because of the increase in sales in the presence of sales commission. In
addition, default of the customers to settle the due balance can be considered as the reason
behind the increase in actual debts from the budgeted one (Lorain, GarcíaDomonte &
SastrePeláez, 2015).
Paraphrase This Document
Need a fresh take? Get an instant paraphrase of this document with our AI Paraphraser

10INTRODUCTION TO ACCOUNTING
Requirement 4 – CVP Analysis
Answer to a
Answer to b
Answer to c
Requirement 4 – CVP Analysis
Answer to a
Answer to b
Answer to c
11INTRODUCTION TO ACCOUNTING
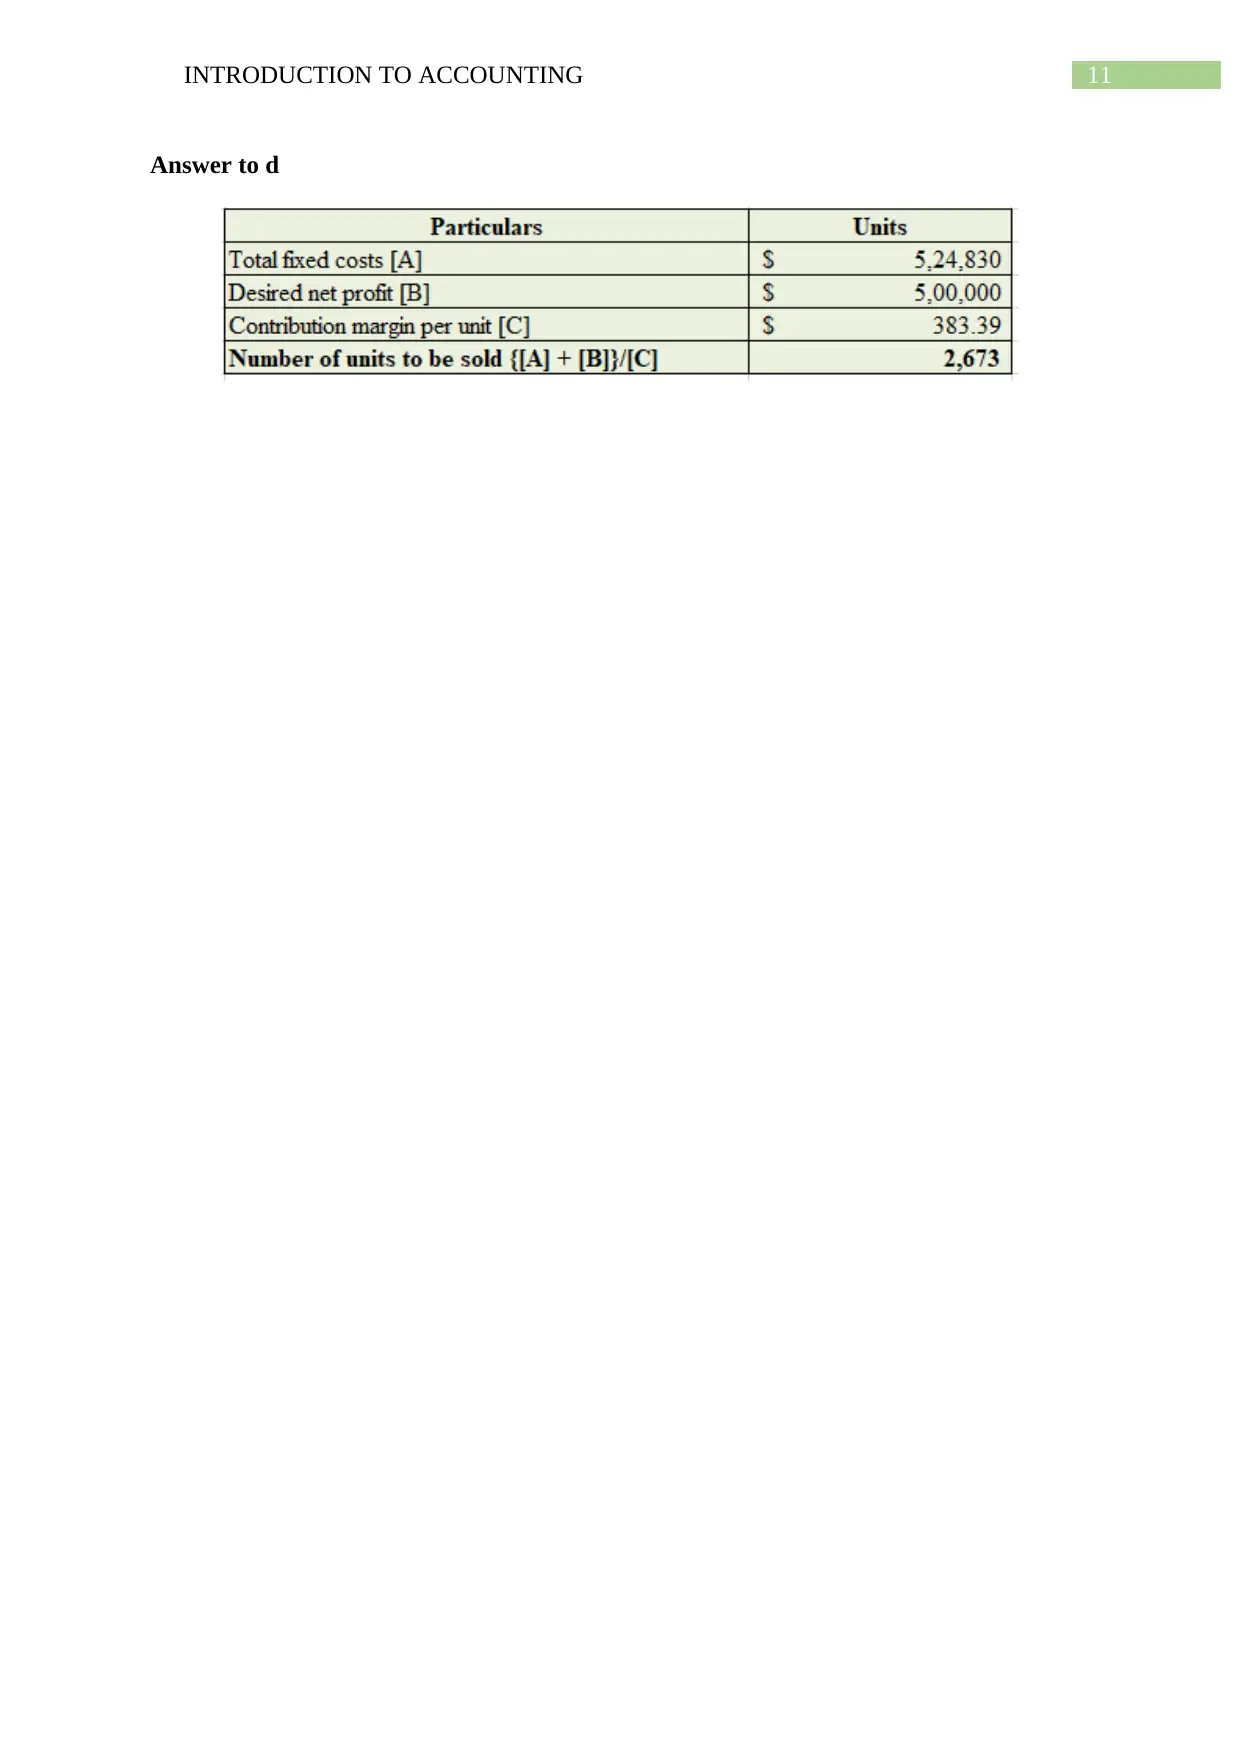
Answer to d
Answer to d
⊘ This is a preview!⊘
Do you want full access?
Subscribe today to unlock all pages.
Trusted by 1+ million students worldwide
1 out of 14
Related Documents


Your All-in-One AI-Powered Toolkit for Academic Success.
+13062052269
info@desklib.com
Available 24*7 on WhatsApp / Email
![[object Object]](/_next/static/media/star-bottom.7253800d.svg)
Unlock your academic potential
Copyright © 2020–2026 A2Z Services. All Rights Reserved. Developed and managed by ZUCOL.