Comprehensive Financial Report: Ratio Analysis and Investment Review
VerifiedAdded on 2023/06/04
|18
|3937
|410
Report
AI Summary
This report provides a comprehensive financial analysis, beginning with the computation of financial ratios for Liverton Co. for the years 2018 and 2019, including gross profit margin, asset usage ratio, current ratio, acid test ratio, inventory holding period, and debt to equity ratio, followed by an assessment of the importance of financial statements. It includes the preparation of opening statements and a monthly cash budget for six months, along with observations on additional expenditures. The report also determines the break-even point (BEP) in units and sales revenue for both 2019 and 2020, computes the margin of safety, and analyzes the impact of a new business strategy. Finally, it computes investment appraisal techniques such as the payback period, net present value, and average rate of return for different projects, determining the most suitable method for capital investment appraisal. Desklib offers a range of solved assignments and study tools for students.

Introduction to Finance
Paraphrase This Document
Need a fresh take? Get an instant paraphrase of this document with our AI Paraphraser
Contents
INTRODUCTION...........................................................................................................................1
Question 1........................................................................................................................................1
Computation of financial ratios of Liverton Co. for the year ended 2018 and 2019...................1
Importance of financial statements .............................................................................................3
Question 2........................................................................................................................................3
a) preparation of an opening statements at the start of July ........................................................3
b) monthly budget of cash for 6 months .....................................................................................3
c) observation of extra additional expenditure ............................................................................4
Question 3........................................................................................................................................4
a) Findings of break even point (BEP)........................................................................................4
b) computation of margin of safety in year 2019 and 2020 ........................................................6
c) Determination of new strategy which evolved to impact on company that has been formed
by Jessica ....................................................................................................................................6
Question 4 .......................................................................................................................................7
a) Computation of payback period, net present value and average rate of return ......................7
Determination of best suitable method for appraisal technique ..................................................9
Capital investment appraisal techniques ..................................................................................10
CONCLUSION..............................................................................................................................12
REFERENCES .............................................................................................................................13

⊘ This is a preview!⊘
Do you want full access?
Subscribe today to unlock all pages.
Trusted by 1+ million students worldwide
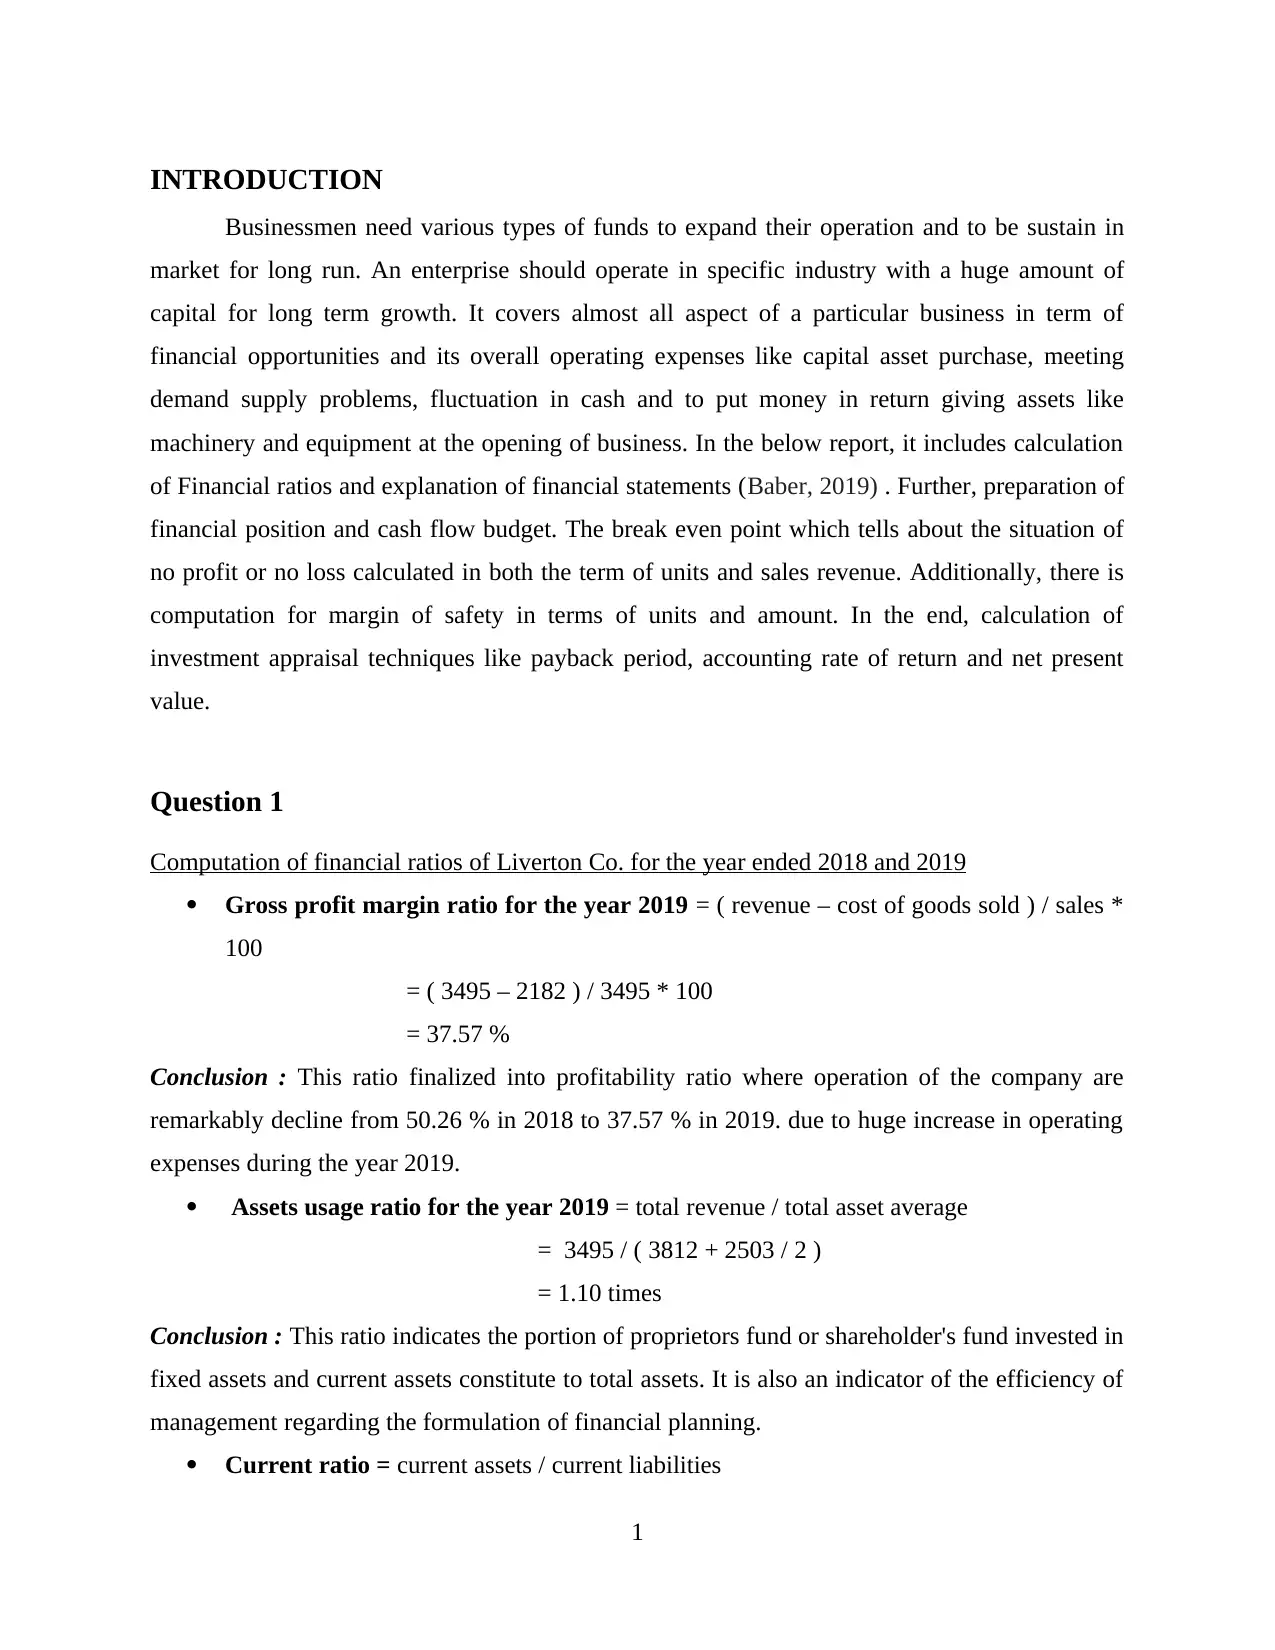
INTRODUCTION
Businessmen need various types of funds to expand their operation and to be sustain in
market for long run. An enterprise should operate in specific industry with a huge amount of
capital for long term growth. It covers almost all aspect of a particular business in term of
financial opportunities and its overall operating expenses like capital asset purchase, meeting
demand supply problems, fluctuation in cash and to put money in return giving assets like
machinery and equipment at the opening of business. In the below report, it includes calculation
of Financial ratios and explanation of financial statements (Baber, 2019) . Further, preparation of
financial position and cash flow budget. The break even point which tells about the situation of
no profit or no loss calculated in both the term of units and sales revenue. Additionally, there is
computation for margin of safety in terms of units and amount. In the end, calculation of
investment appraisal techniques like payback period, accounting rate of return and net present
value.
Question 1
Computation of financial ratios of Liverton Co. for the year ended 2018 and 2019
Gross profit margin ratio for the year 2019 = ( revenue – cost of goods sold ) / sales *
100
= ( 3495 – 2182 ) / 3495 * 100
= 37.57 %
Conclusion : This ratio finalized into profitability ratio where operation of the company are
remarkably decline from 50.26 % in 2018 to 37.57 % in 2019. due to huge increase in operating
expenses during the year 2019.
Assets usage ratio for the year 2019 = total revenue / total asset average
= 3495 / ( 3812 + 2503 / 2 )
= 1.10 times
Conclusion : This ratio indicates the portion of proprietors fund or shareholder's fund invested in
fixed assets and current assets constitute to total assets. It is also an indicator of the efficiency of
management regarding the formulation of financial planning.
Current ratio = current assets / current liabilities
1
Paraphrase This Document
Need a fresh take? Get an instant paraphrase of this document with our AI Paraphraser
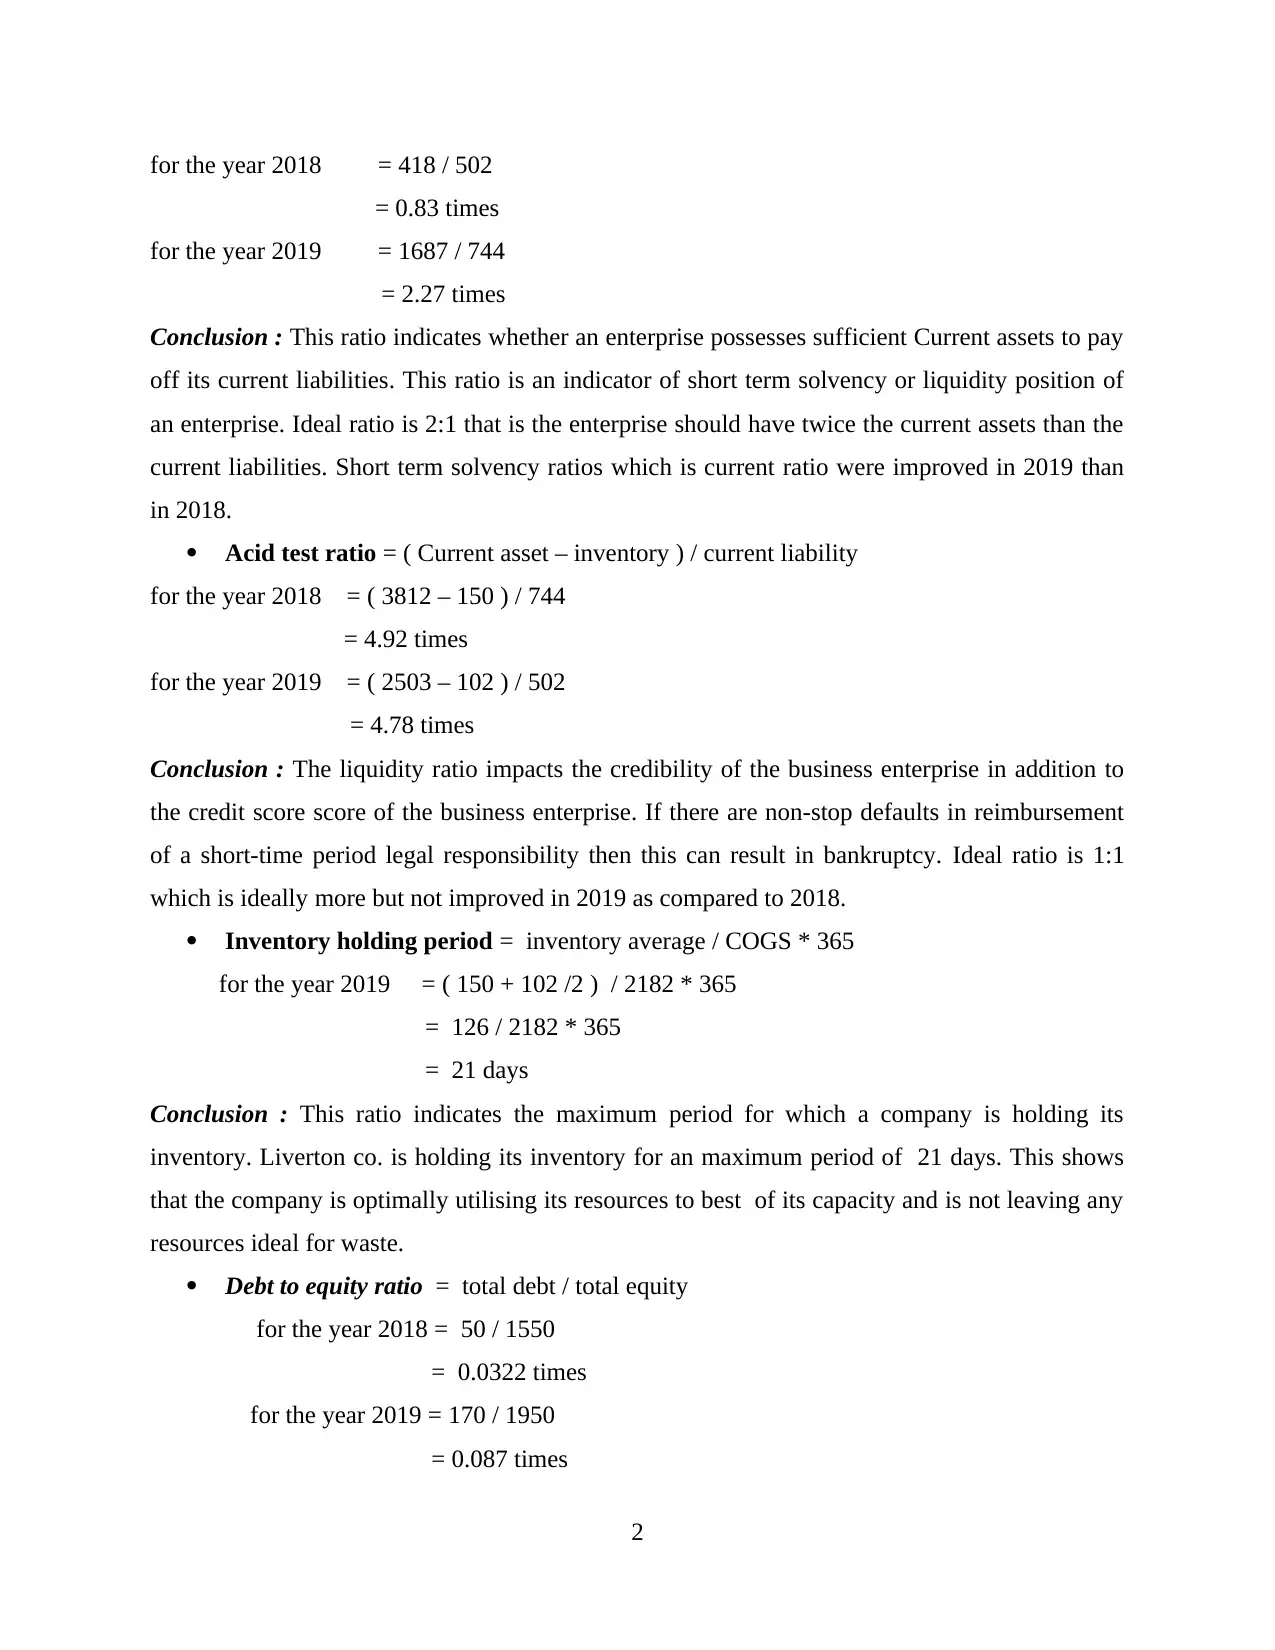
for the year 2018 = 418 / 502
= 0.83 times
for the year 2019 = 1687 / 744
= 2.27 times
Conclusion : This ratio indicates whether an enterprise possesses sufficient Current assets to pay
off its current liabilities. This ratio is an indicator of short term solvency or liquidity position of
an enterprise. Ideal ratio is 2:1 that is the enterprise should have twice the current assets than the
current liabilities. Short term solvency ratios which is current ratio were improved in 2019 than
in 2018.
Acid test ratio = ( Current asset – inventory ) / current liability
for the year 2018 = ( 3812 – 150 ) / 744
= 4.92 times
for the year 2019 = ( 2503 – 102 ) / 502
= 4.78 times
Conclusion : The liquidity ratio impacts the credibility of the business enterprise in addition to
the credit score score of the business enterprise. If there are non-stop defaults in reimbursement
of a short-time period legal responsibility then this can result in bankruptcy. Ideal ratio is 1:1
which is ideally more but not improved in 2019 as compared to 2018.
Inventory holding period = inventory average / COGS * 365
for the year 2019 = ( 150 + 102 /2 ) / 2182 * 365
= 126 / 2182 * 365
= 21 days
Conclusion : This ratio indicates the maximum period for which a company is holding its
inventory. Liverton co. is holding its inventory for an maximum period of 21 days. This shows
that the company is optimally utilising its resources to best of its capacity and is not leaving any
resources ideal for waste.
Debt to equity ratio = total debt / total equity
for the year 2018 = 50 / 1550
= 0.0322 times
for the year 2019 = 170 / 1950
= 0.087 times
2
Conclusion : Debt-Equity Ratio indicates the proportion of debt Capital and Owners’ Capital
included in the Capital Structure. This is an indicator of the Capital Structure of an enterprise. It
also shows the efficiency of the management in financial planning. The ideal ratio is 1:2.
Importance of financial statements
In general, economic statements are used to degree the economic fame of a enterprise. They are
crucial as they offer an knowledge of the enterprises common sales and expenses (Chahed,
2021). This can assist an enterprise to make selections primarily based totally on preceding
information and trends and might tell the selections of lenders, consumers, and authorities
agencies.
For investor – they need to know that their money are in safe hands and they should assure with
proper return of their money invested.
For government – they want to know that position of an enterprise is secure and have enough
amount of fund to pay their current and deferred tax.
Question 2
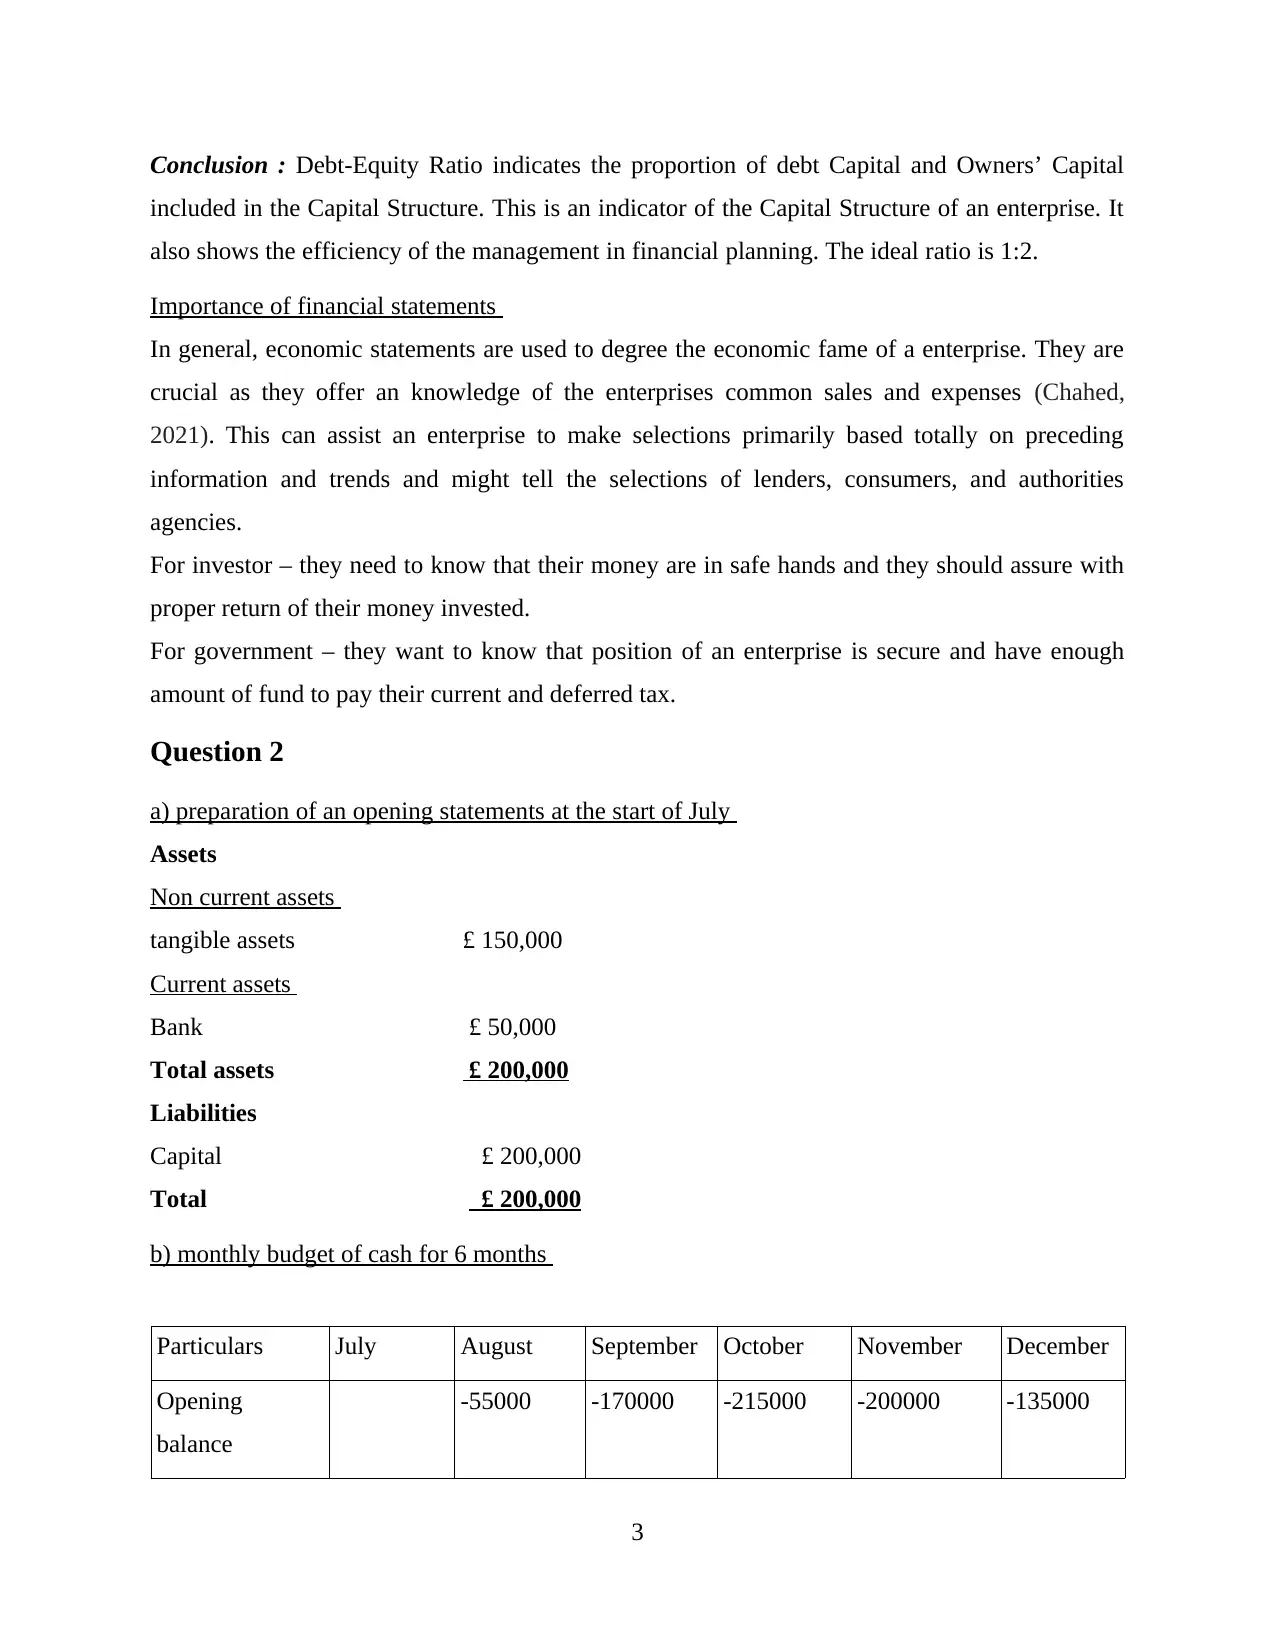
a) preparation of an opening statements at the start of July
Assets
Non current assets
tangible assets £ 150,000
Current assets
Bank £ 50,000
Total assets £ 200,000
Liabilities
Capital £ 200,000
Total £ 200,000
b) monthly budget of cash for 6 months
Particulars July August September October November December
Opening
balance
-55000 -170000 -215000 -200000 -135000
3
included in the Capital Structure. This is an indicator of the Capital Structure of an enterprise. It
also shows the efficiency of the management in financial planning. The ideal ratio is 1:2.
Importance of financial statements
In general, economic statements are used to degree the economic fame of a enterprise. They are
crucial as they offer an knowledge of the enterprises common sales and expenses (Chahed,
2021). This can assist an enterprise to make selections primarily based totally on preceding
information and trends and might tell the selections of lenders, consumers, and authorities
agencies.
For investor – they need to know that their money are in safe hands and they should assure with
proper return of their money invested.
For government – they want to know that position of an enterprise is secure and have enough
amount of fund to pay their current and deferred tax.
Question 2
a) preparation of an opening statements at the start of July
Assets
Non current assets
tangible assets £ 150,000
Current assets
Bank £ 50,000
Total assets £ 200,000
Liabilities
Capital £ 200,000
Total £ 200,000
b) monthly budget of cash for 6 months
Particulars July August September October November December
Opening
balance
-55000 -170000 -215000 -200000 -135000
3
⊘ This is a preview!⊘
Do you want full access?
Subscribe today to unlock all pages.
Trusted by 1+ million students worldwide
Receipts
Initial
investment
200000
Sales receipts 150000 120000 150000 210000 260000 285000
Total receipts 350000 65000 -20000 -5000 60000 150000
Payments
Purchase of non
current assets
150000
Material 120000 100000 60000 60000 60000 60000
Other
expenditure
55000 55000 55000 55000 55000 55000
Wages expenses 80000 80000 80000 80000 80000 80000
Tax bill 20000
Total payments 405000 235000 195000 195000 195000 215000
Closing balance -55000 -170000 -215000 -200000 -135000 -65000
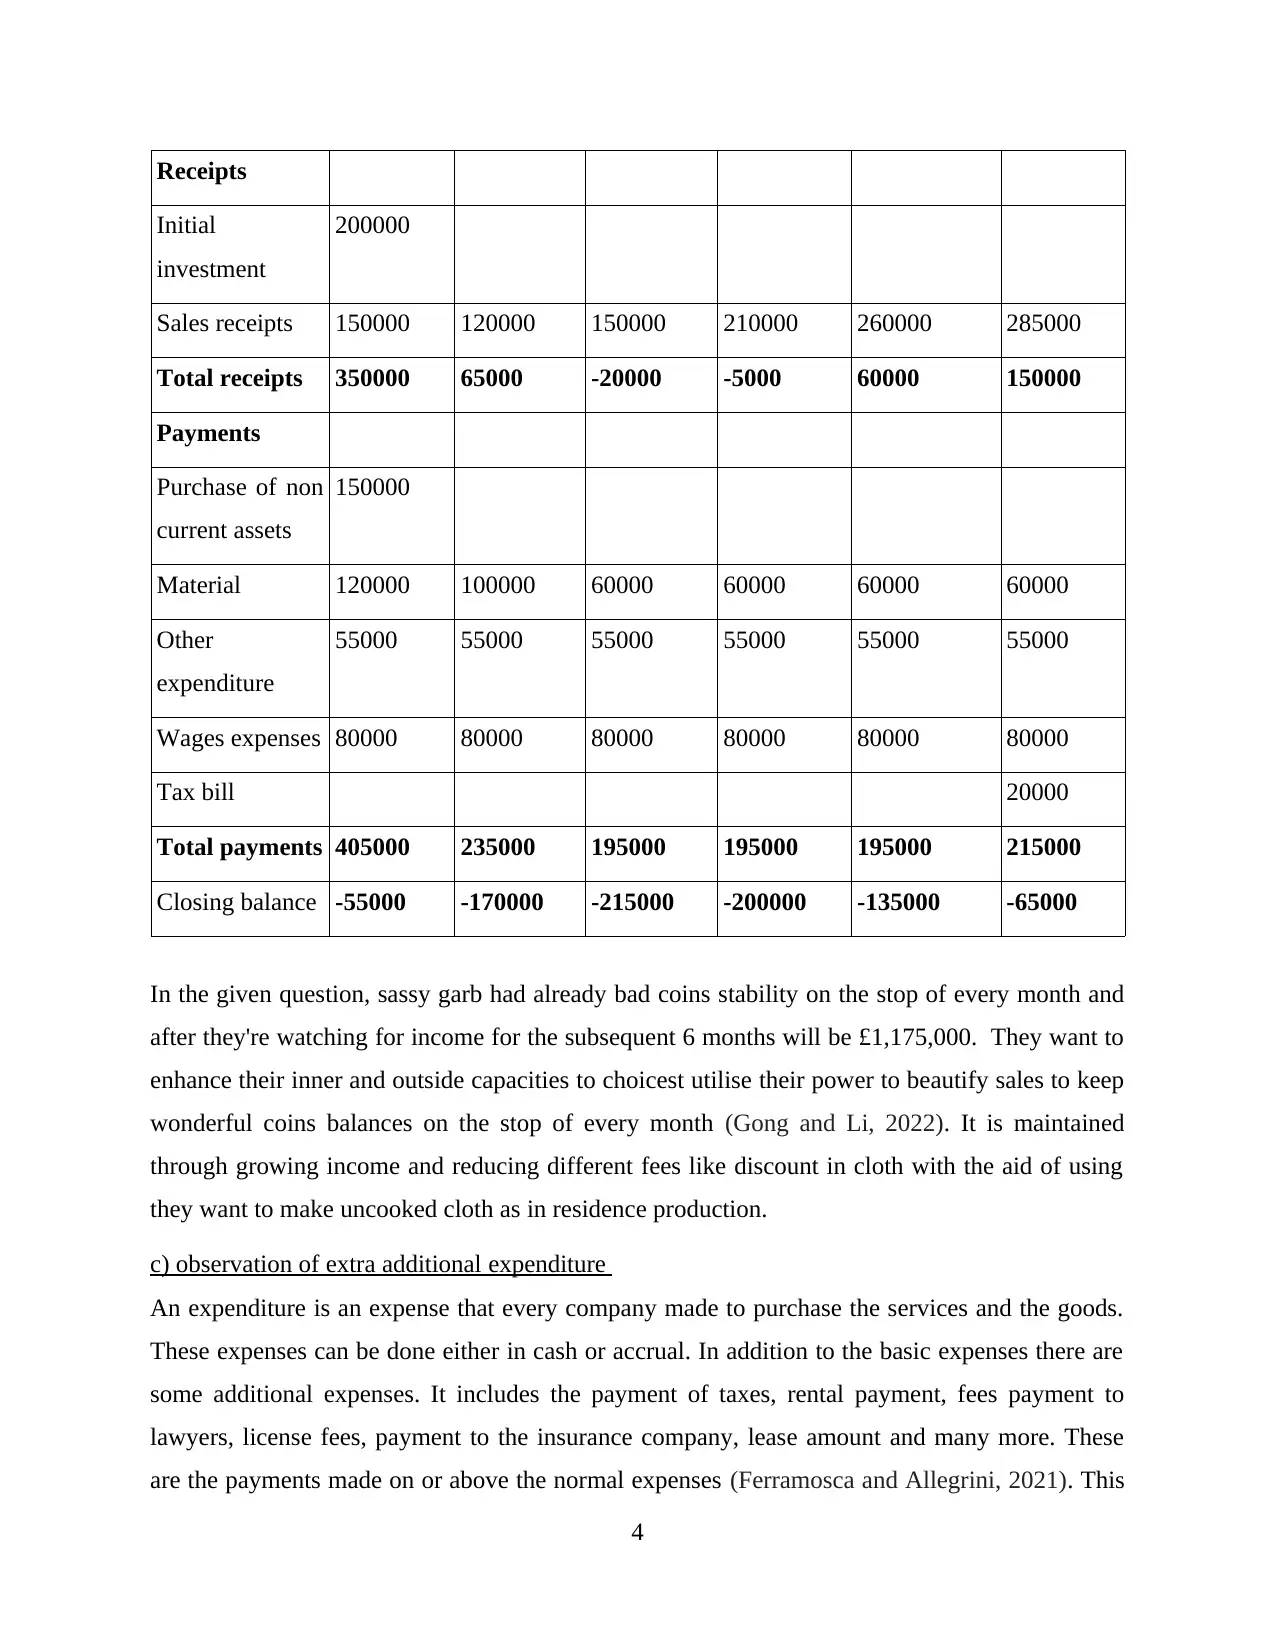
In the given question, sassy garb had already bad coins stability on the stop of every month and
after they're watching for income for the subsequent 6 months will be £1,175,000. They want to
enhance their inner and outside capacities to choicest utilise their power to beautify sales to keep
wonderful coins balances on the stop of every month (Gong and Li, 2022). It is maintained
through growing income and reducing different fees like discount in cloth with the aid of using
they want to make uncooked cloth as in residence production.
c) observation of extra additional expenditure
An expenditure is an expense that every company made to purchase the services and the goods.
These expenses can be done either in cash or accrual. In addition to the basic expenses there are
some additional expenses. It includes the payment of taxes, rental payment, fees payment to
lawyers, license fees, payment to the insurance company, lease amount and many more. These
are the payments made on or above the normal expenses (Ferramosca and Allegrini, 2021). This
4
Initial
investment
200000
Sales receipts 150000 120000 150000 210000 260000 285000
Total receipts 350000 65000 -20000 -5000 60000 150000
Payments
Purchase of non
current assets
150000
Material 120000 100000 60000 60000 60000 60000
Other
expenditure
55000 55000 55000 55000 55000 55000
Wages expenses 80000 80000 80000 80000 80000 80000
Tax bill 20000
Total payments 405000 235000 195000 195000 195000 215000
Closing balance -55000 -170000 -215000 -200000 -135000 -65000
In the given question, sassy garb had already bad coins stability on the stop of every month and
after they're watching for income for the subsequent 6 months will be £1,175,000. They want to
enhance their inner and outside capacities to choicest utilise their power to beautify sales to keep
wonderful coins balances on the stop of every month (Gong and Li, 2022). It is maintained
through growing income and reducing different fees like discount in cloth with the aid of using
they want to make uncooked cloth as in residence production.
c) observation of extra additional expenditure
An expenditure is an expense that every company made to purchase the services and the goods.
These expenses can be done either in cash or accrual. In addition to the basic expenses there are
some additional expenses. It includes the payment of taxes, rental payment, fees payment to
lawyers, license fees, payment to the insurance company, lease amount and many more. These
are the payments made on or above the normal expenses (Ferramosca and Allegrini, 2021). This
4
Paraphrase This Document
Need a fresh take? Get an instant paraphrase of this document with our AI Paraphraser
maintains the continuity in the continuity of the business. If any company fails to make payments
then it may results in the failure of the business operations.
Question 3
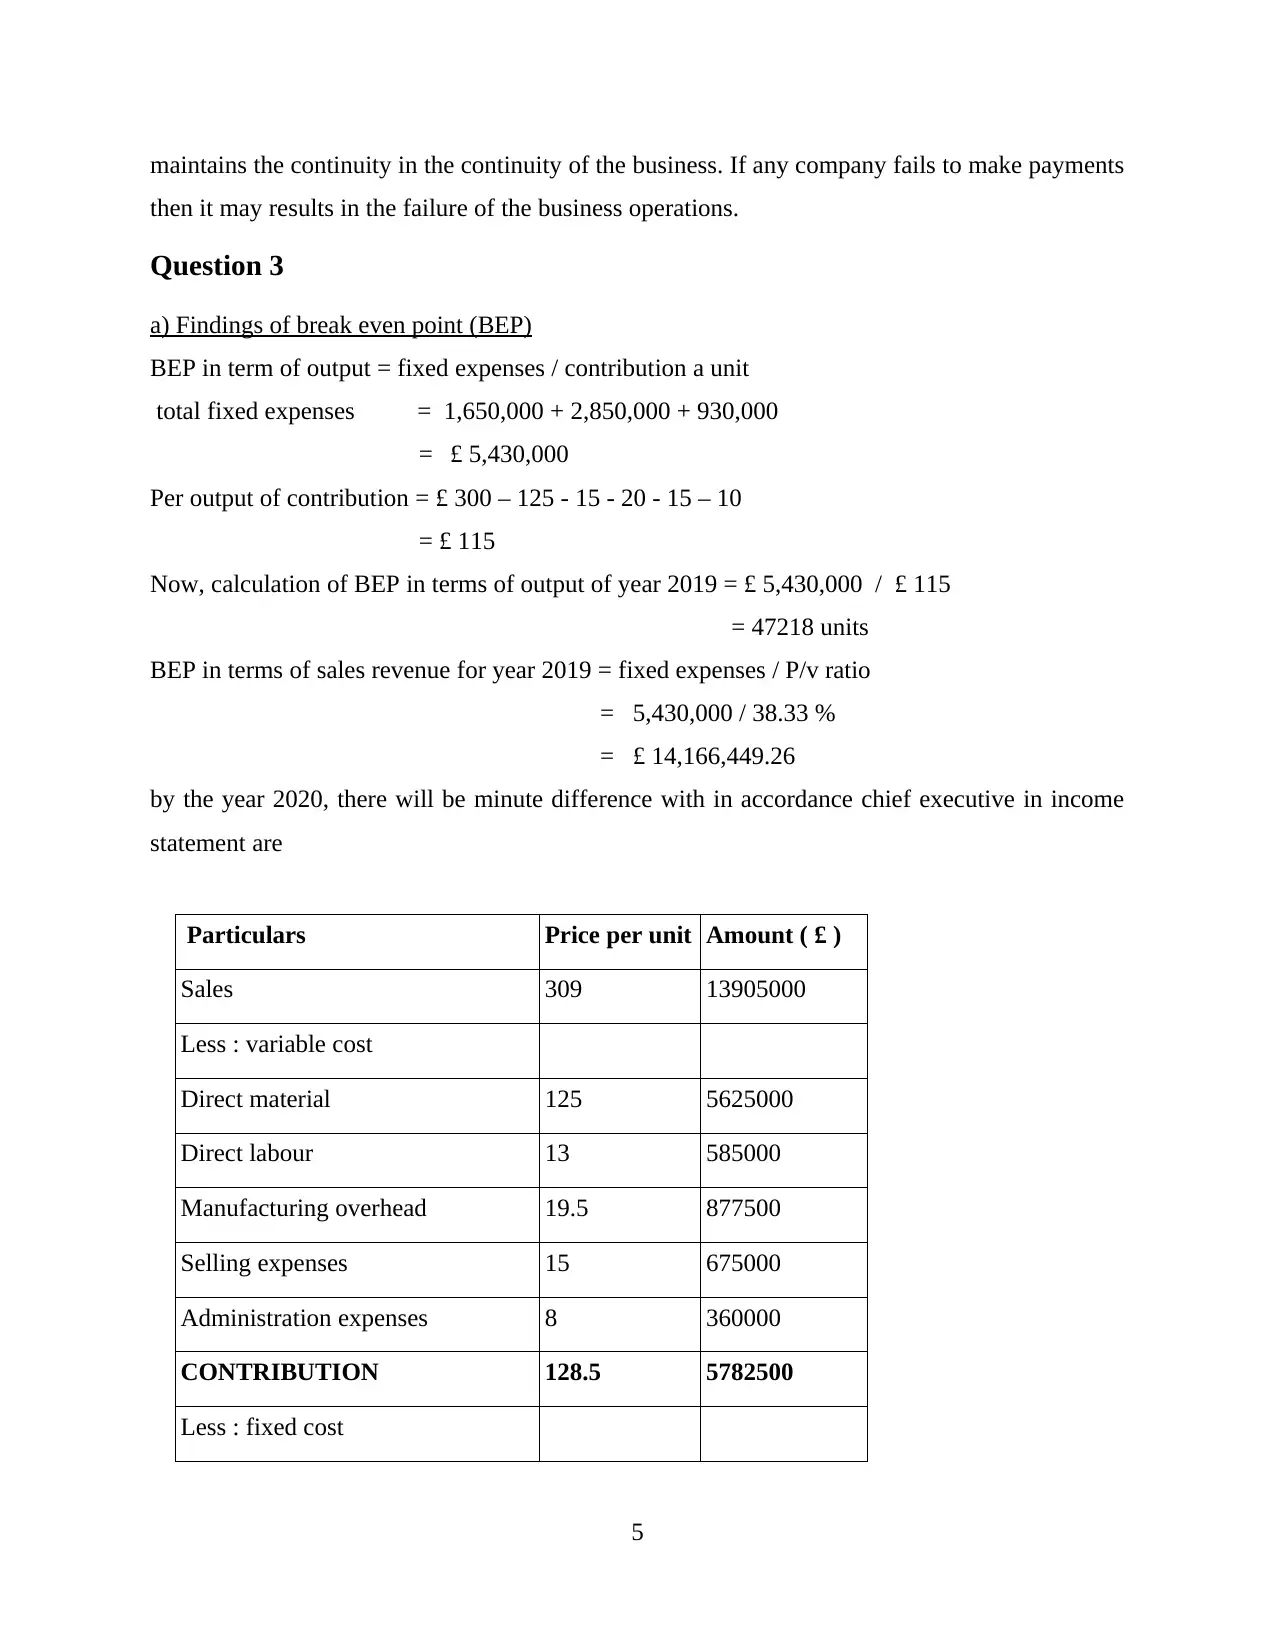
a) Findings of break even point (BEP)
BEP in term of output = fixed expenses / contribution a unit
total fixed expenses = 1,650,000 + 2,850,000 + 930,000
= £ 5,430,000
Per output of contribution = £ 300 – 125 - 15 - 20 - 15 – 10
= £ 115
Now, calculation of BEP in terms of output of year 2019 = £ 5,430,000 / £ 115
= 47218 units
BEP in terms of sales revenue for year 2019 = fixed expenses / P/v ratio
= 5,430,000 / 38.33 %
= £ 14,166,449.26
by the year 2020, there will be minute difference with in accordance chief executive in income
statement are
Particulars Price per unit Amount ( £ )
Sales 309 13905000
Less : variable cost
Direct material 125 5625000
Direct labour 13 585000
Manufacturing overhead 19.5 877500
Selling expenses 15 675000
Administration expenses 8 360000
CONTRIBUTION 128.5 5782500
Less : fixed cost
5
then it may results in the failure of the business operations.
Question 3
a) Findings of break even point (BEP)
BEP in term of output = fixed expenses / contribution a unit
total fixed expenses = 1,650,000 + 2,850,000 + 930,000
= £ 5,430,000
Per output of contribution = £ 300 – 125 - 15 - 20 - 15 – 10
= £ 115
Now, calculation of BEP in terms of output of year 2019 = £ 5,430,000 / £ 115
= 47218 units
BEP in terms of sales revenue for year 2019 = fixed expenses / P/v ratio
= 5,430,000 / 38.33 %
= £ 14,166,449.26
by the year 2020, there will be minute difference with in accordance chief executive in income
statement are
Particulars Price per unit Amount ( £ )
Sales 309 13905000
Less : variable cost
Direct material 125 5625000
Direct labour 13 585000
Manufacturing overhead 19.5 877500
Selling expenses 15 675000
Administration expenses 8 360000
CONTRIBUTION 128.5 5782500
Less : fixed cost
5
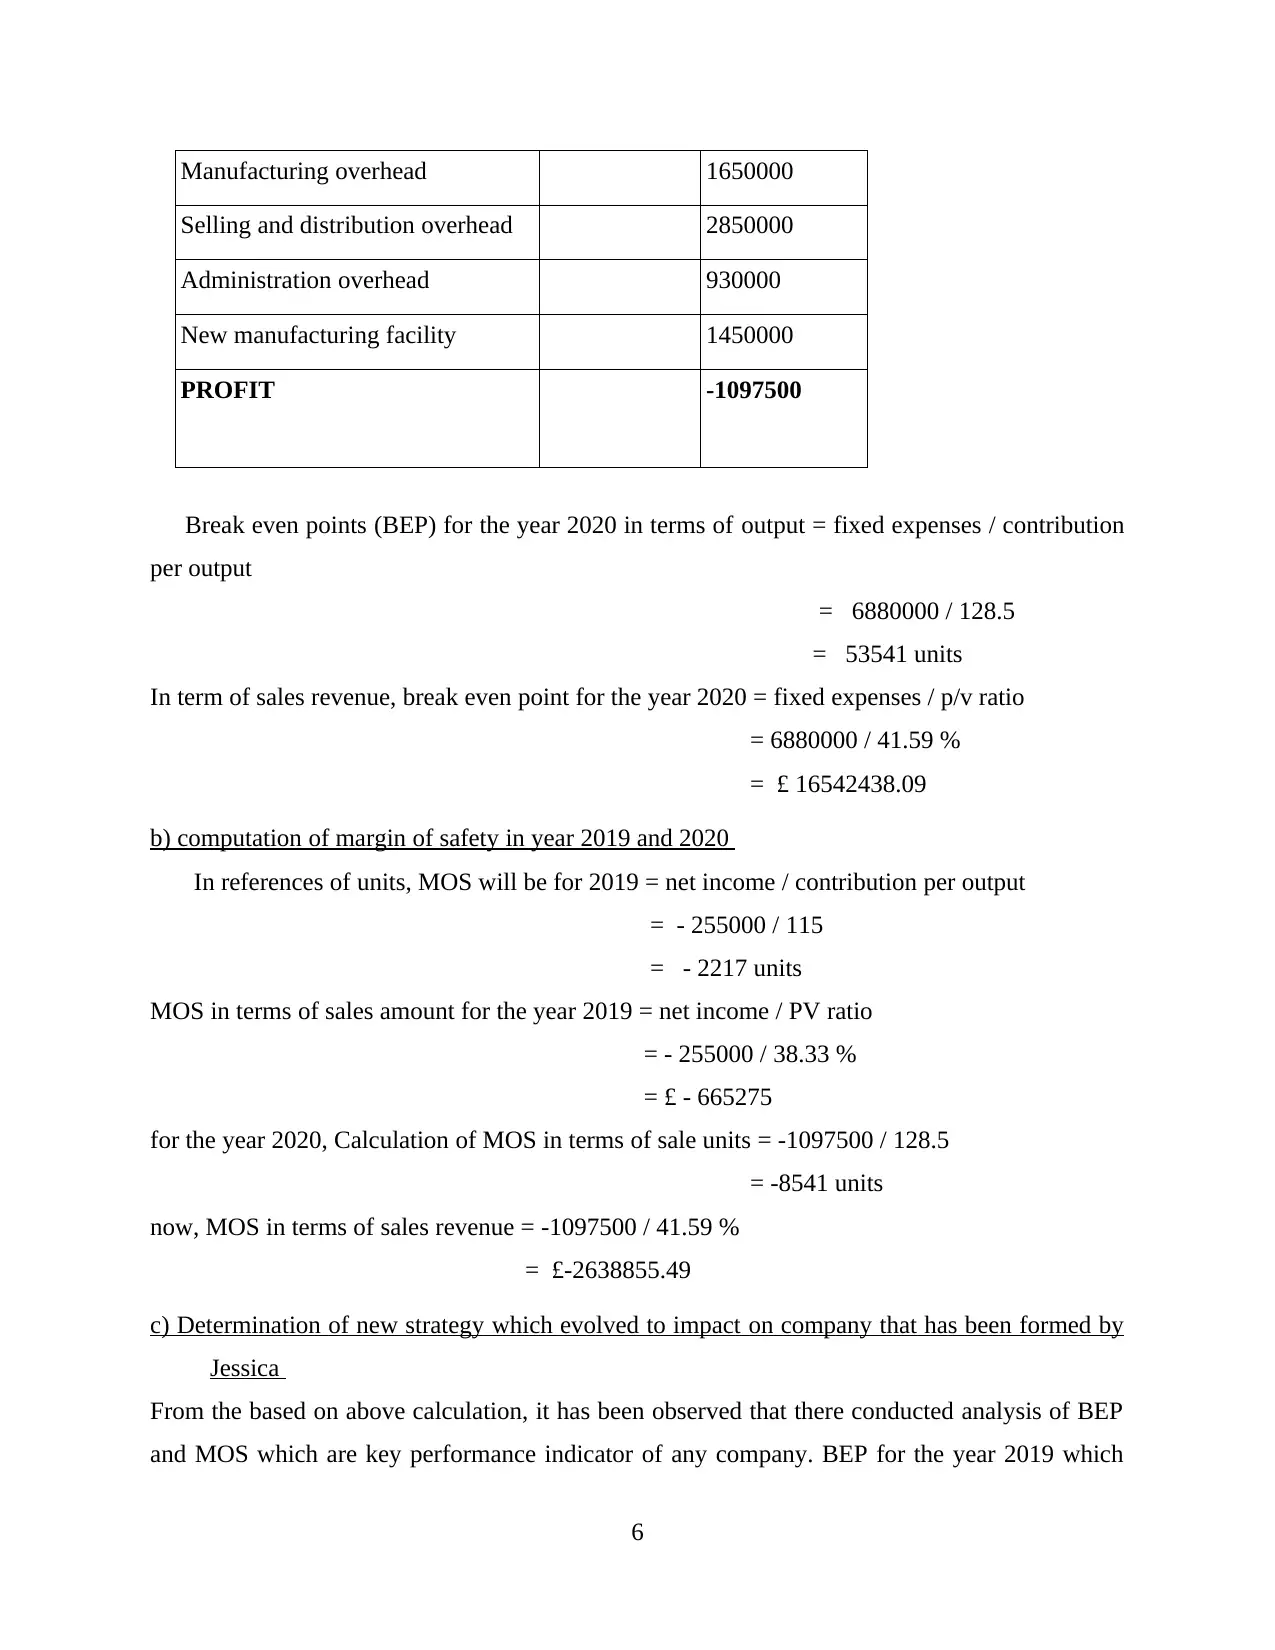
Manufacturing overhead 1650000
Selling and distribution overhead 2850000
Administration overhead 930000
New manufacturing facility 1450000
PROFIT -1097500
Break even points (BEP) for the year 2020 in terms of output = fixed expenses / contribution
per output
= 6880000 / 128.5
= 53541 units
In term of sales revenue, break even point for the year 2020 = fixed expenses / p/v ratio
= 6880000 / 41.59 %
= £ 16542438.09
b) computation of margin of safety in year 2019 and 2020
In references of units, MOS will be for 2019 = net income / contribution per output
= - 255000 / 115
= - 2217 units
MOS in terms of sales amount for the year 2019 = net income / PV ratio
= - 255000 / 38.33 %
= £ - 665275
for the year 2020, Calculation of MOS in terms of sale units = -1097500 / 128.5
= -8541 units
now, MOS in terms of sales revenue = -1097500 / 41.59 %
= £-2638855.49
c) Determination of new strategy which evolved to impact on company that has been formed by
Jessica
From the based on above calculation, it has been observed that there conducted analysis of BEP
and MOS which are key performance indicator of any company. BEP for the year 2019 which
6
⊘ This is a preview!⊘
Do you want full access?
Subscribe today to unlock all pages.
Trusted by 1+ million students worldwide
was before Jessica's strategy comes out to be 47218 units while Jessica's strategy for 2020
resultant to be 53541 units. From this, it means that new strategy need more units to reach the
level of no profit no loss situation. Company would like to prefer for old strategy in this case.
Now, when it comes to margin of safety for the year 2019 in terms of sales units was – 2217
units which signifies to they need to produce more units to comes margin level. While, for the
year 2020 was – 8541 units, when compare to 2019 it would require more units to reach on to the
level of margin. They want to beautify their income and want to enhance their boom through
income merchandising and different selling tools(Mooney and Dugan, 2019). For accomplishing
more growth prospectus, they nearly spent already 1,450,000 as a fixed expenses which is quite
raised due to ground of happening loss.
Question 4
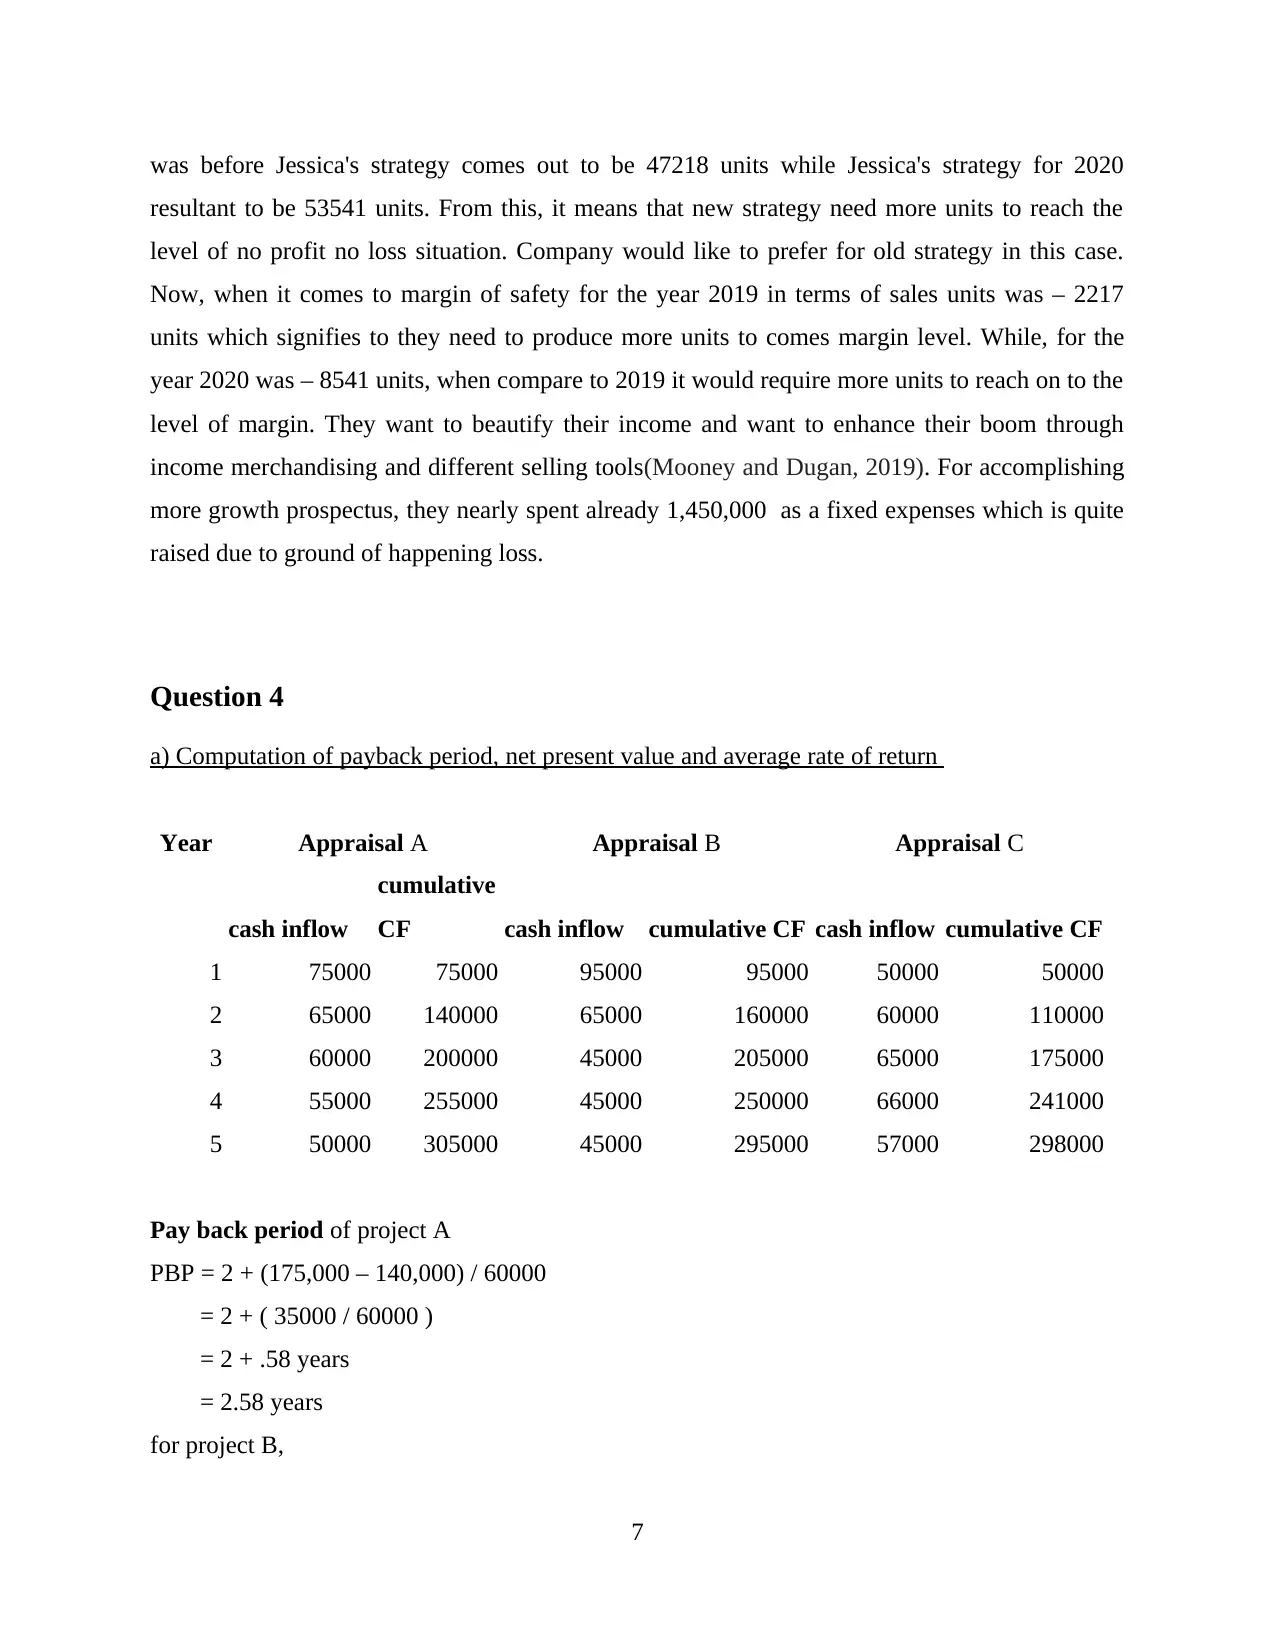
a) Computation of payback period, net present value and average rate of return
Year Appraisal A Appraisal B Appraisal C
cash inflow
cumulative
CF cash inflow cumulative CF cash inflow cumulative CF
1 75000 75000 95000 95000 50000 50000
2 65000 140000 65000 160000 60000 110000
3 60000 200000 45000 205000 65000 175000
4 55000 255000 45000 250000 66000 241000
5 50000 305000 45000 295000 57000 298000
Pay back period of project A
PBP = 2 + (175,000 – 140,000) / 60000
= 2 + ( 35000 / 60000 )
= 2 + .58 years
= 2.58 years
for project B,
7
resultant to be 53541 units. From this, it means that new strategy need more units to reach the
level of no profit no loss situation. Company would like to prefer for old strategy in this case.
Now, when it comes to margin of safety for the year 2019 in terms of sales units was – 2217
units which signifies to they need to produce more units to comes margin level. While, for the
year 2020 was – 8541 units, when compare to 2019 it would require more units to reach on to the
level of margin. They want to beautify their income and want to enhance their boom through
income merchandising and different selling tools(Mooney and Dugan, 2019). For accomplishing
more growth prospectus, they nearly spent already 1,450,000 as a fixed expenses which is quite
raised due to ground of happening loss.
Question 4
a) Computation of payback period, net present value and average rate of return
Year Appraisal A Appraisal B Appraisal C
cash inflow
cumulative
CF cash inflow cumulative CF cash inflow cumulative CF
1 75000 75000 95000 95000 50000 50000
2 65000 140000 65000 160000 60000 110000
3 60000 200000 45000 205000 65000 175000
4 55000 255000 45000 250000 66000 241000
5 50000 305000 45000 295000 57000 298000
Pay back period of project A
PBP = 2 + (175,000 – 140,000) / 60000
= 2 + ( 35000 / 60000 )
= 2 + .58 years
= 2.58 years
for project B,
7
Paraphrase This Document
Need a fresh take? Get an instant paraphrase of this document with our AI Paraphraser
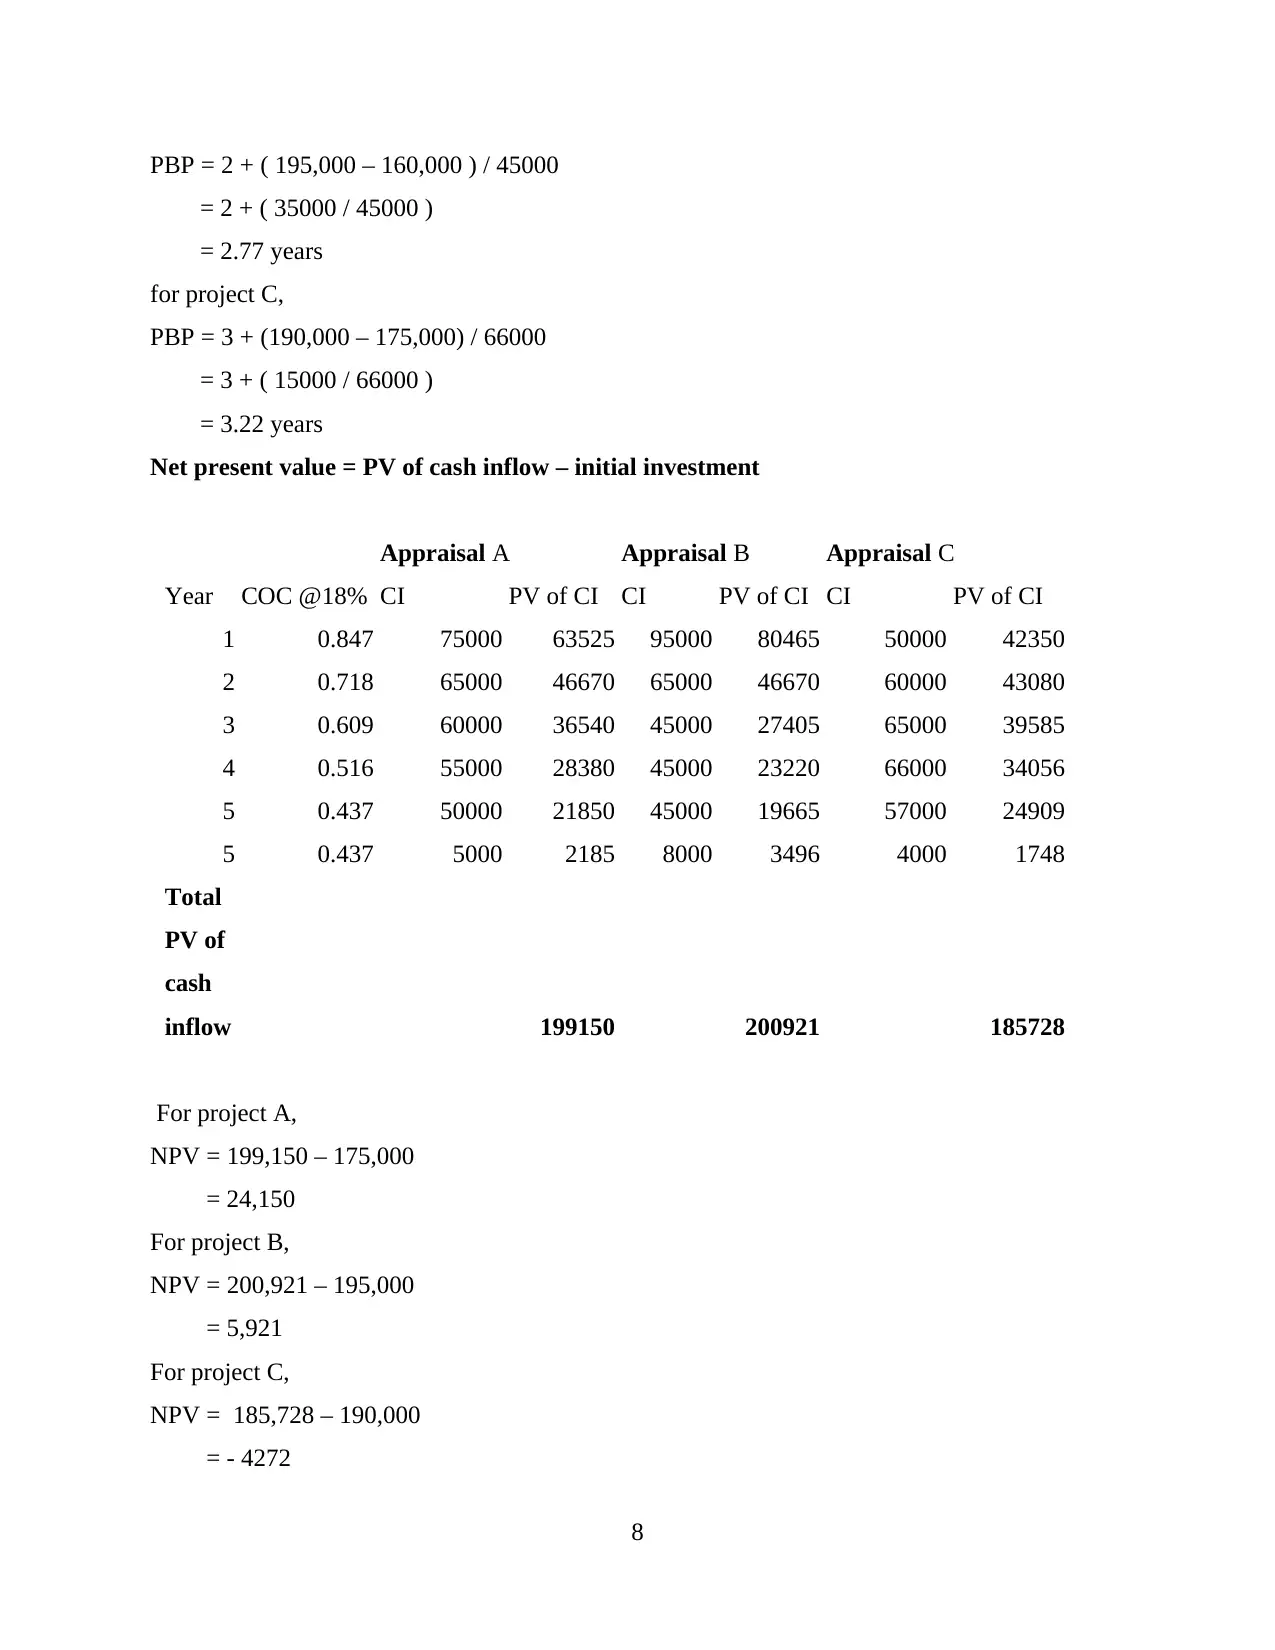
PBP = 2 + ( 195,000 – 160,000 ) / 45000
= 2 + ( 35000 / 45000 )
= 2.77 years
for project C,
PBP = 3 + (190,000 – 175,000) / 66000
= 3 + ( 15000 / 66000 )
= 3.22 years
Net present value = PV of cash inflow – initial investment
Appraisal A Appraisal B Appraisal C
Year COC @18% CI PV of CI CI PV of CI CI PV of CI
1 0.847 75000 63525 95000 80465 50000 42350
2 0.718 65000 46670 65000 46670 60000 43080
3 0.609 60000 36540 45000 27405 65000 39585
4 0.516 55000 28380 45000 23220 66000 34056
5 0.437 50000 21850 45000 19665 57000 24909
5 0.437 5000 2185 8000 3496 4000 1748
Total
PV of
cash
inflow 199150 200921 185728
For project A,
NPV = 199,150 – 175,000
= 24,150
For project B,
NPV = 200,921 – 195,000
= 5,921
For project C,
NPV = 185,728 – 190,000
= - 4272
8
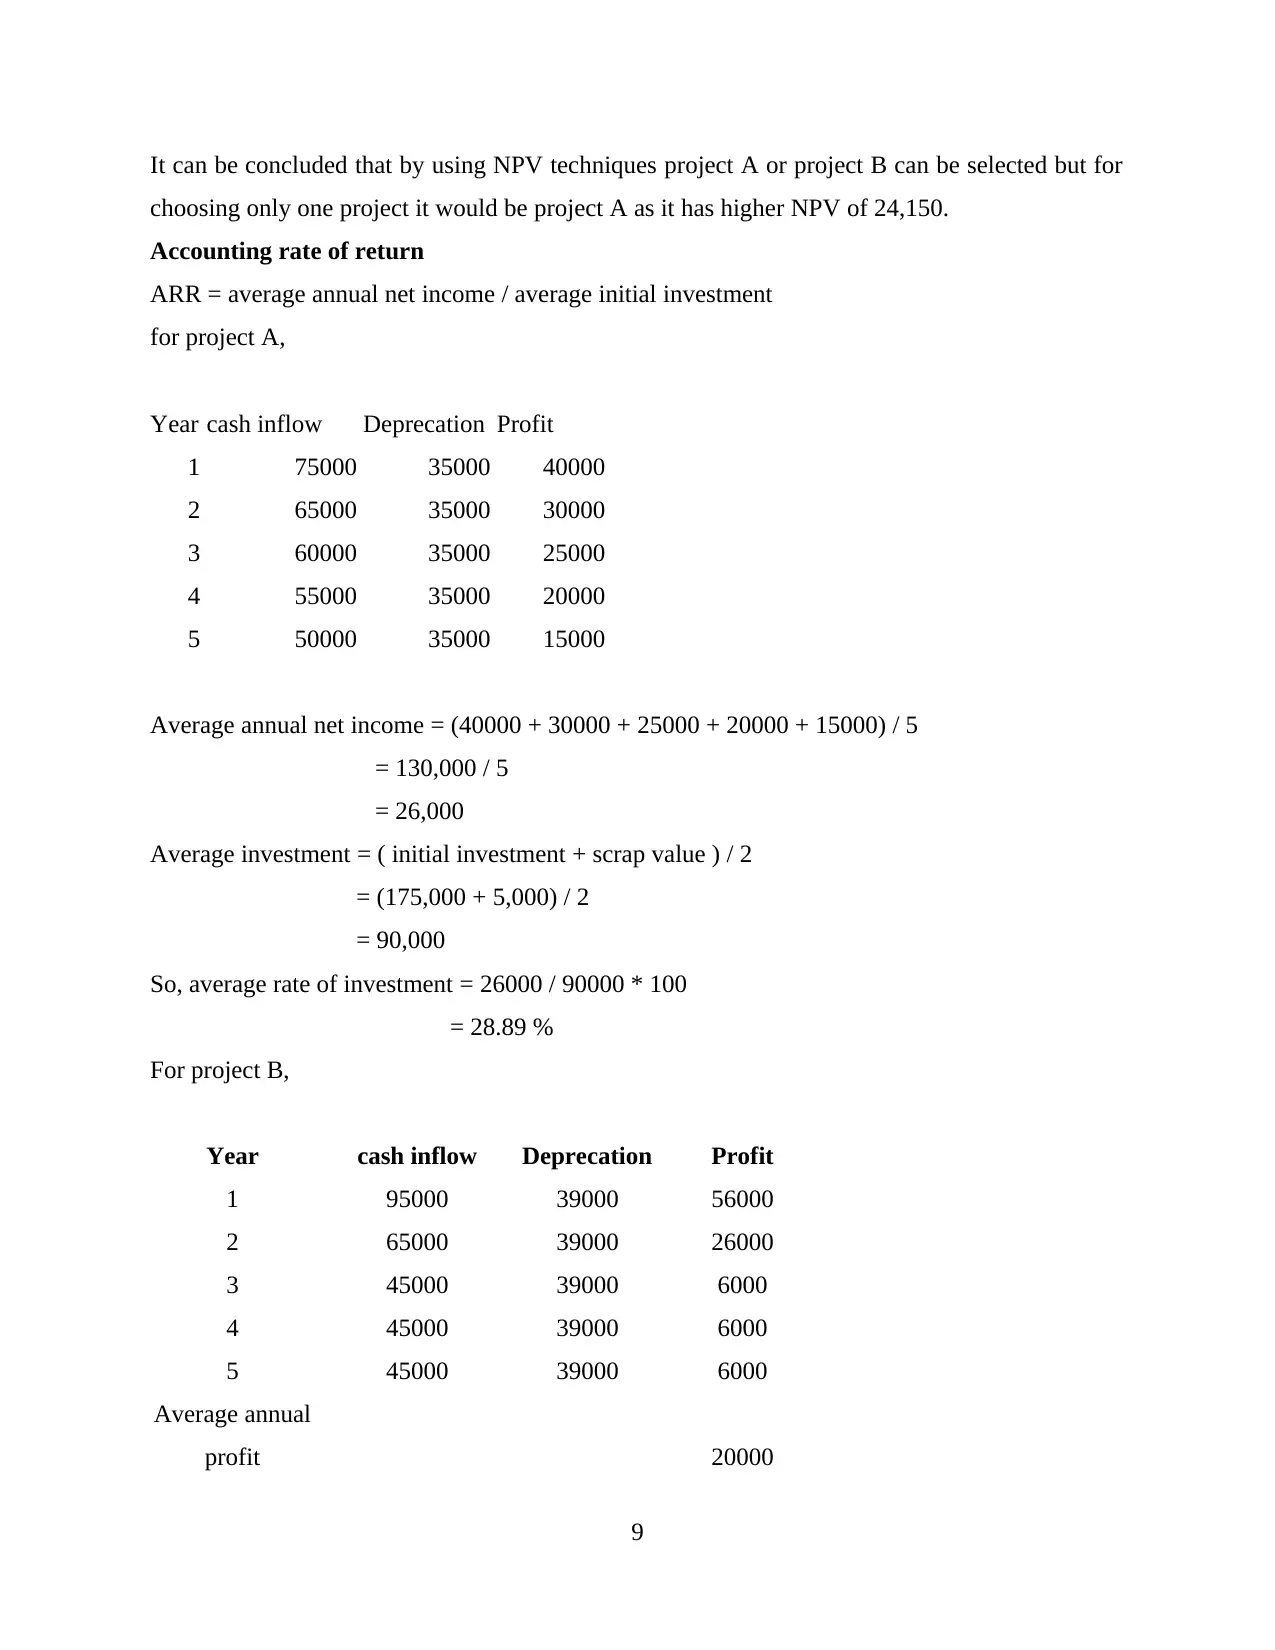
It can be concluded that by using NPV techniques project A or project B can be selected but for
choosing only one project it would be project A as it has higher NPV of 24,150.
Accounting rate of return
ARR = average annual net income / average initial investment
for project A,
Year cash inflow Deprecation Profit
1 75000 35000 40000
2 65000 35000 30000
3 60000 35000 25000
4 55000 35000 20000
5 50000 35000 15000
Average annual net income = (40000 + 30000 + 25000 + 20000 + 15000) / 5
= 130,000 / 5
= 26,000
Average investment = ( initial investment + scrap value ) / 2
= (175,000 + 5,000) / 2
= 90,000
So, average rate of investment = 26000 / 90000 * 100
= 28.89 %
For project B,
Year cash inflow Deprecation Profit
1 95000 39000 56000
2 65000 39000 26000
3 45000 39000 6000
4 45000 39000 6000
5 45000 39000 6000
Average annual
profit 20000
9
⊘ This is a preview!⊘
Do you want full access?
Subscribe today to unlock all pages.
Trusted by 1+ million students worldwide
1 out of 18
Related Documents


Your All-in-One AI-Powered Toolkit for Academic Success.
+13062052269
info@desklib.com
Available 24*7 on WhatsApp / Email
![[object Object]](/_next/static/media/star-bottom.7253800d.svg)
Unlock your academic potential
Copyright © 2020–2026 A2Z Services. All Rights Reserved. Developed and managed by ZUCOL.