Financial Analysis and Management: Nestle, Sainsbury's, and Tesco
VerifiedAdded on 2021/02/19
|23
|4248
|199
Report
AI Summary
This report offers a detailed financial analysis of Nestle, focusing on its performance in relation to major clients Sainsbury's and Tesco. It begins with an introduction to financial analysis and its importance in assessing a company's profitability and liquidity. The core of the report involves a comprehensive ratio analysis, including liquidity, turnover, and profitability ratios, comparing the financial health of the companies from 2015-2019. The analysis includes interpretations of current and quick ratios to assess liquidity, inventory and total asset turnover ratios to evaluate efficiency, and gross, net, and operating profit margins to gauge profitability. Furthermore, the report examines working capital management and provides an interpretation of the cash flow statements for the chosen companies. The analysis utilizes financial data to assess the companies' financial stability and performance over the specified period, offering insights into their strengths and weaknesses.
Financial analysis
management and
enterprise
management and
enterprise
Paraphrase This Document
Need a fresh take? Get an instant paraphrase of this document with our AI Paraphraser
Table of Contents
INTRODUCTION...........................................................................................................................1
Ratio Analysis..................................................................................................................................1
Liquidity ratios: ...........................................................................................................................1
Turnover ratios: ..........................................................................................................................4
Profitability ratios: ......................................................................................................................6
Analysis of working capital position.............................................................................................13
Interpretation of cash flow statement.............................................................................................14
CONCLUSION..............................................................................................................................15
REFERENCES .............................................................................................................................16
APPENDIX....................................................................................................................................17
INTRODUCTION
Financial analysis management plays a crucial role in determining profitability and
liquidity state of a company. In a broader sense, financial performance refers to a degree which
help organisations to measure their cash flow position by diversifying the transactions into
operating, financing and investing activity. Also, in order to obtain an accurate picture of
financial stability of a company, ratio analysis is considered to be the best technique. For this
report, a large Asian food manufacturer is chosen i.e. Nestle who has two major clients which are
Sainsbury's and Tesco. They both are large supermarkets based in London, UK and offer a wide
range of products & services to the customers under a single roof. The following report
highlights on a vertical, horizontal ratio analysis for both the organisations, importance of
working capital management. Also, a detailed analysis of cash flow position of the companies
are also included under this report (Brustbauer, 2016).
Ratio Analysis
Ratio analysis refers to a technique of comparing the line items in financial statements of
a company. It has a broader aspect and covers a variety of ratios like liquidity, profitability,
efficiency, turnover etc. Some of them are mentioned below in reference with Sainsbury's and
Tesco.
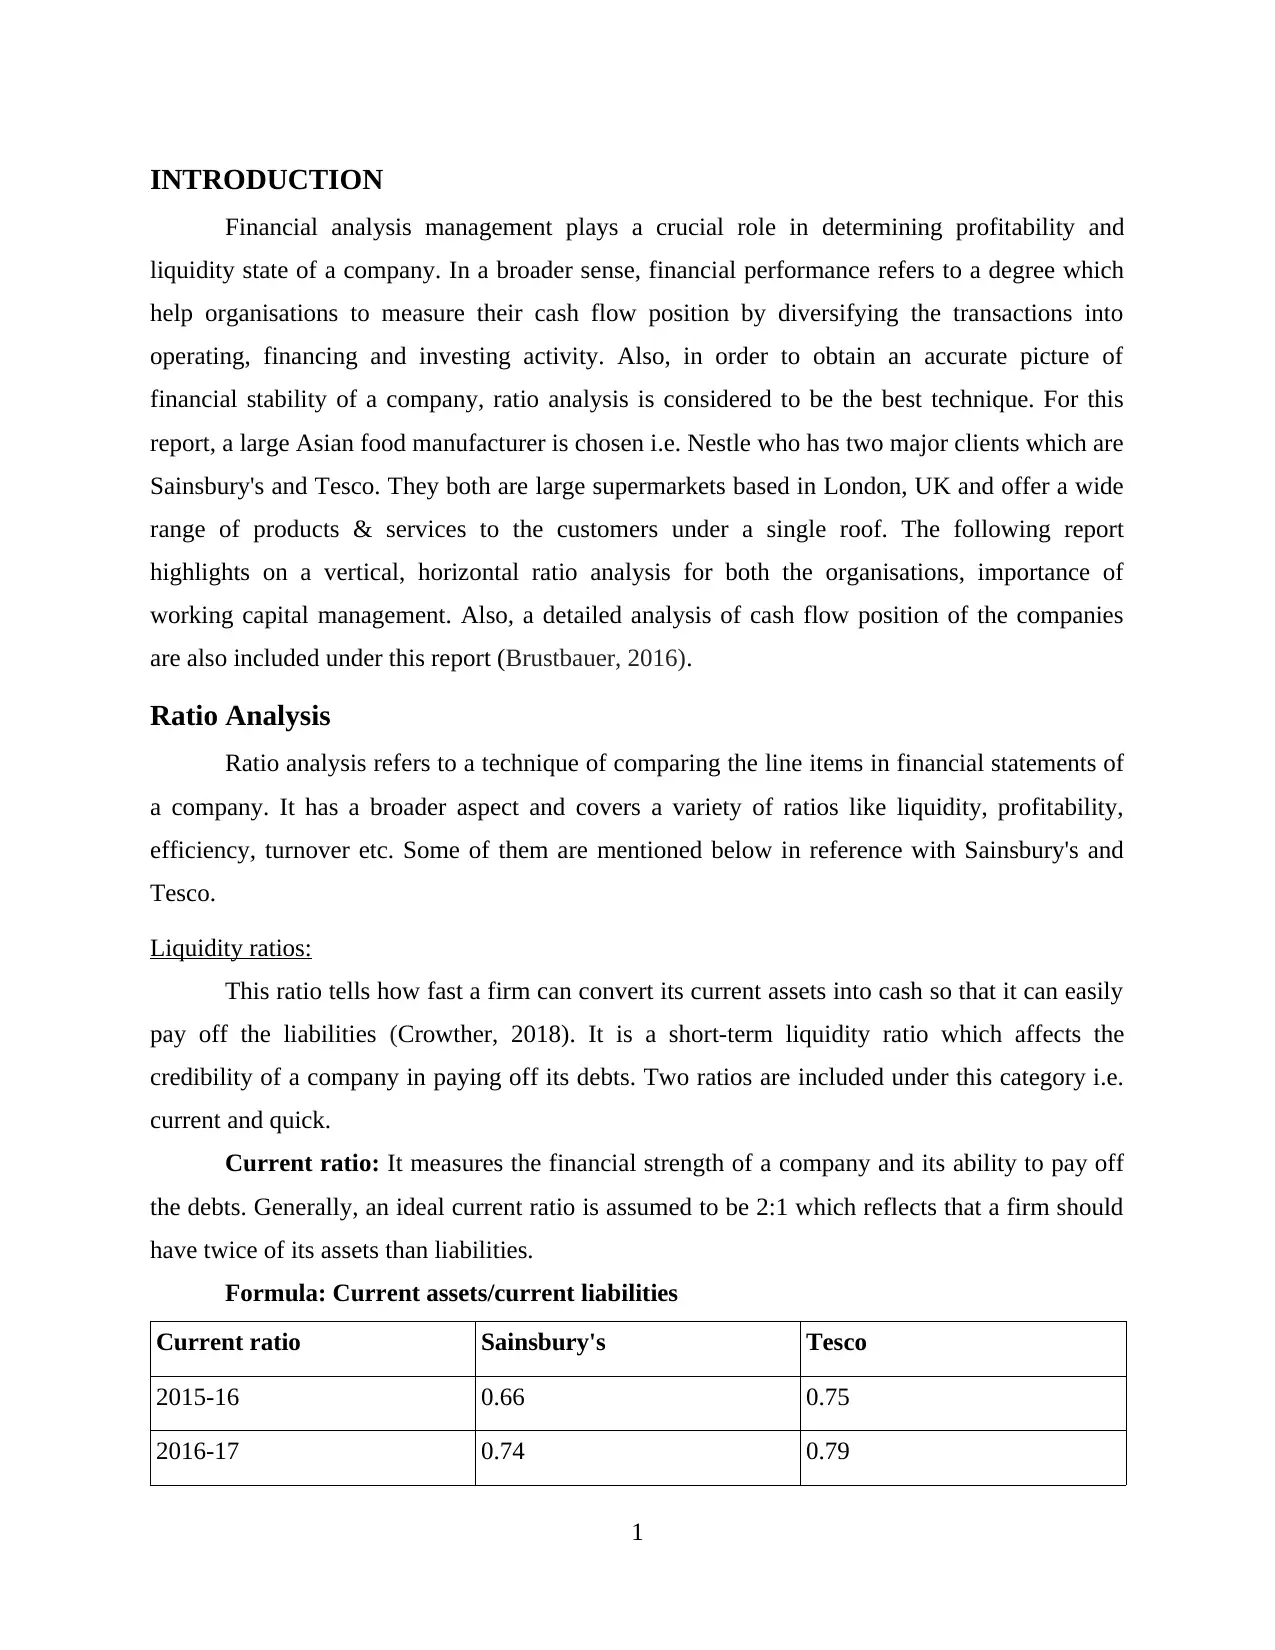
Liquidity ratios:
This ratio tells how fast a firm can convert its current assets into cash so that it can easily
pay off the liabilities (Crowther, 2018). It is a short-term liquidity ratio which affects the
credibility of a company in paying off its debts. Two ratios are included under this category i.e.
current and quick.
Current ratio: It measures the financial strength of a company and its ability to pay off
the debts. Generally, an ideal current ratio is assumed to be 2:1 which reflects that a firm should
have twice of its assets than liabilities.
Formula: Current assets/current liabilities
Current ratio Sainsbury's Tesco
2015-16 0.66 0.75
2016-17 0.74 0.79
1
Financial analysis management plays a crucial role in determining profitability and
liquidity state of a company. In a broader sense, financial performance refers to a degree which
help organisations to measure their cash flow position by diversifying the transactions into
operating, financing and investing activity. Also, in order to obtain an accurate picture of
financial stability of a company, ratio analysis is considered to be the best technique. For this
report, a large Asian food manufacturer is chosen i.e. Nestle who has two major clients which are
Sainsbury's and Tesco. They both are large supermarkets based in London, UK and offer a wide
range of products & services to the customers under a single roof. The following report
highlights on a vertical, horizontal ratio analysis for both the organisations, importance of
working capital management. Also, a detailed analysis of cash flow position of the companies
are also included under this report (Brustbauer, 2016).
Ratio Analysis
Ratio analysis refers to a technique of comparing the line items in financial statements of
a company. It has a broader aspect and covers a variety of ratios like liquidity, profitability,
efficiency, turnover etc. Some of them are mentioned below in reference with Sainsbury's and
Tesco.
Liquidity ratios:
This ratio tells how fast a firm can convert its current assets into cash so that it can easily
pay off the liabilities (Crowther, 2018). It is a short-term liquidity ratio which affects the
credibility of a company in paying off its debts. Two ratios are included under this category i.e.
current and quick.
Current ratio: It measures the financial strength of a company and its ability to pay off
the debts. Generally, an ideal current ratio is assumed to be 2:1 which reflects that a firm should
have twice of its assets than liabilities.
Formula: Current assets/current liabilities
Current ratio Sainsbury's Tesco
2015-16 0.66 0.75
2016-17 0.74 0.79
1
⊘ This is a preview!⊘
Do you want full access?
Subscribe today to unlock all pages.
Trusted by 1+ million students worldwide
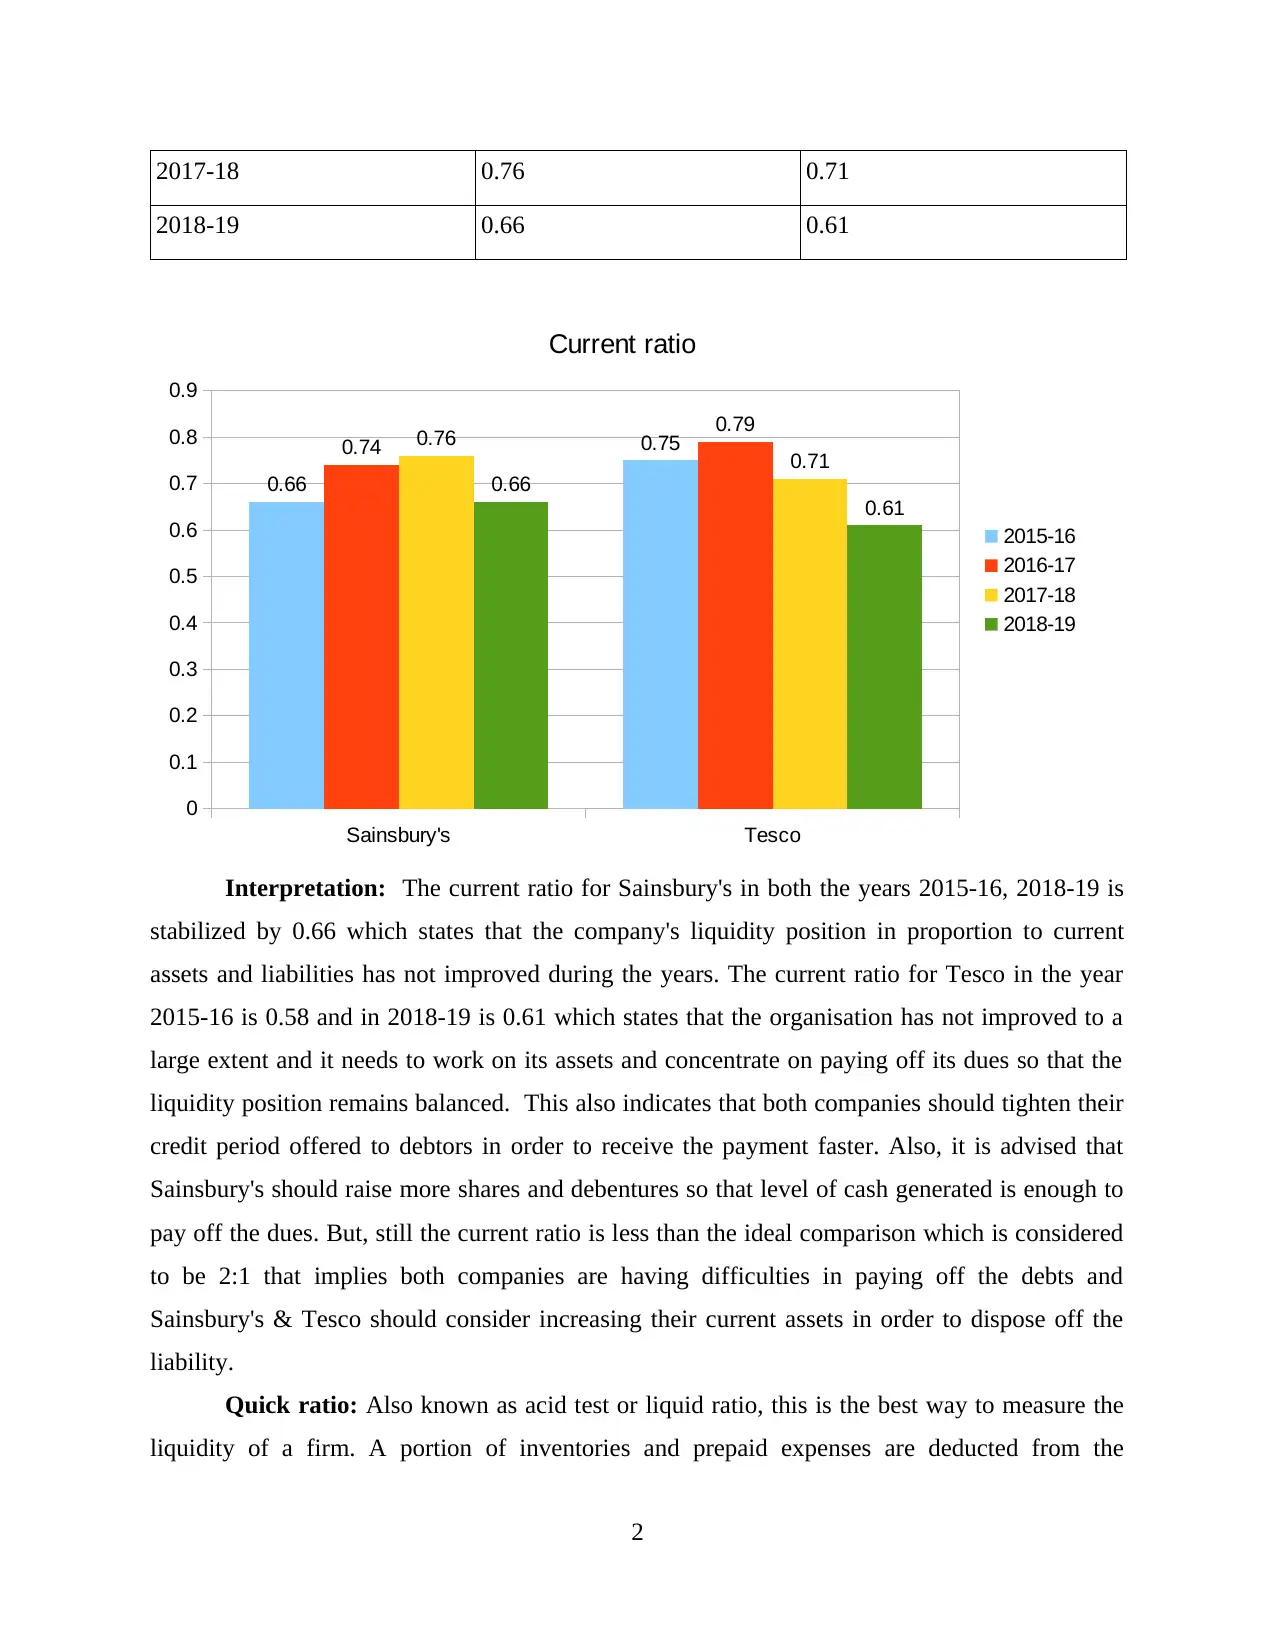
2017-18 0.76 0.71
2018-19 0.66 0.61
Sainsbury's Tesco
0
0.1
0.2
0.3
0.4
0.5
0.6
0.7
0.8
0.9
0.66
0.750.74
0.79
0.76
0.71
0.66
0.61
Current ratio
2015-16
2016-17
2017-18
2018-19
Interpretation: The current ratio for Sainsbury's in both the years 2015-16, 2018-19 is
stabilized by 0.66 which states that the company's liquidity position in proportion to current
assets and liabilities has not improved during the years. The current ratio for Tesco in the year
2015-16 is 0.58 and in 2018-19 is 0.61 which states that the organisation has not improved to a
large extent and it needs to work on its assets and concentrate on paying off its dues so that the
liquidity position remains balanced. This also indicates that both companies should tighten their
credit period offered to debtors in order to receive the payment faster. Also, it is advised that
Sainsbury's should raise more shares and debentures so that level of cash generated is enough to
pay off the dues. But, still the current ratio is less than the ideal comparison which is considered
to be 2:1 that implies both companies are having difficulties in paying off the debts and
Sainsbury's & Tesco should consider increasing their current assets in order to dispose off the
liability.
Quick ratio: Also known as acid test or liquid ratio, this is the best way to measure the
liquidity of a firm. A portion of inventories and prepaid expenses are deducted from the
2
Paraphrase This Document
Need a fresh take? Get an instant paraphrase of this document with our AI Paraphraser
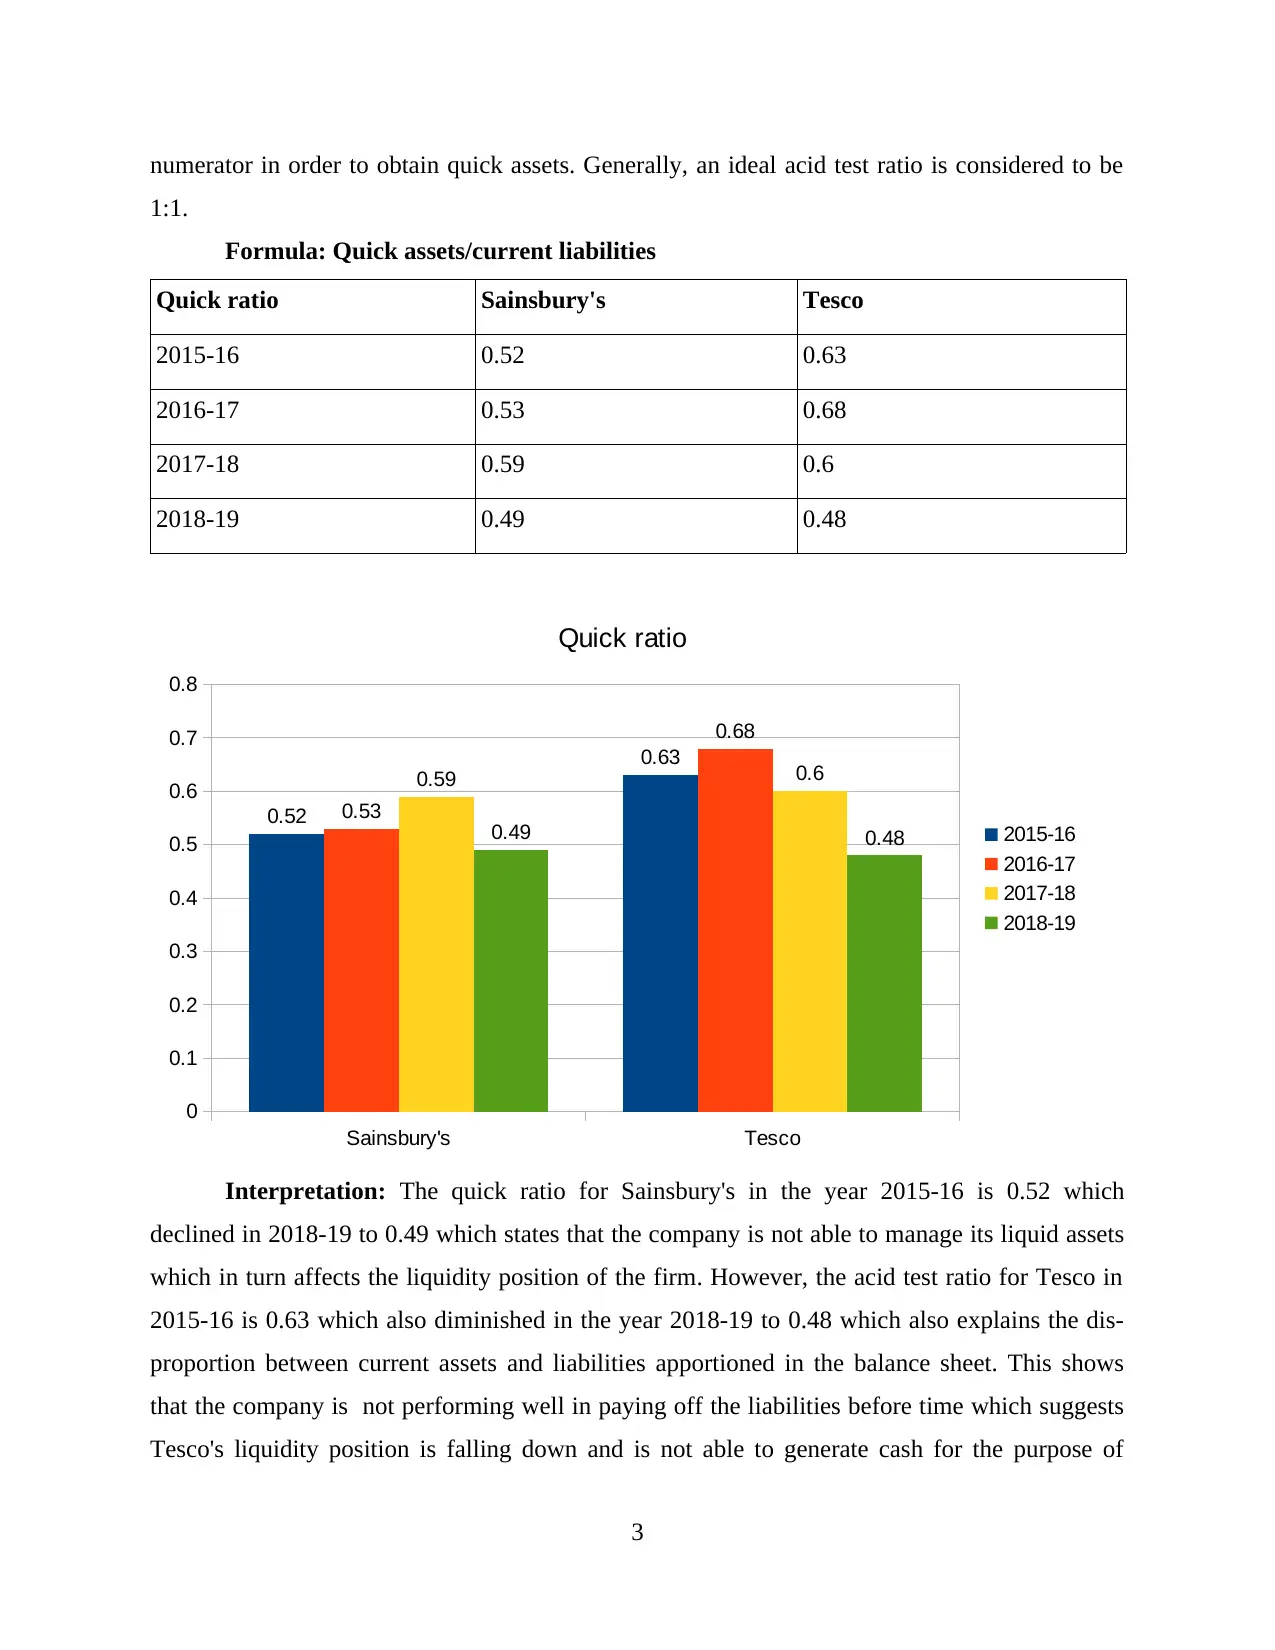
numerator in order to obtain quick assets. Generally, an ideal acid test ratio is considered to be
1:1.
Formula: Quick assets/current liabilities
Quick ratio Sainsbury's Tesco
2015-16 0.52 0.63
2016-17 0.53 0.68
2017-18 0.59 0.6
2018-19 0.49 0.48
Sainsbury's Tesco
0
0.1
0.2
0.3
0.4
0.5
0.6
0.7
0.8
0.52
0.63
0.53
0.68
0.59 0.6
0.49 0.48
Quick ratio
2015-16
2016-17
2017-18
2018-19
Interpretation: The quick ratio for Sainsbury's in the year 2015-16 is 0.52 which
declined in 2018-19 to 0.49 which states that the company is not able to manage its liquid assets
which in turn affects the liquidity position of the firm. However, the acid test ratio for Tesco in
2015-16 is 0.63 which also diminished in the year 2018-19 to 0.48 which also explains the dis-
proportion between current assets and liabilities apportioned in the balance sheet. This shows
that the company is not performing well in paying off the liabilities before time which suggests
Tesco's liquidity position is falling down and is not able to generate cash for the purpose of
3
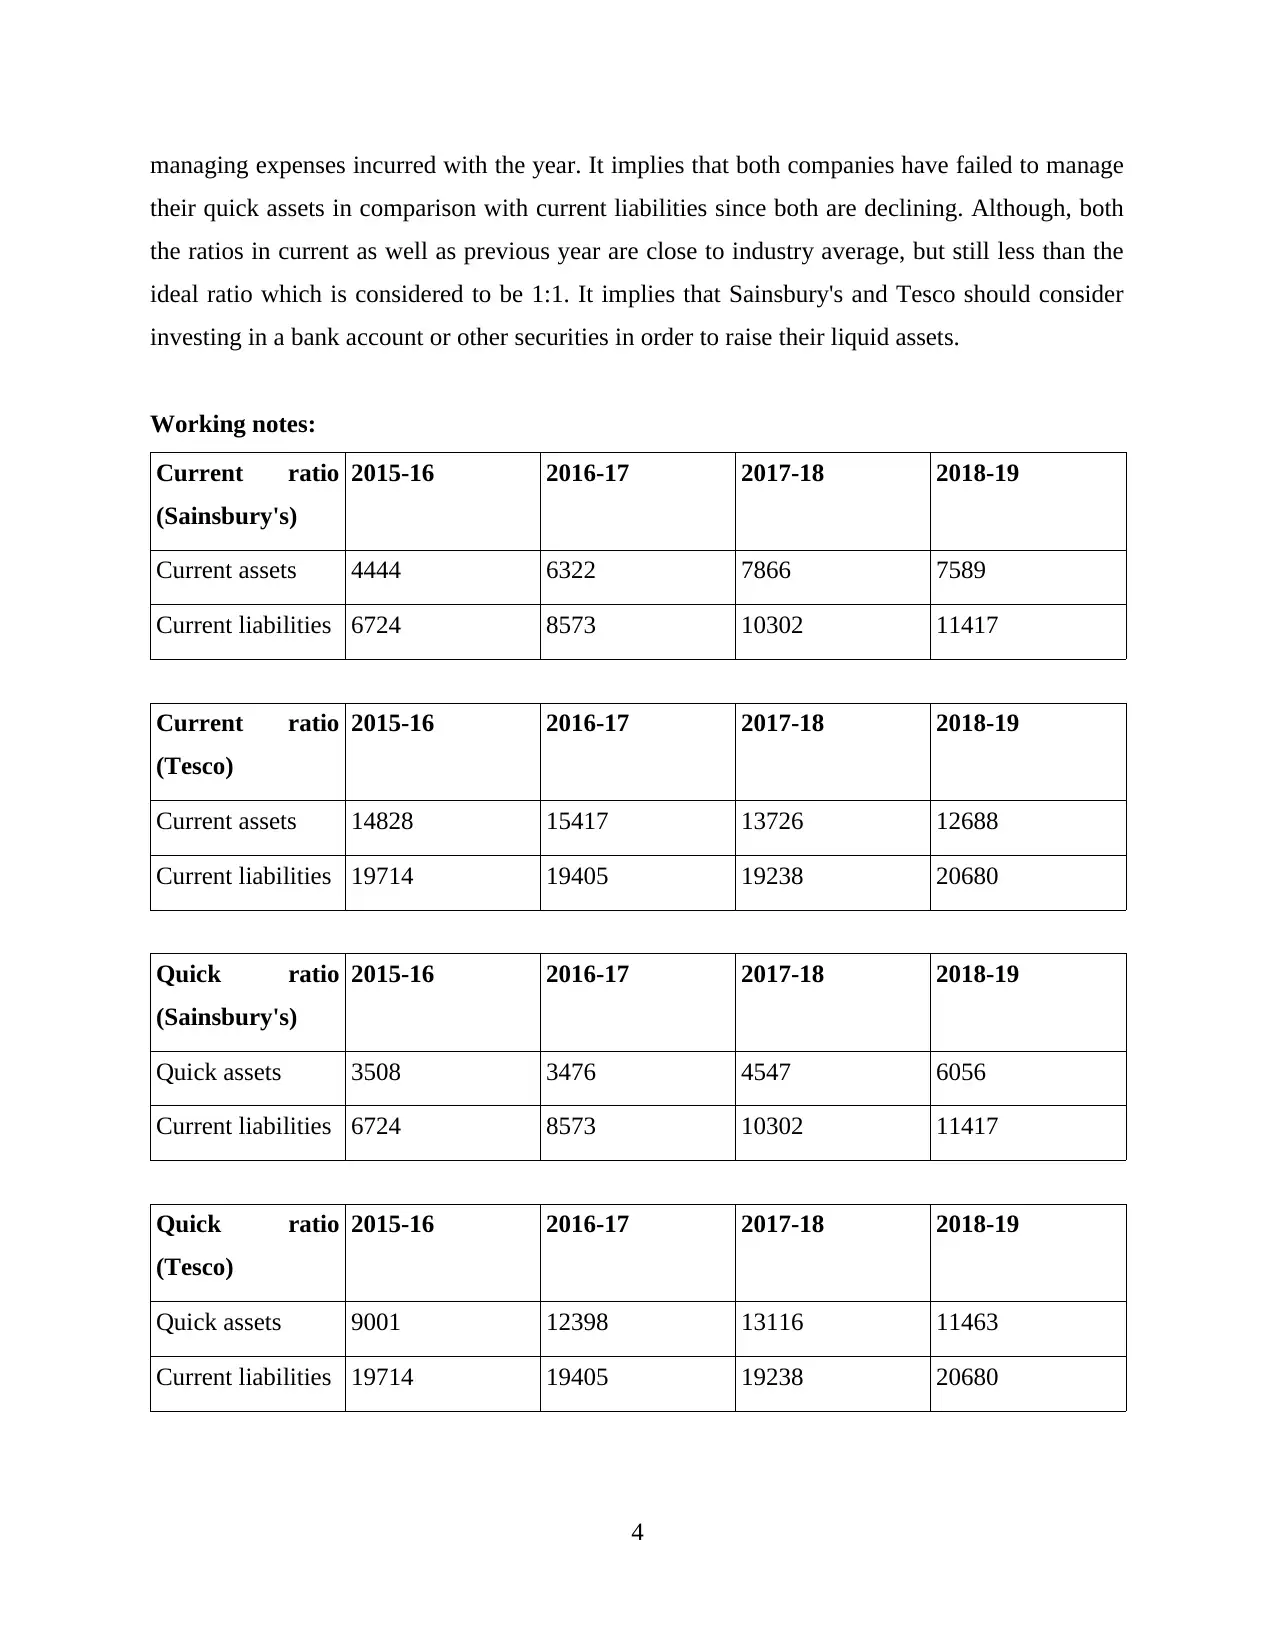
managing expenses incurred with the year. It implies that both companies have failed to manage
their quick assets in comparison with current liabilities since both are declining. Although, both
the ratios in current as well as previous year are close to industry average, but still less than the
ideal ratio which is considered to be 1:1. It implies that Sainsbury's and Tesco should consider
investing in a bank account or other securities in order to raise their liquid assets.
Working notes:
Current ratio
(Sainsbury's)
2015-16 2016-17 2017-18 2018-19
Current assets 4444 6322 7866 7589
Current liabilities 6724 8573 10302 11417
Current ratio
(Tesco)
2015-16 2016-17 2017-18 2018-19
Current assets 14828 15417 13726 12688
Current liabilities 19714 19405 19238 20680
Quick ratio
(Sainsbury's)
2015-16 2016-17 2017-18 2018-19
Quick assets 3508 3476 4547 6056
Current liabilities 6724 8573 10302 11417
Quick ratio
(Tesco)
2015-16 2016-17 2017-18 2018-19
Quick assets 9001 12398 13116 11463
Current liabilities 19714 19405 19238 20680
4
⊘ This is a preview!⊘
Do you want full access?
Subscribe today to unlock all pages.
Trusted by 1+ million students worldwide
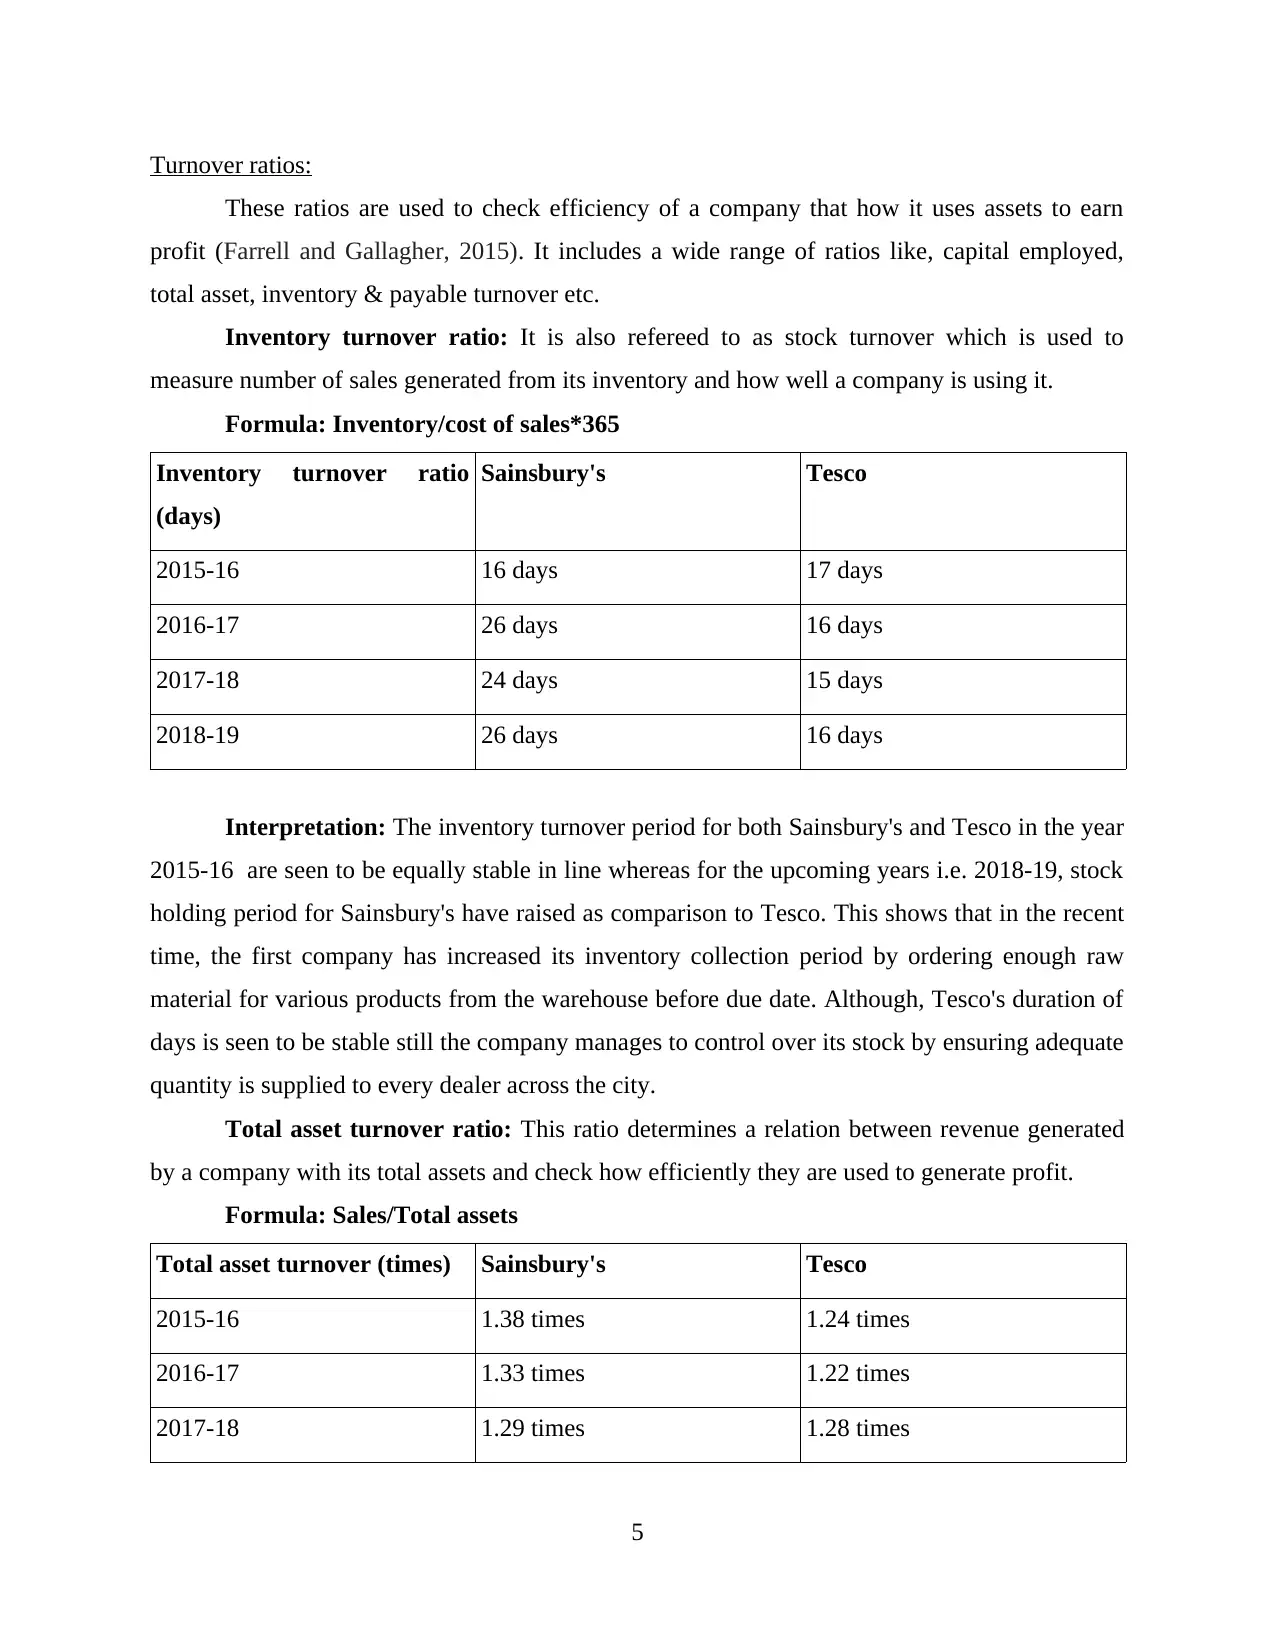
Turnover ratios:
These ratios are used to check efficiency of a company that how it uses assets to earn
profit (Farrell and Gallagher, 2015). It includes a wide range of ratios like, capital employed,
total asset, inventory & payable turnover etc.
Inventory turnover ratio: It is also refereed to as stock turnover which is used to
measure number of sales generated from its inventory and how well a company is using it.
Formula: Inventory/cost of sales*365
Inventory turnover ratio
(days)
Sainsbury's Tesco
2015-16 16 days 17 days
2016-17 26 days 16 days
2017-18 24 days 15 days
2018-19 26 days 16 days
Interpretation: The inventory turnover period for both Sainsbury's and Tesco in the year
2015-16 are seen to be equally stable in line whereas for the upcoming years i.e. 2018-19, stock
holding period for Sainsbury's have raised as comparison to Tesco. This shows that in the recent
time, the first company has increased its inventory collection period by ordering enough raw
material for various products from the warehouse before due date. Although, Tesco's duration of
days is seen to be stable still the company manages to control over its stock by ensuring adequate
quantity is supplied to every dealer across the city.
Total asset turnover ratio: This ratio determines a relation between revenue generated
by a company with its total assets and check how efficiently they are used to generate profit.
Formula: Sales/Total assets
Total asset turnover (times) Sainsbury's Tesco
2015-16 1.38 times 1.24 times
2016-17 1.33 times 1.22 times
2017-18 1.29 times 1.28 times
5
Paraphrase This Document
Need a fresh take? Get an instant paraphrase of this document with our AI Paraphraser
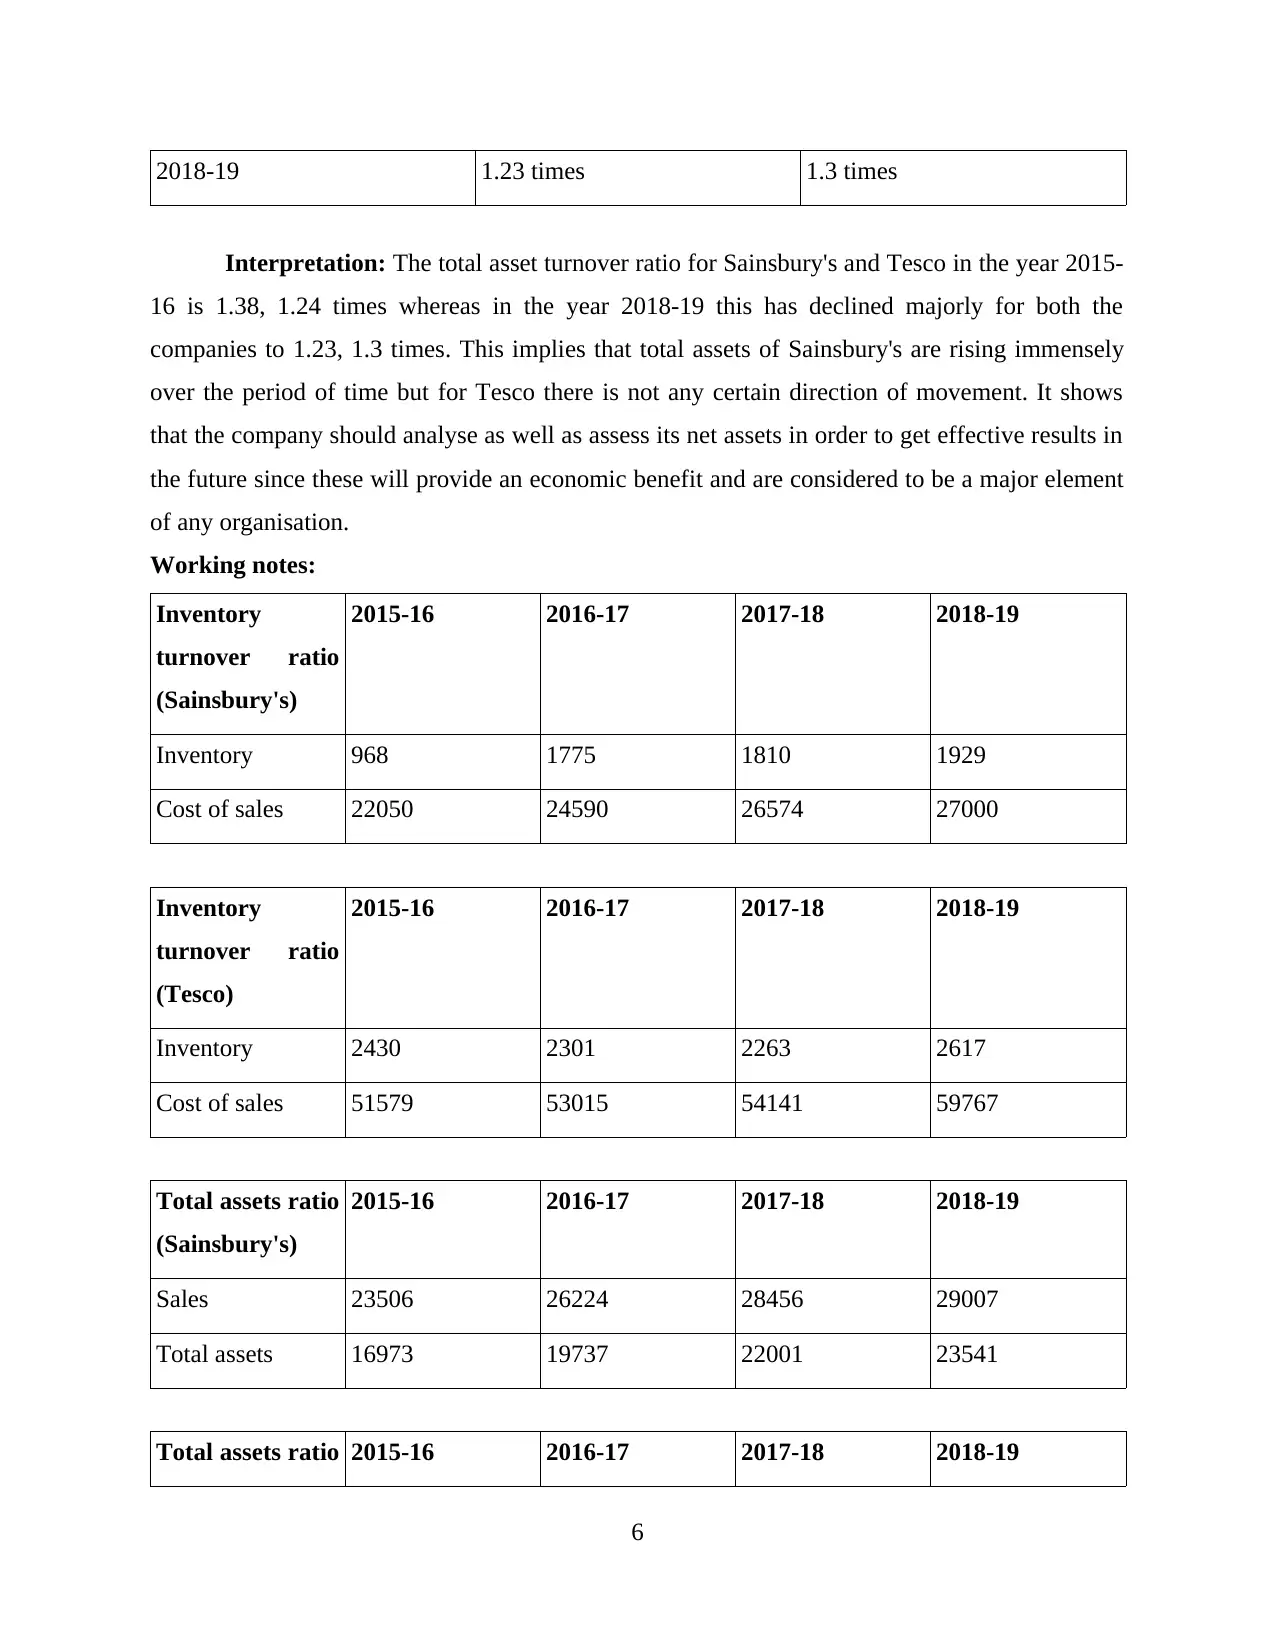
2018-19 1.23 times 1.3 times
Interpretation: The total asset turnover ratio for Sainsbury's and Tesco in the year 2015-
16 is 1.38, 1.24 times whereas in the year 2018-19 this has declined majorly for both the
companies to 1.23, 1.3 times. This implies that total assets of Sainsbury's are rising immensely
over the period of time but for Tesco there is not any certain direction of movement. It shows
that the company should analyse as well as assess its net assets in order to get effective results in
the future since these will provide an economic benefit and are considered to be a major element
of any organisation.
Working notes:
Inventory
turnover ratio
(Sainsbury's)
2015-16 2016-17 2017-18 2018-19
Inventory 968 1775 1810 1929
Cost of sales 22050 24590 26574 27000
Inventory
turnover ratio
(Tesco)
2015-16 2016-17 2017-18 2018-19
Inventory 2430 2301 2263 2617
Cost of sales 51579 53015 54141 59767
Total assets ratio
(Sainsbury's)
2015-16 2016-17 2017-18 2018-19
Sales 23506 26224 28456 29007
Total assets 16973 19737 22001 23541
Total assets ratio 2015-16 2016-17 2017-18 2018-19
6
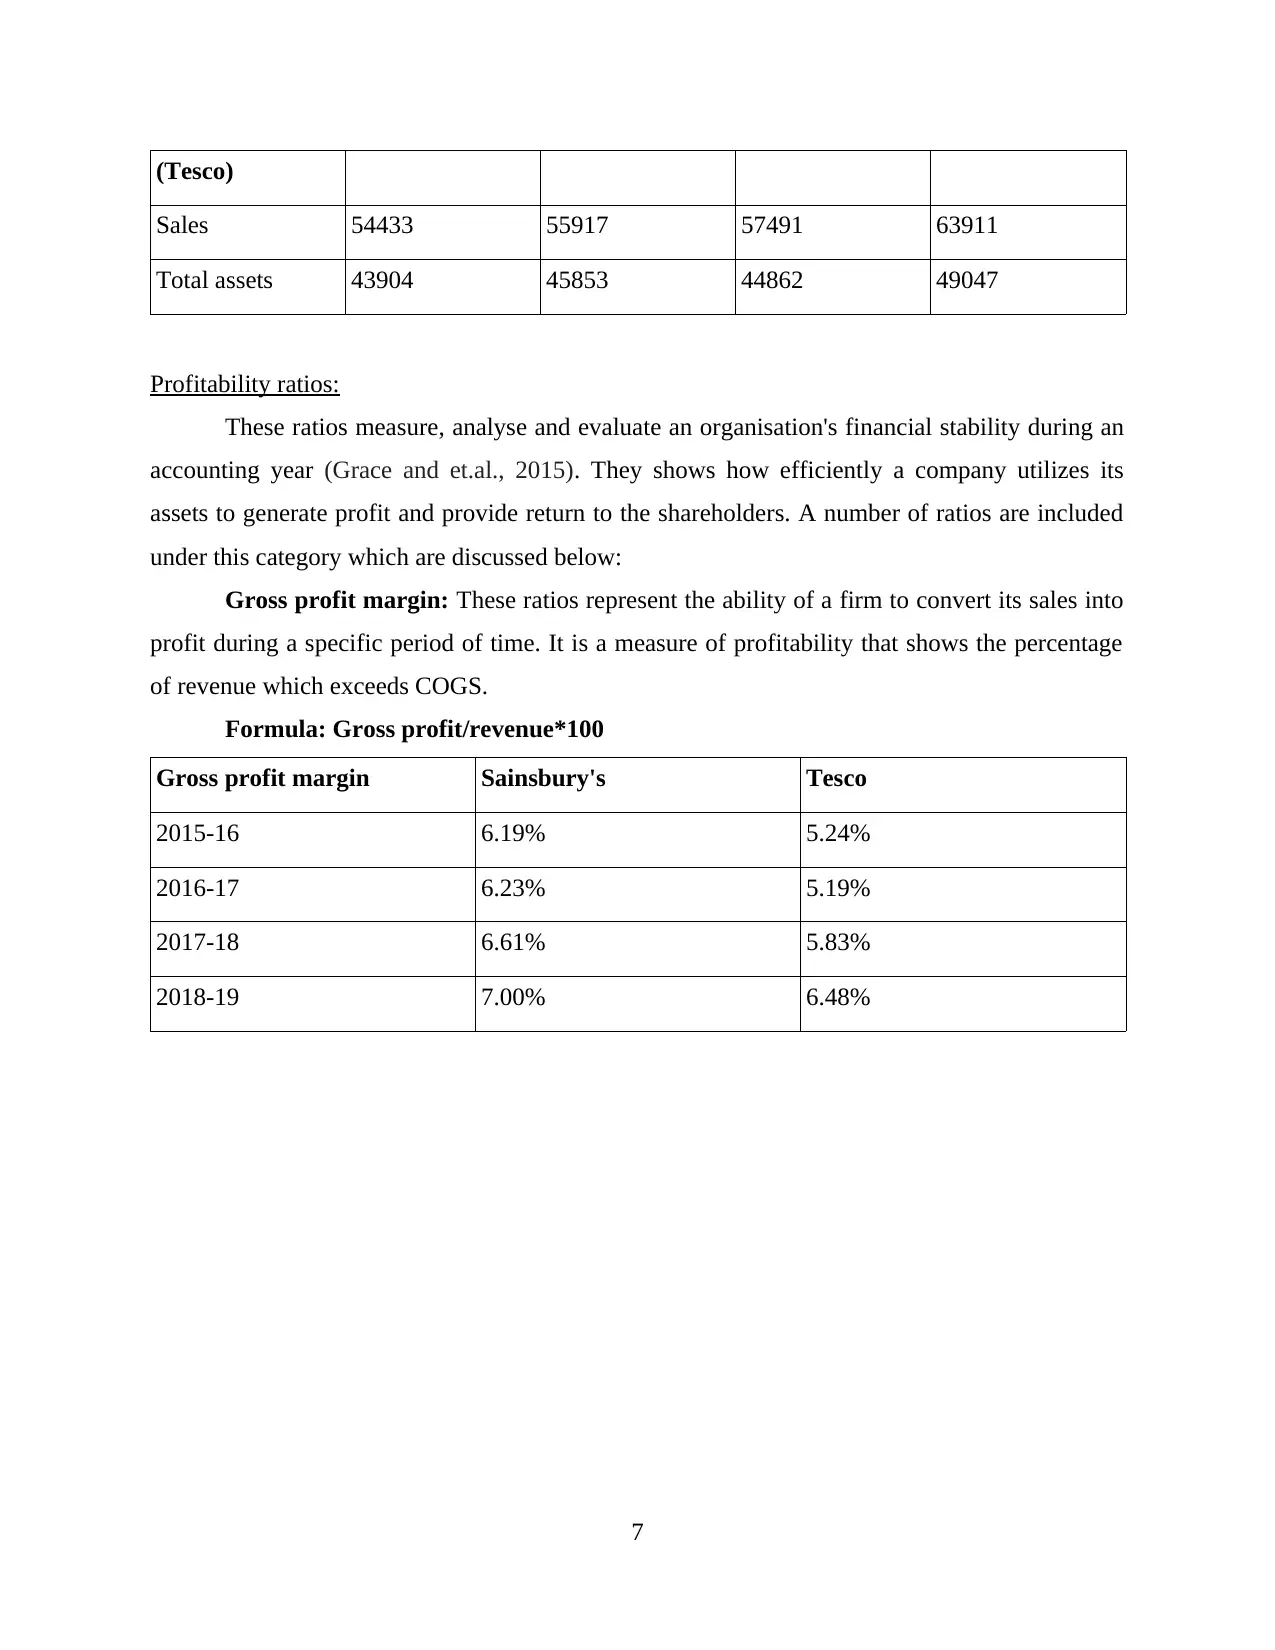
(Tesco)
Sales 54433 55917 57491 63911
Total assets 43904 45853 44862 49047
Profitability ratios:
These ratios measure, analyse and evaluate an organisation's financial stability during an
accounting year (Grace and et.al., 2015). They shows how efficiently a company utilizes its
assets to generate profit and provide return to the shareholders. A number of ratios are included
under this category which are discussed below:
Gross profit margin: These ratios represent the ability of a firm to convert its sales into
profit during a specific period of time. It is a measure of profitability that shows the percentage
of revenue which exceeds COGS.
Formula: Gross profit/revenue*100
Gross profit margin Sainsbury's Tesco
2015-16 6.19% 5.24%
2016-17 6.23% 5.19%
2017-18 6.61% 5.83%
2018-19 7.00% 6.48%
7
⊘ This is a preview!⊘
Do you want full access?
Subscribe today to unlock all pages.
Trusted by 1+ million students worldwide
Sainsbury's Tesco
0
0.01
0.02
0.03
0.04
0.05
0.06
0.07
0.08
6.19%
5.24%
6.23%
5.19%
6.61%
5.83%
7.00%
6.48%
Gross profit margin
2015-16
2016-17
2017-18
2018-19
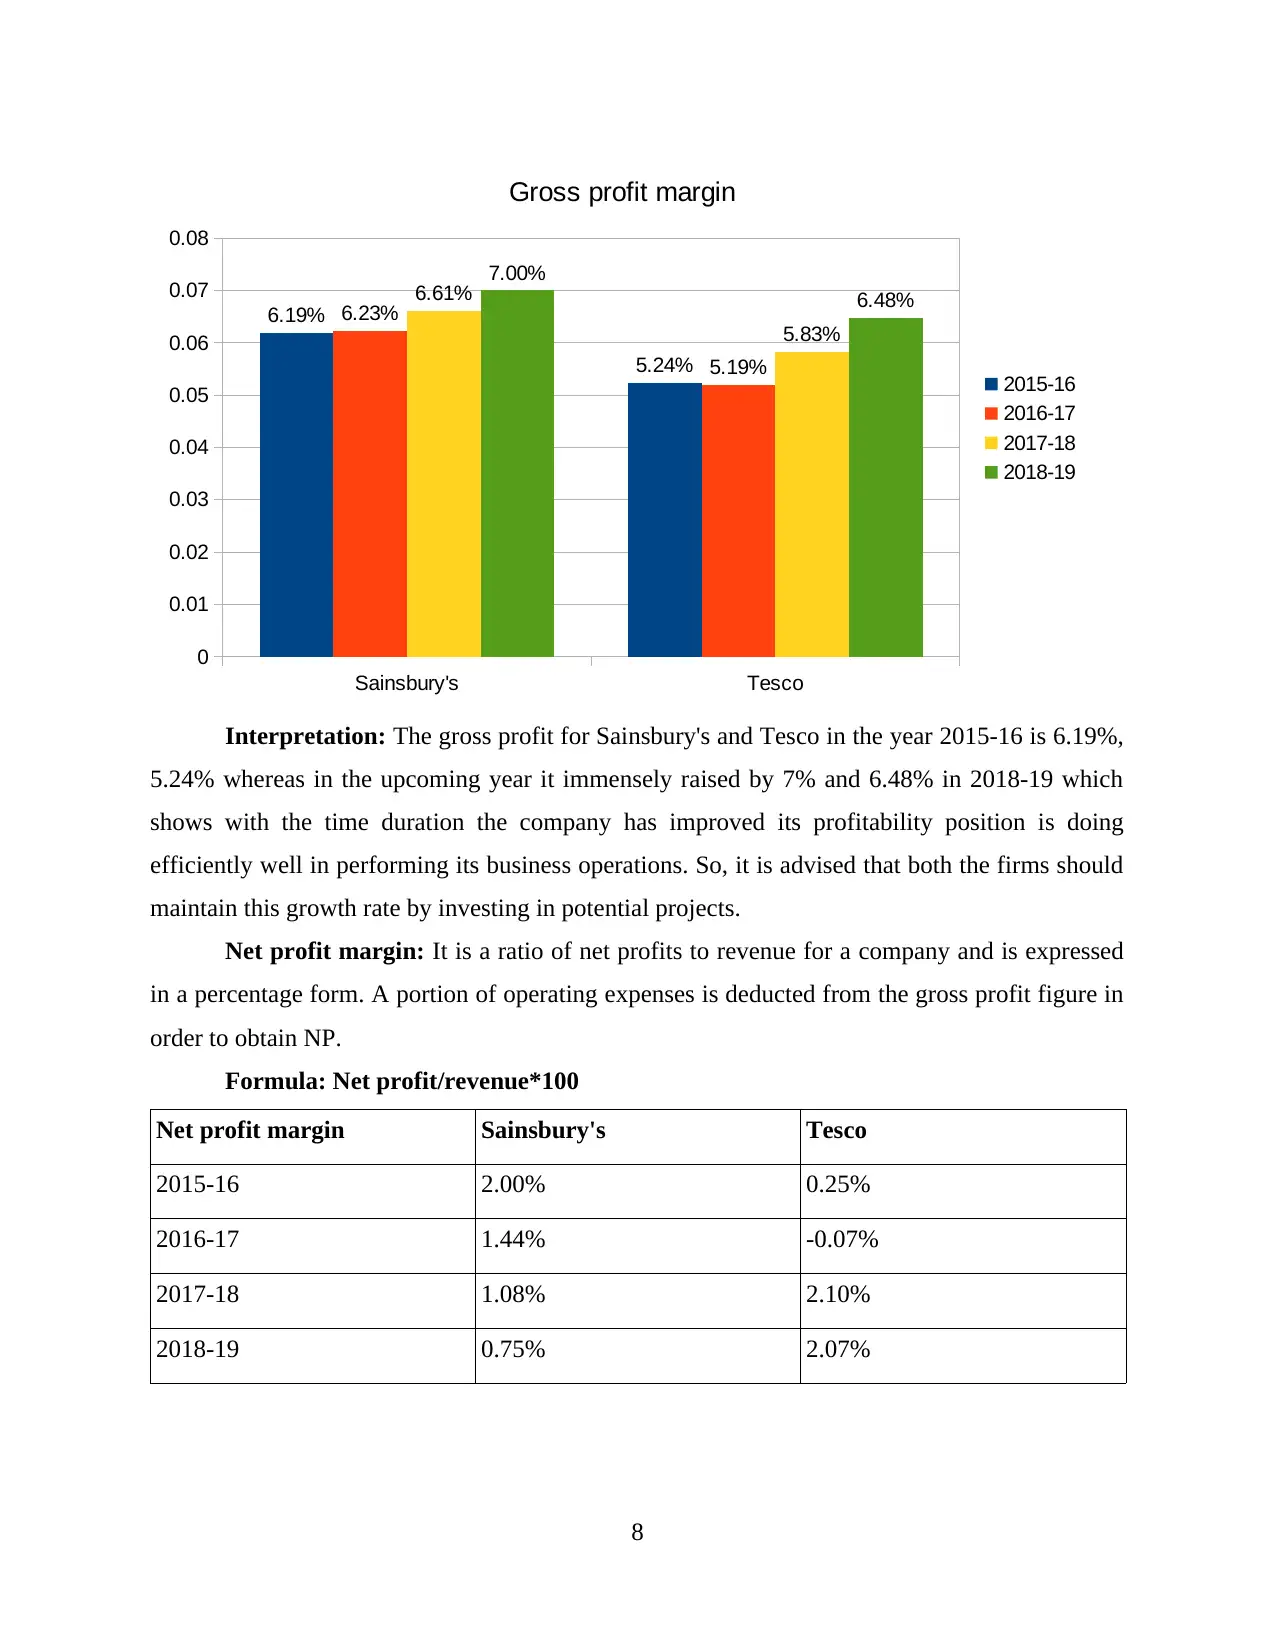
Interpretation: The gross profit for Sainsbury's and Tesco in the year 2015-16 is 6.19%,
5.24% whereas in the upcoming year it immensely raised by 7% and 6.48% in 2018-19 which
shows with the time duration the company has improved its profitability position is doing
efficiently well in performing its business operations. So, it is advised that both the firms should
maintain this growth rate by investing in potential projects.
Net profit margin: It is a ratio of net profits to revenue for a company and is expressed
in a percentage form. A portion of operating expenses is deducted from the gross profit figure in
order to obtain NP.
Formula: Net profit/revenue*100
Net profit margin Sainsbury's Tesco
2015-16 2.00% 0.25%
2016-17 1.44% -0.07%
2017-18 1.08% 2.10%
2018-19 0.75% 2.07%
8
0
0.01
0.02
0.03
0.04
0.05
0.06
0.07
0.08
6.19%
5.24%
6.23%
5.19%
6.61%
5.83%
7.00%
6.48%
Gross profit margin
2015-16
2016-17
2017-18
2018-19
Interpretation: The gross profit for Sainsbury's and Tesco in the year 2015-16 is 6.19%,
5.24% whereas in the upcoming year it immensely raised by 7% and 6.48% in 2018-19 which
shows with the time duration the company has improved its profitability position is doing
efficiently well in performing its business operations. So, it is advised that both the firms should
maintain this growth rate by investing in potential projects.
Net profit margin: It is a ratio of net profits to revenue for a company and is expressed
in a percentage form. A portion of operating expenses is deducted from the gross profit figure in
order to obtain NP.
Formula: Net profit/revenue*100
Net profit margin Sainsbury's Tesco
2015-16 2.00% 0.25%
2016-17 1.44% -0.07%
2017-18 1.08% 2.10%
2018-19 0.75% 2.07%
8
Paraphrase This Document
Need a fresh take? Get an instant paraphrase of this document with our AI Paraphraser
Sainsbury's Tesco
-0.005
0
0.005
0.01
0.015
0.02
0.025
2.00%
0.25%
1.44%
-0.07%
1.08%
2.10%
0.75%
2.07%
Net profit margin
2015-16
2016-17
2017-18
2018-19
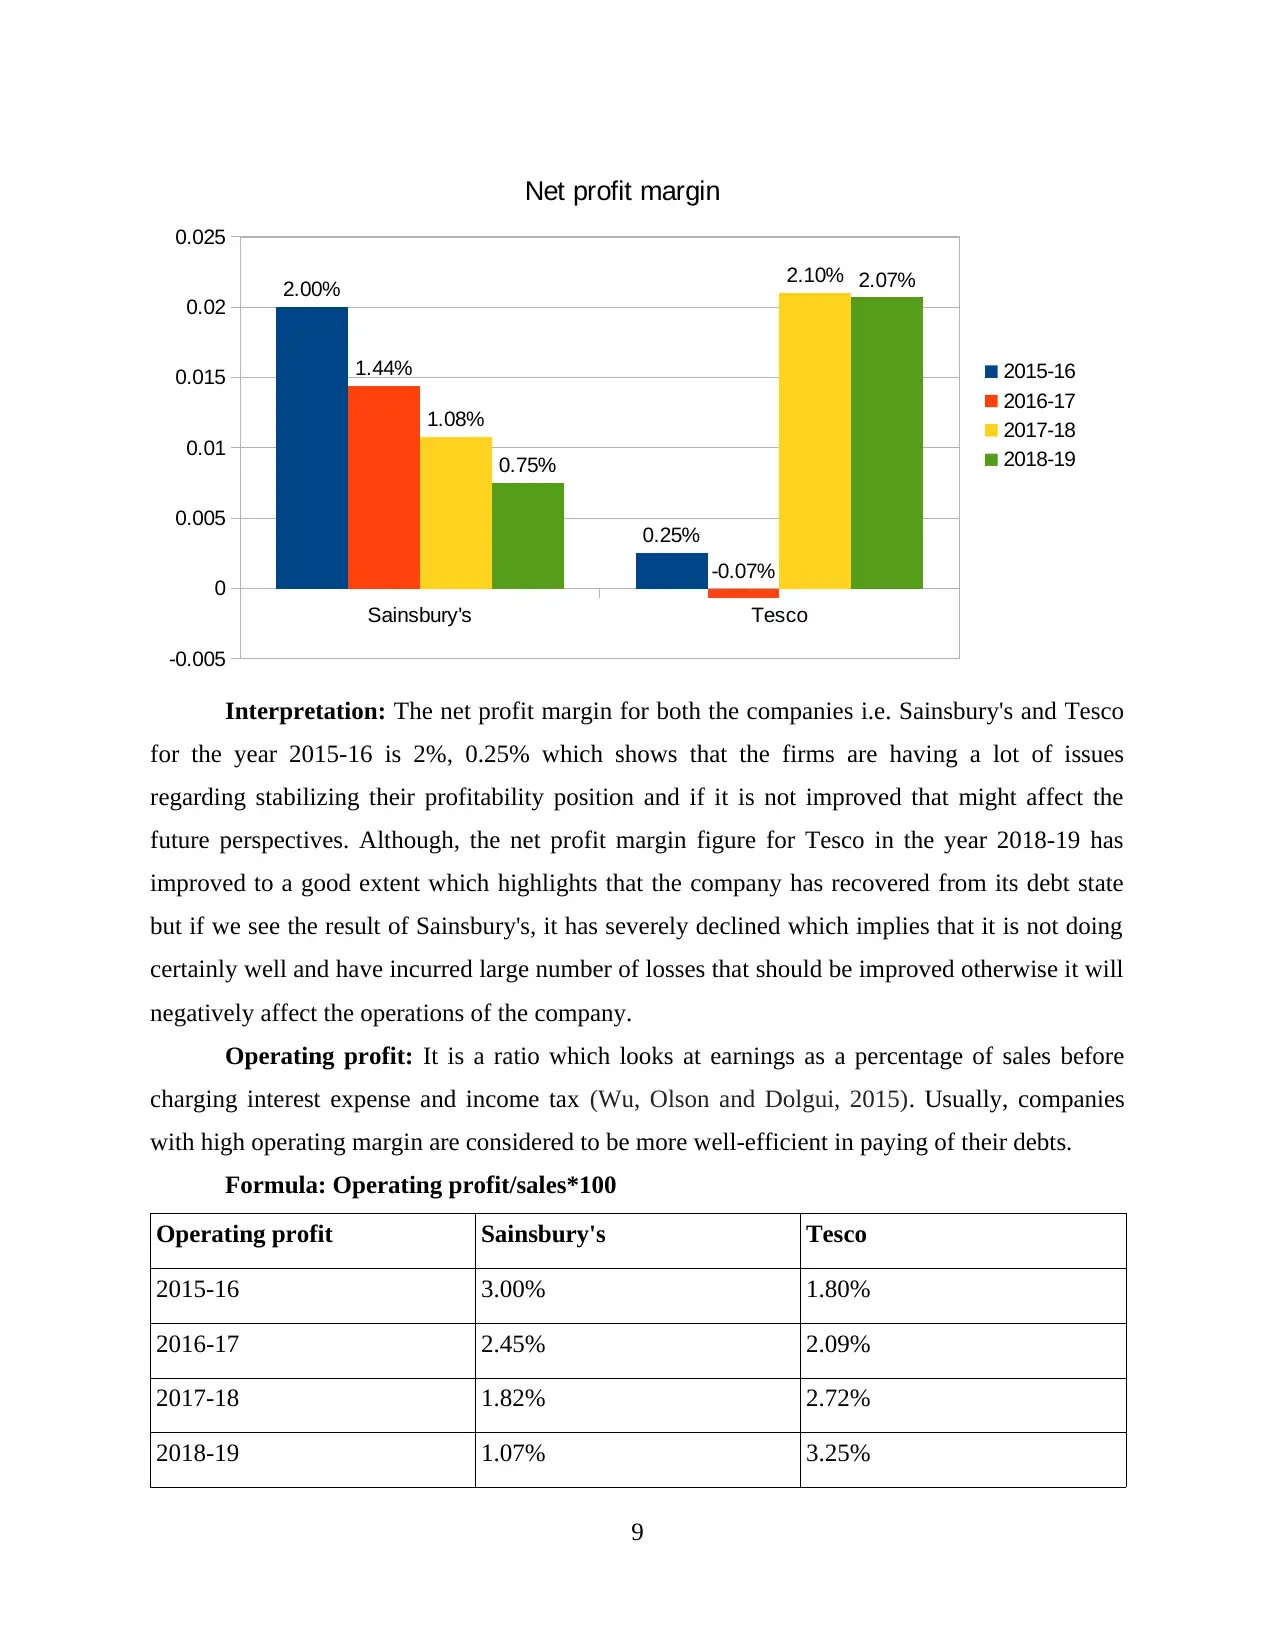
Interpretation: The net profit margin for both the companies i.e. Sainsbury's and Tesco
for the year 2015-16 is 2%, 0.25% which shows that the firms are having a lot of issues
regarding stabilizing their profitability position and if it is not improved that might affect the
future perspectives. Although, the net profit margin figure for Tesco in the year 2018-19 has
improved to a good extent which highlights that the company has recovered from its debt state
but if we see the result of Sainsbury's, it has severely declined which implies that it is not doing
certainly well and have incurred large number of losses that should be improved otherwise it will
negatively affect the operations of the company.
Operating profit: It is a ratio which looks at earnings as a percentage of sales before
charging interest expense and income tax (Wu, Olson and Dolgui, 2015). Usually, companies
with high operating margin are considered to be more well-efficient in paying of their debts.
Formula: Operating profit/sales*100
Operating profit Sainsbury's Tesco
2015-16 3.00% 1.80%
2016-17 2.45% 2.09%
2017-18 1.82% 2.72%
2018-19 1.07% 3.25%
9
-0.005
0
0.005
0.01
0.015
0.02
0.025
2.00%
0.25%
1.44%
-0.07%
1.08%
2.10%
0.75%
2.07%
Net profit margin
2015-16
2016-17
2017-18
2018-19
Interpretation: The net profit margin for both the companies i.e. Sainsbury's and Tesco
for the year 2015-16 is 2%, 0.25% which shows that the firms are having a lot of issues
regarding stabilizing their profitability position and if it is not improved that might affect the
future perspectives. Although, the net profit margin figure for Tesco in the year 2018-19 has
improved to a good extent which highlights that the company has recovered from its debt state
but if we see the result of Sainsbury's, it has severely declined which implies that it is not doing
certainly well and have incurred large number of losses that should be improved otherwise it will
negatively affect the operations of the company.
Operating profit: It is a ratio which looks at earnings as a percentage of sales before
charging interest expense and income tax (Wu, Olson and Dolgui, 2015). Usually, companies
with high operating margin are considered to be more well-efficient in paying of their debts.
Formula: Operating profit/sales*100
Operating profit Sainsbury's Tesco
2015-16 3.00% 1.80%
2016-17 2.45% 2.09%
2017-18 1.82% 2.72%
2018-19 1.07% 3.25%
9
Sainsbury's Tesco
0
0.005
0.01
0.015
0.02
0.025
0.03
0.035
3.00%
1.80%
2.45%
2.09%
1.82%
2.72%
1.07%
3.25%
Operating profit margin
2015-16
2016-17
2017-18
2018-19
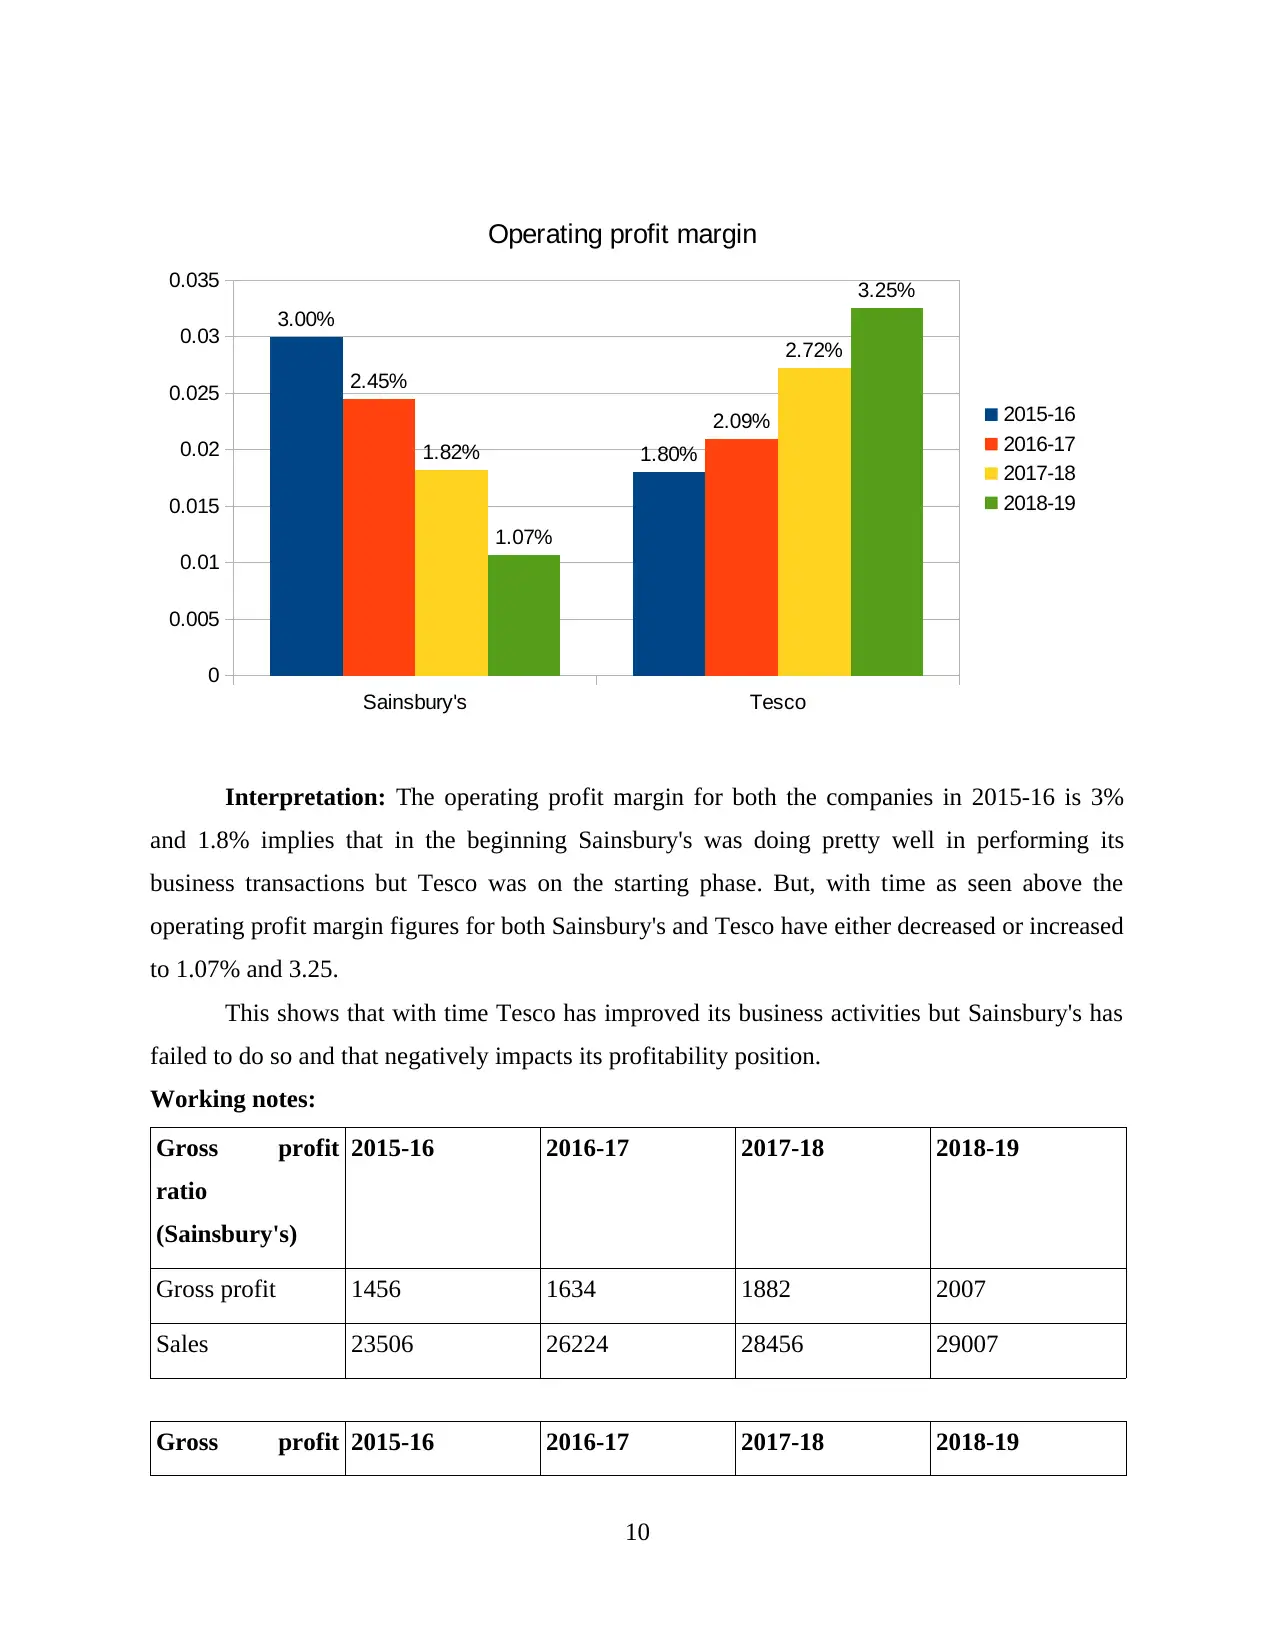
Interpretation: The operating profit margin for both the companies in 2015-16 is 3%
and 1.8% implies that in the beginning Sainsbury's was doing pretty well in performing its
business transactions but Tesco was on the starting phase. But, with time as seen above the
operating profit margin figures for both Sainsbury's and Tesco have either decreased or increased
to 1.07% and 3.25.
This shows that with time Tesco has improved its business activities but Sainsbury's has
failed to do so and that negatively impacts its profitability position.
Working notes:
Gross profit
ratio
(Sainsbury's)
2015-16 2016-17 2017-18 2018-19
Gross profit 1456 1634 1882 2007
Sales 23506 26224 28456 29007
Gross profit 2015-16 2016-17 2017-18 2018-19
10
0
0.005
0.01
0.015
0.02
0.025
0.03
0.035
3.00%
1.80%
2.45%
2.09%
1.82%
2.72%
1.07%
3.25%
Operating profit margin
2015-16
2016-17
2017-18
2018-19
Interpretation: The operating profit margin for both the companies in 2015-16 is 3%
and 1.8% implies that in the beginning Sainsbury's was doing pretty well in performing its
business transactions but Tesco was on the starting phase. But, with time as seen above the
operating profit margin figures for both Sainsbury's and Tesco have either decreased or increased
to 1.07% and 3.25.
This shows that with time Tesco has improved its business activities but Sainsbury's has
failed to do so and that negatively impacts its profitability position.
Working notes:
Gross profit
ratio
(Sainsbury's)
2015-16 2016-17 2017-18 2018-19
Gross profit 1456 1634 1882 2007
Sales 23506 26224 28456 29007
Gross profit 2015-16 2016-17 2017-18 2018-19
10
⊘ This is a preview!⊘
Do you want full access?
Subscribe today to unlock all pages.
Trusted by 1+ million students worldwide
1 out of 23
Related Documents


Your All-in-One AI-Powered Toolkit for Academic Success.
+13062052269
info@desklib.com
Available 24*7 on WhatsApp / Email
![[object Object]](/_next/static/media/star-bottom.7253800d.svg)
Unlock your academic potential
Copyright © 2020–2026 A2Z Services. All Rights Reserved. Developed and managed by ZUCOL.