Financial Analysis Management & Enterprise (FAME) Report on Airlines
VerifiedAdded on 2020/07/23
|17
|3802
|326
Report
AI Summary
This report presents a comprehensive financial analysis of three major airlines: Turkish Airlines, Lufthansa, and Emirates. The analysis focuses on the financial performance of Turkish Airlines and Lufthansa over a four-year period (2013-2016), utilizing ratio analysis to assess profitability, liquidity, efficiency, and solvency. The report examines key financial ratios such as net profit ratio, current ratio, debt-equity ratio, and inventory turnover ratio to evaluate each airline's performance and identify trends. Additionally, the report includes an analysis of Emirates' cash flow statement over a five-year period. The findings highlight the strengths and weaknesses of each airline, providing insights into their financial health and operational efficiency. The report concludes with recommendations for improving operational performance based on the financial analysis.

Financial Analysis
Management & Enterprise
- FAME
Management & Enterprise
- FAME
Paraphrase This Document
Need a fresh take? Get an instant paraphrase of this document with our AI Paraphraser
TABLE OF CONTENTS
INTRODUCTION...........................................................................................................................3
A The financial performance Turkish Airlines & Lufthansa for last four years..............3
B Analysing the cash flow statement of Emirates for five years of analysis.......................13
CONCLUSION..............................................................................................................................16
REFERENCES..............................................................................................................................17
INTRODUCTION
To identify the requirements of the firm the role of a financial analyst in determining the
current state of the business which is need to be improved and managed by strategic changes in
the operations. In the present report there have been analysis over the financial health of the three
aviation industries. The study over profitability, liquidity, efficiency over the Turkish airlines
and Lufthansa Airlines While the cash statement of Emirates will be analysed. Moreover, the
report will be useful in presenting the appropriate suggestion to have the increment in the
operational performance of entity.
A The financial performance Turkish Airlines & Lufthansa for last four years.
RATIO ANALYSIS:
Analysing of information contained in the financial statements of two identical
companies in percentage form is known as ratio analysis. Ratio analysis is used to evaluate a
company's performance based on profitability, solvency, inventory management, liquidity and
efficiency. Many investors before investing in a company evaluate its performance in contrast to
its competitors using various ratio analysis techniques. Current ratio, debt-equity ratio, ROI and
ROE are the ratios calculated by investors before investing their money in an organisation.
The financial performance of Turkish Airlines & Lufthansa over the last four years has
been calculated and various contrasting evaluation based on analysis of ratio is undertaken
(Gordon and et.al., 2017).
Profitability ratios:
⊘ This is a preview!⊘
Do you want full access?
Subscribe today to unlock all pages.
Trusted by 1+ million students worldwide
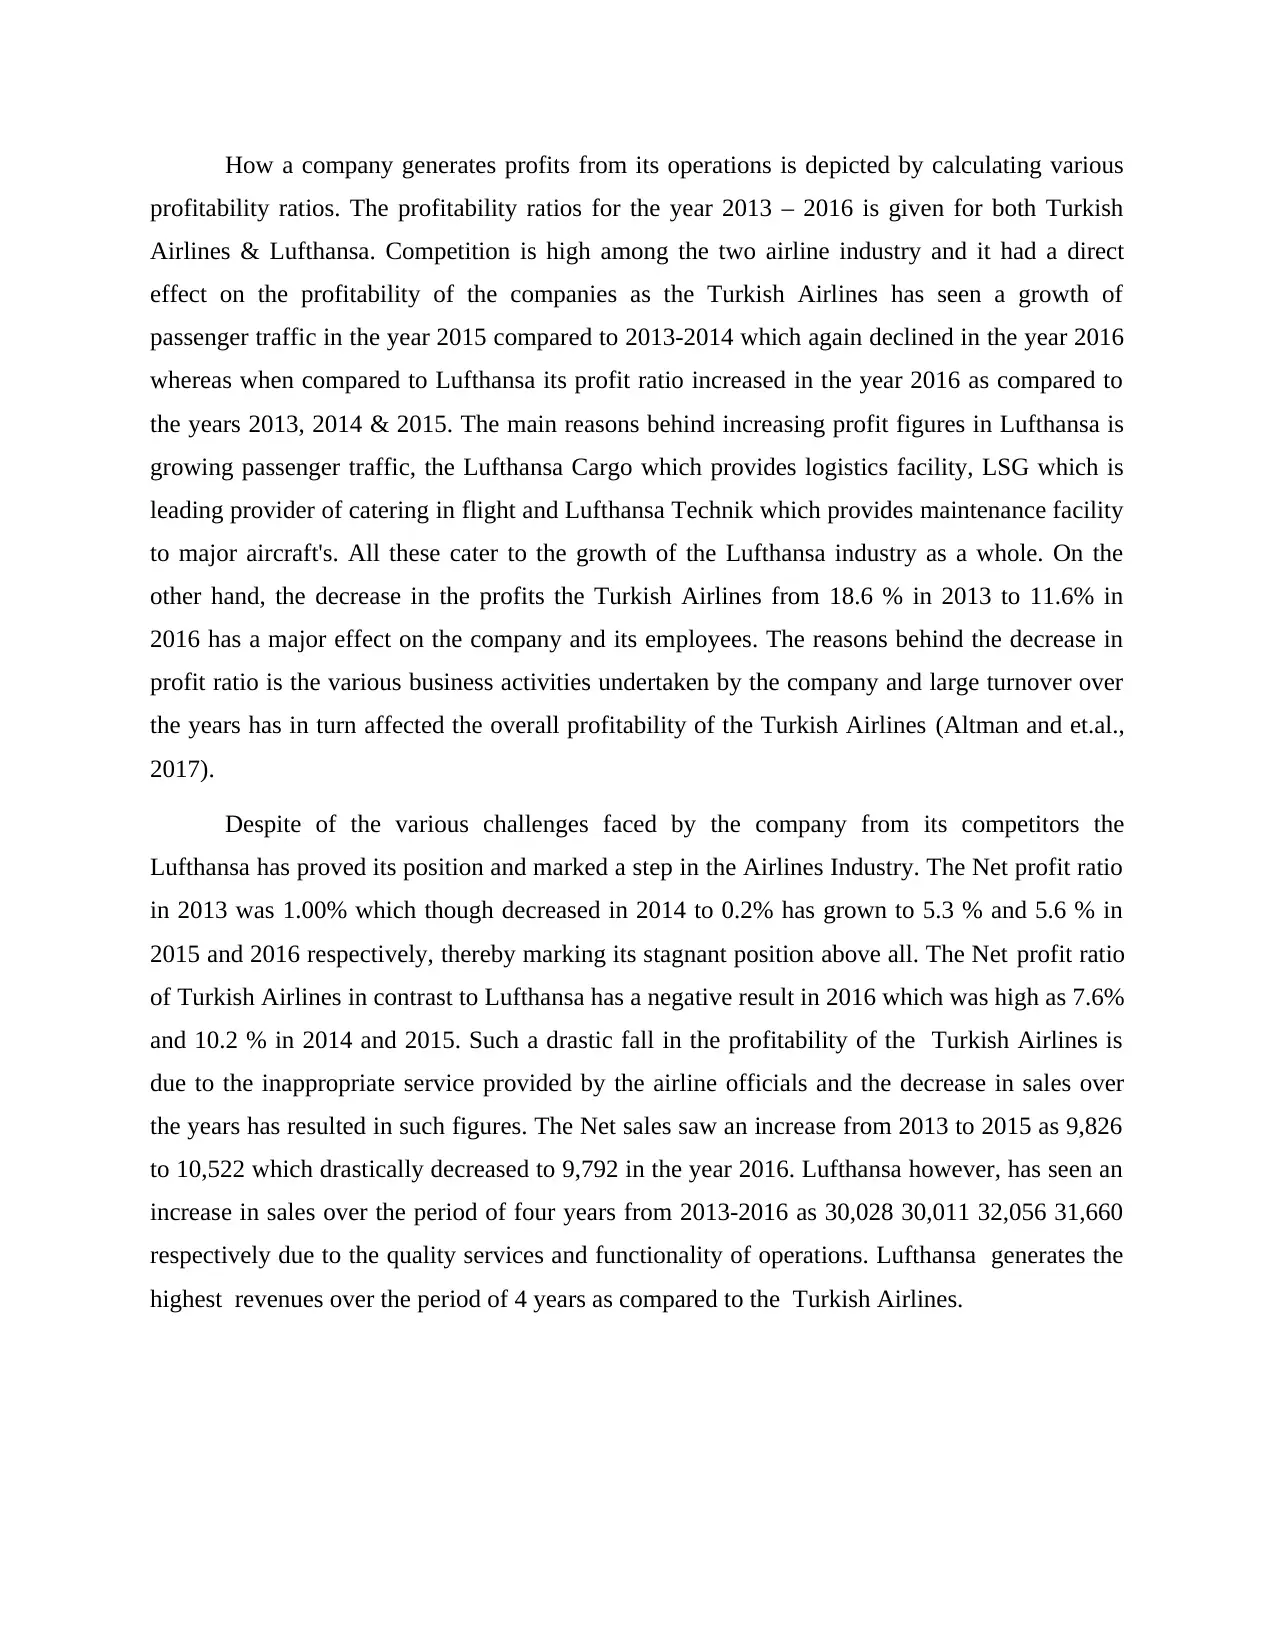
How a company generates profits from its operations is depicted by calculating various
profitability ratios. The profitability ratios for the year 2013 – 2016 is given for both Turkish
Airlines & Lufthansa. Competition is high among the two airline industry and it had a direct
effect on the profitability of the companies as the Turkish Airlines has seen a growth of
passenger traffic in the year 2015 compared to 2013-2014 which again declined in the year 2016
whereas when compared to Lufthansa its profit ratio increased in the year 2016 as compared to
the years 2013, 2014 & 2015. The main reasons behind increasing profit figures in Lufthansa is
growing passenger traffic, the Lufthansa Cargo which provides logistics facility, LSG which is
leading provider of catering in flight and Lufthansa Technik which provides maintenance facility
to major aircraft's. All these cater to the growth of the Lufthansa industry as a whole. On the
other hand, the decrease in the profits the Turkish Airlines from 18.6 % in 2013 to 11.6% in
2016 has a major effect on the company and its employees. The reasons behind the decrease in
profit ratio is the various business activities undertaken by the company and large turnover over
the years has in turn affected the overall profitability of the Turkish Airlines (Altman and et.al.,
2017).
Despite of the various challenges faced by the company from its competitors the
Lufthansa has proved its position and marked a step in the Airlines Industry. The Net profit ratio
in 2013 was 1.00% which though decreased in 2014 to 0.2% has grown to 5.3 % and 5.6 % in
2015 and 2016 respectively, thereby marking its stagnant position above all. The Net profit ratio
of Turkish Airlines in contrast to Lufthansa has a negative result in 2016 which was high as 7.6%
and 10.2 % in 2014 and 2015. Such a drastic fall in the profitability of the Turkish Airlines is
due to the inappropriate service provided by the airline officials and the decrease in sales over
the years has resulted in such figures. The Net sales saw an increase from 2013 to 2015 as 9,826
to 10,522 which drastically decreased to 9,792 in the year 2016. Lufthansa however, has seen an
increase in sales over the period of four years from 2013-2016 as 30,028 30,011 32,056 31,660
respectively due to the quality services and functionality of operations. Lufthansa generates the
highest revenues over the period of 4 years as compared to the Turkish Airlines.
Paraphrase This Document
Need a fresh take? Get an instant paraphrase of this document with our AI Paraphraser
Liquidity ratio analysis:
2013 2014 2015 2016
0
0.05
0.1
0.15
0.2
0.25
0.3
0.35
0.4
0.45
0.5
0.186 0.181 0.2
0.116
41.69% 42.41% 44.97% 45.96%
Gross margin
Turkish Airlines
Lufthansa
2013 2014 2015 2016
-0.02
0
0.02
0.04
0.06
0.08
0.1
0.12
3.60%
7.60%
10.20%
-0.80%
1.00%
0.20%
5.30% 5.60%
Net Margin
Turkish Airlines
Lufthansa
2013 2014 2015 2016
0
0.05
0.1
0.15
0.2
0.25
0.3
0.35
0.4
0.45
0.5
0.186 0.181 0.2
0.116
41.69% 42.41% 44.97% 45.96%
Gross margin
Turkish Airlines
Lufthansa
2013 2014 2015 2016
-0.02
0
0.02
0.04
0.06
0.08
0.1
0.12
3.60%
7.60%
10.20%
-0.80%
1.00%
0.20%
5.30% 5.60%
Net Margin
Turkish Airlines
Lufthansa
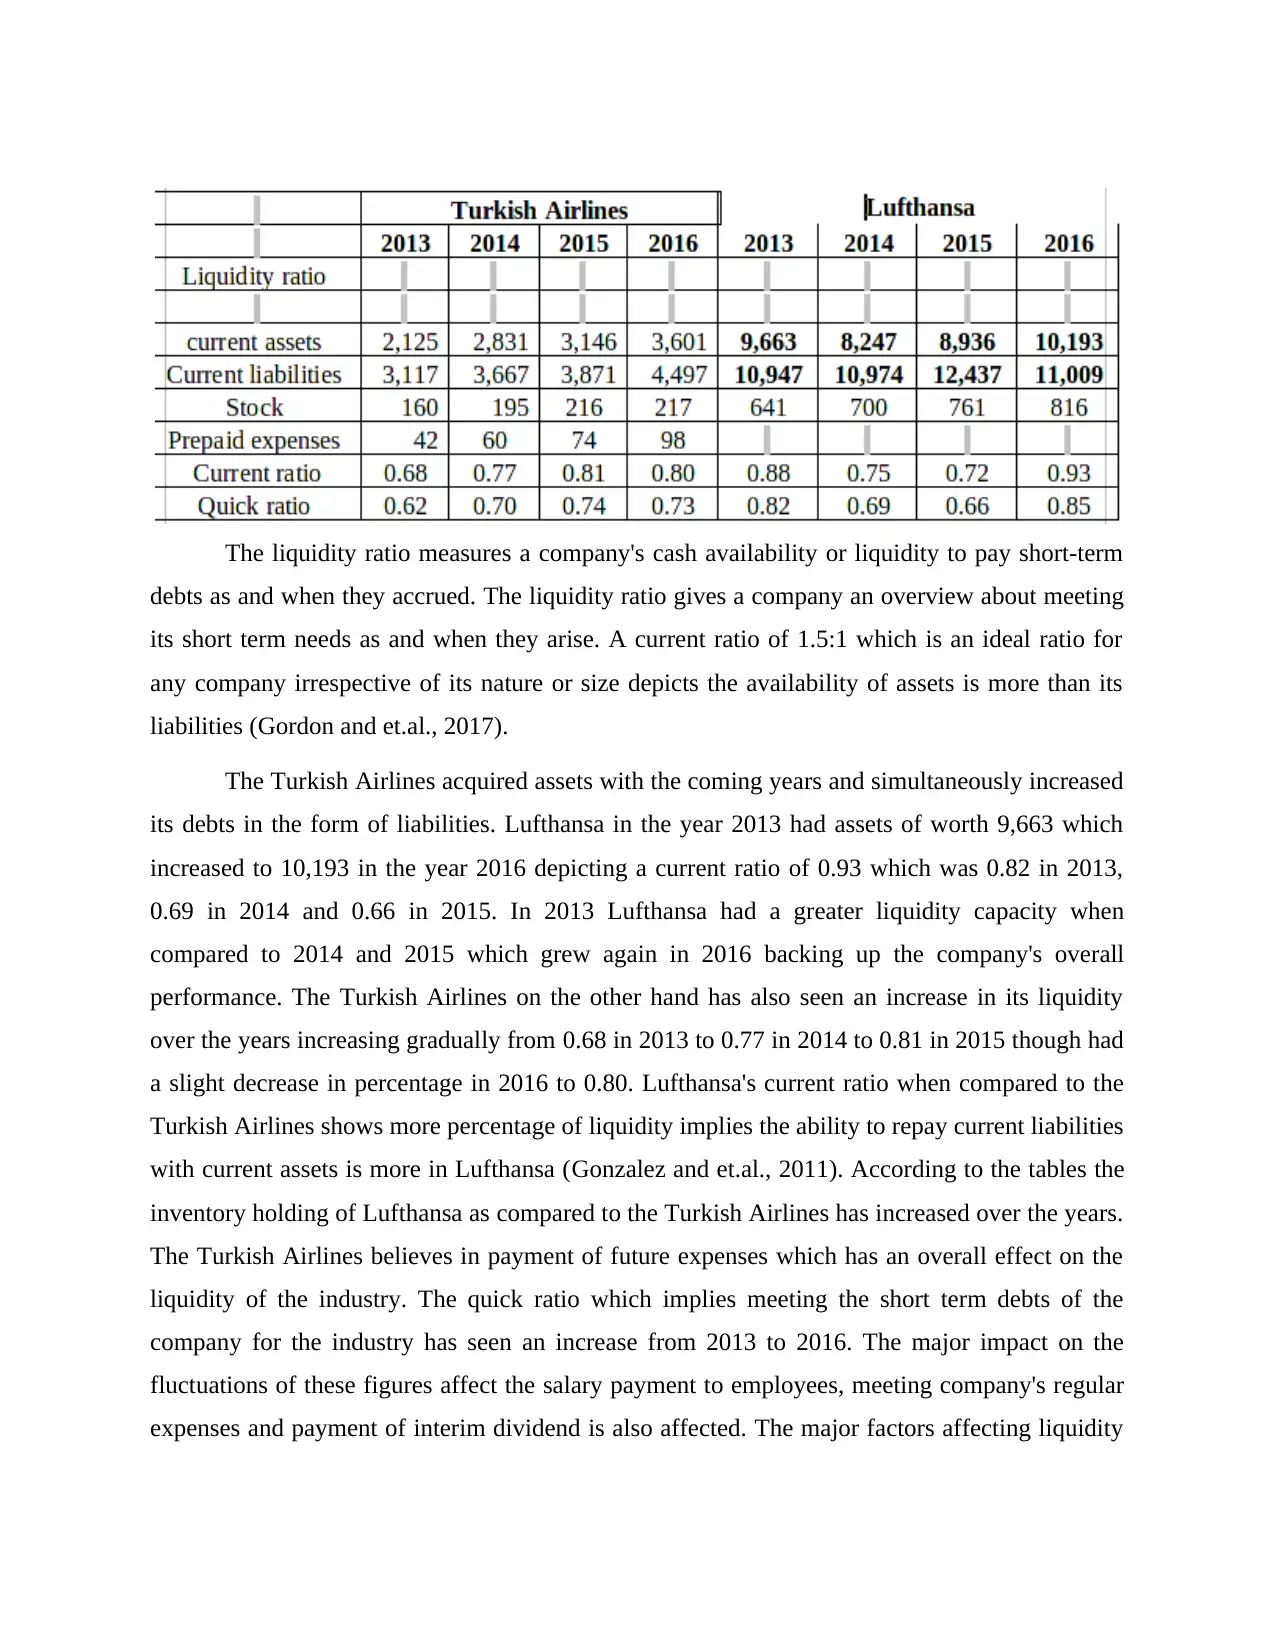
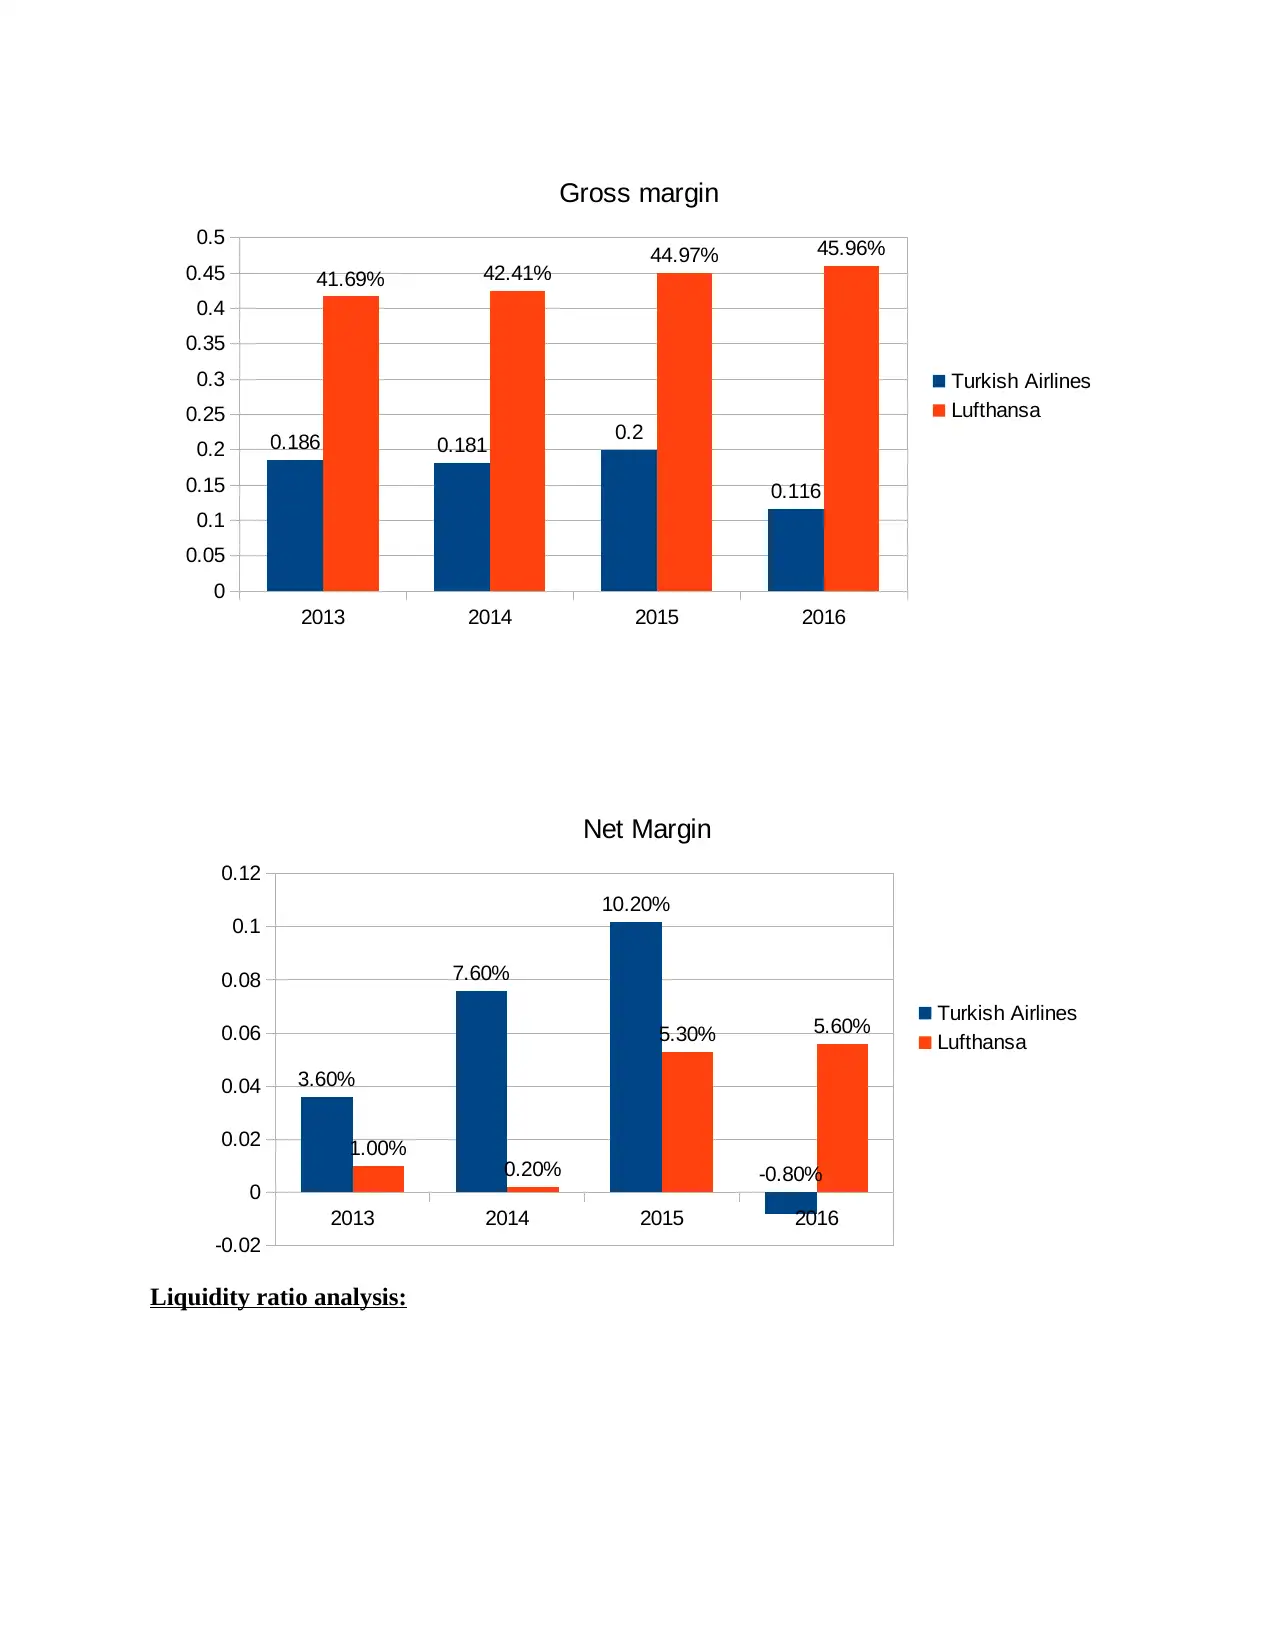
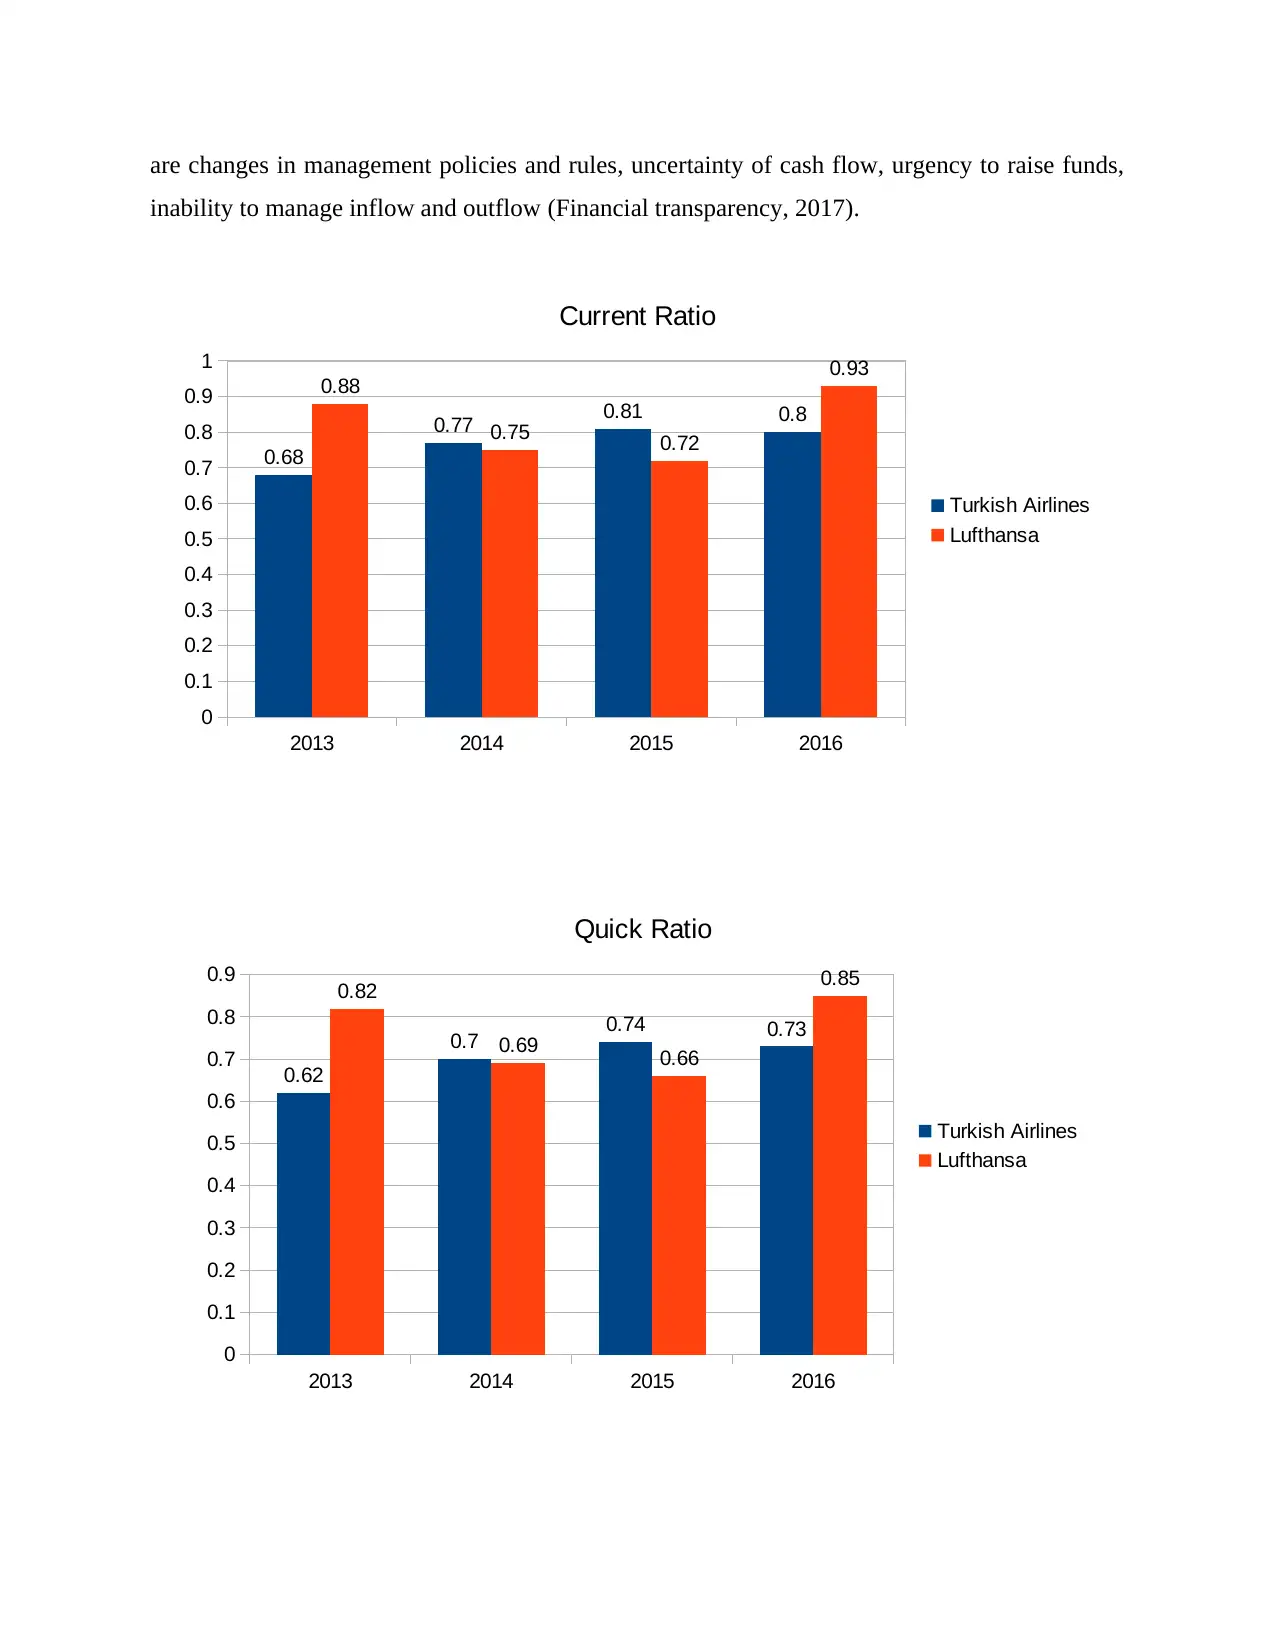
The liquidity ratio measures a company's cash availability or liquidity to pay short-term
debts as and when they accrued. The liquidity ratio gives a company an overview about meeting
its short term needs as and when they arise. A current ratio of 1.5:1 which is an ideal ratio for
any company irrespective of its nature or size depicts the availability of assets is more than its
liabilities (Gordon and et.al., 2017).
The Turkish Airlines acquired assets with the coming years and simultaneously increased
its debts in the form of liabilities. Lufthansa in the year 2013 had assets of worth 9,663 which
increased to 10,193 in the year 2016 depicting a current ratio of 0.93 which was 0.82 in 2013,
0.69 in 2014 and 0.66 in 2015. In 2013 Lufthansa had a greater liquidity capacity when
compared to 2014 and 2015 which grew again in 2016 backing up the company's overall
performance. The Turkish Airlines on the other hand has also seen an increase in its liquidity
over the years increasing gradually from 0.68 in 2013 to 0.77 in 2014 to 0.81 in 2015 though had
a slight decrease in percentage in 2016 to 0.80. Lufthansa's current ratio when compared to the
Turkish Airlines shows more percentage of liquidity implies the ability to repay current liabilities
with current assets is more in Lufthansa (Gonzalez and et.al., 2011). According to the tables the
inventory holding of Lufthansa as compared to the Turkish Airlines has increased over the years.
The Turkish Airlines believes in payment of future expenses which has an overall effect on the
liquidity of the industry. The quick ratio which implies meeting the short term debts of the
company for the industry has seen an increase from 2013 to 2016. The major impact on the
fluctuations of these figures affect the salary payment to employees, meeting company's regular
expenses and payment of interim dividend is also affected. The major factors affecting liquidity
⊘ This is a preview!⊘
Do you want full access?
Subscribe today to unlock all pages.
Trusted by 1+ million students worldwide
are changes in management policies and rules, uncertainty of cash flow, urgency to raise funds,
inability to manage inflow and outflow (Financial transparency, 2017).
2013 2014 2015 2016
0
0.1
0.2
0.3
0.4
0.5
0.6
0.7
0.8
0.9
1
0.68
0.77 0.81 0.8
0.88
0.75 0.72
0.93
Current Ratio
Turkish Airlines
Lufthansa
2013 2014 2015 2016
0
0.1
0.2
0.3
0.4
0.5
0.6
0.7
0.8
0.9
0.62
0.7 0.74 0.73
0.82
0.69 0.66
0.85
Quick Ratio
Turkish Airlines
Lufthansa
Paraphrase This Document
Need a fresh take? Get an instant paraphrase of this document with our AI Paraphraser
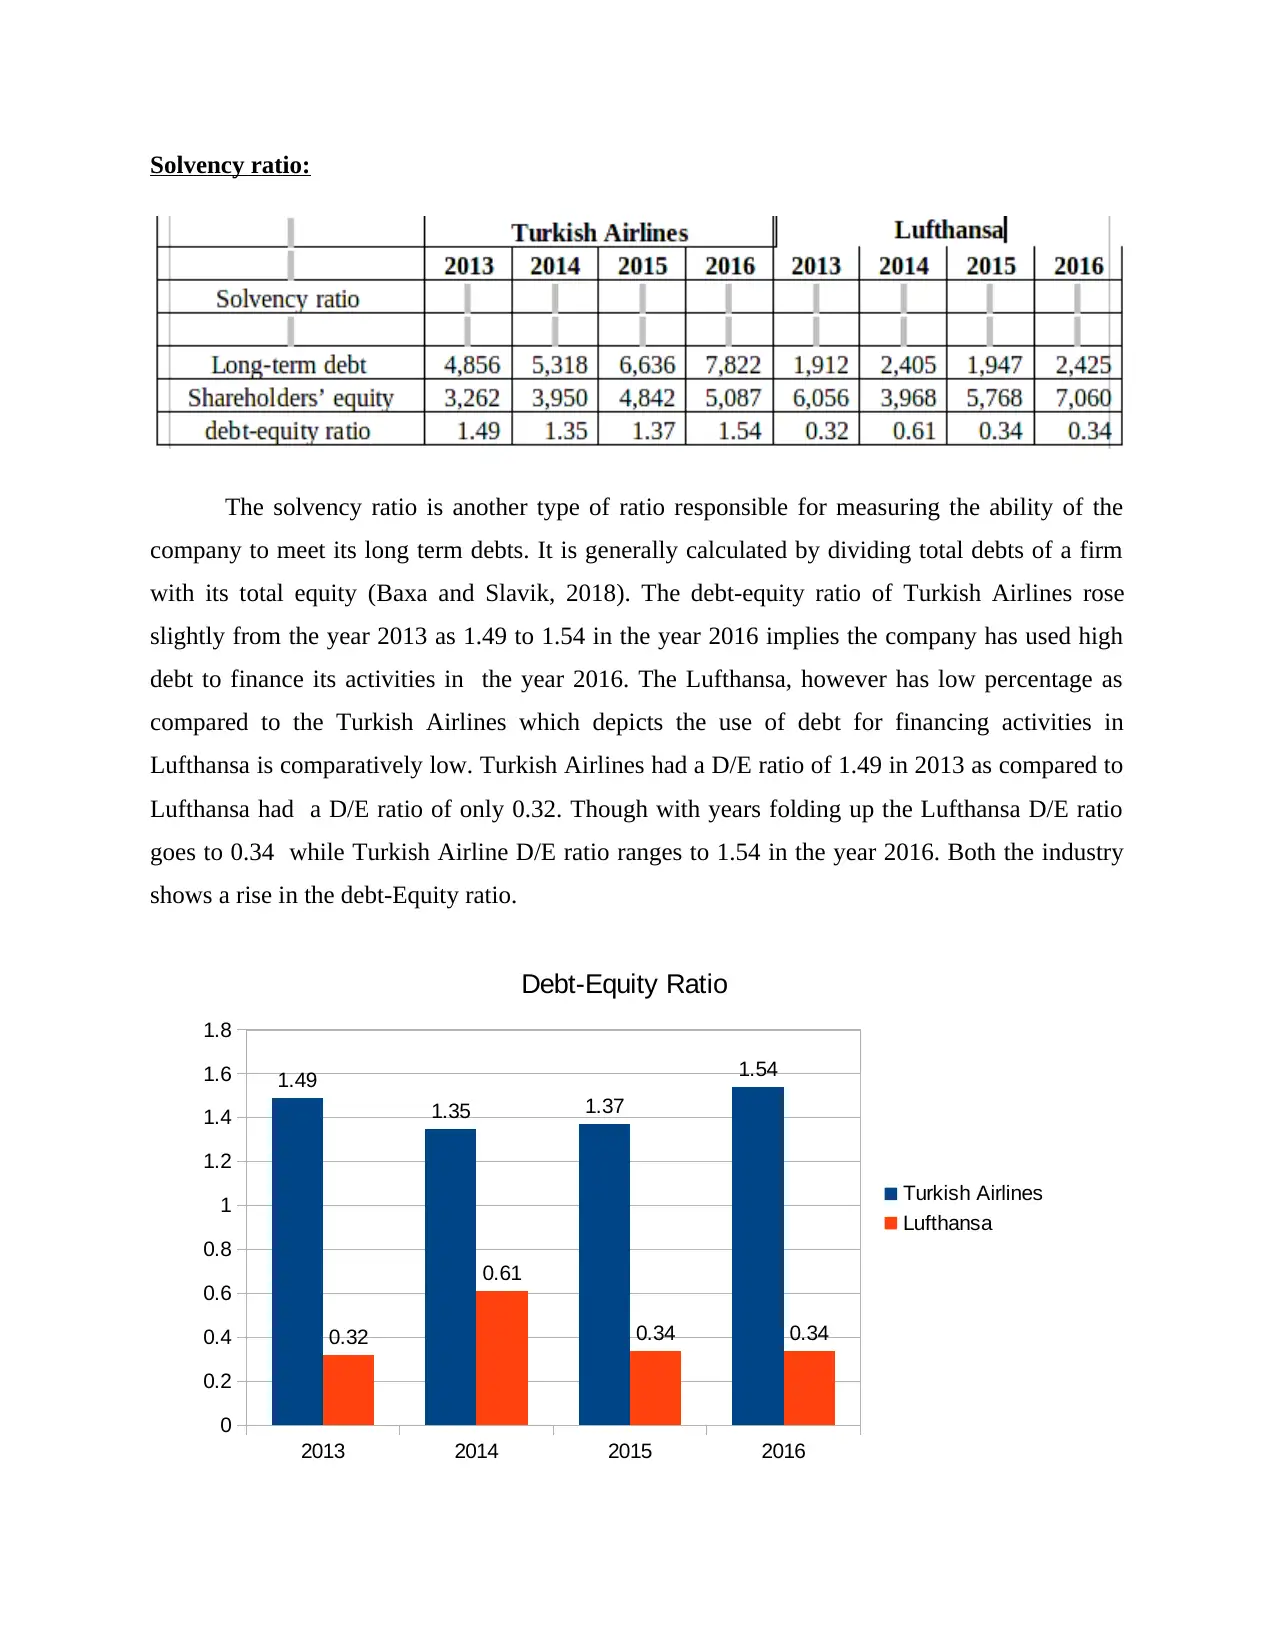
Solvency ratio:
The solvency ratio is another type of ratio responsible for measuring the ability of the
company to meet its long term debts. It is generally calculated by dividing total debts of a firm
with its total equity (Baxa and Slavik, 2018). The debt-equity ratio of Turkish Airlines rose
slightly from the year 2013 as 1.49 to 1.54 in the year 2016 implies the company has used high
debt to finance its activities in the year 2016. The Lufthansa, however has low percentage as
compared to the Turkish Airlines which depicts the use of debt for financing activities in
Lufthansa is comparatively low. Turkish Airlines had a D/E ratio of 1.49 in 2013 as compared to
Lufthansa had a D/E ratio of only 0.32. Though with years folding up the Lufthansa D/E ratio
goes to 0.34 while Turkish Airline D/E ratio ranges to 1.54 in the year 2016. Both the industry
shows a rise in the debt-Equity ratio.
2013 2014 2015 2016
0
0.2
0.4
0.6
0.8
1
1.2
1.4
1.6
1.8
1.49
1.35 1.37
1.54
0.32
0.61
0.34 0.34
Debt-Equity Ratio
Turkish Airlines
Lufthansa
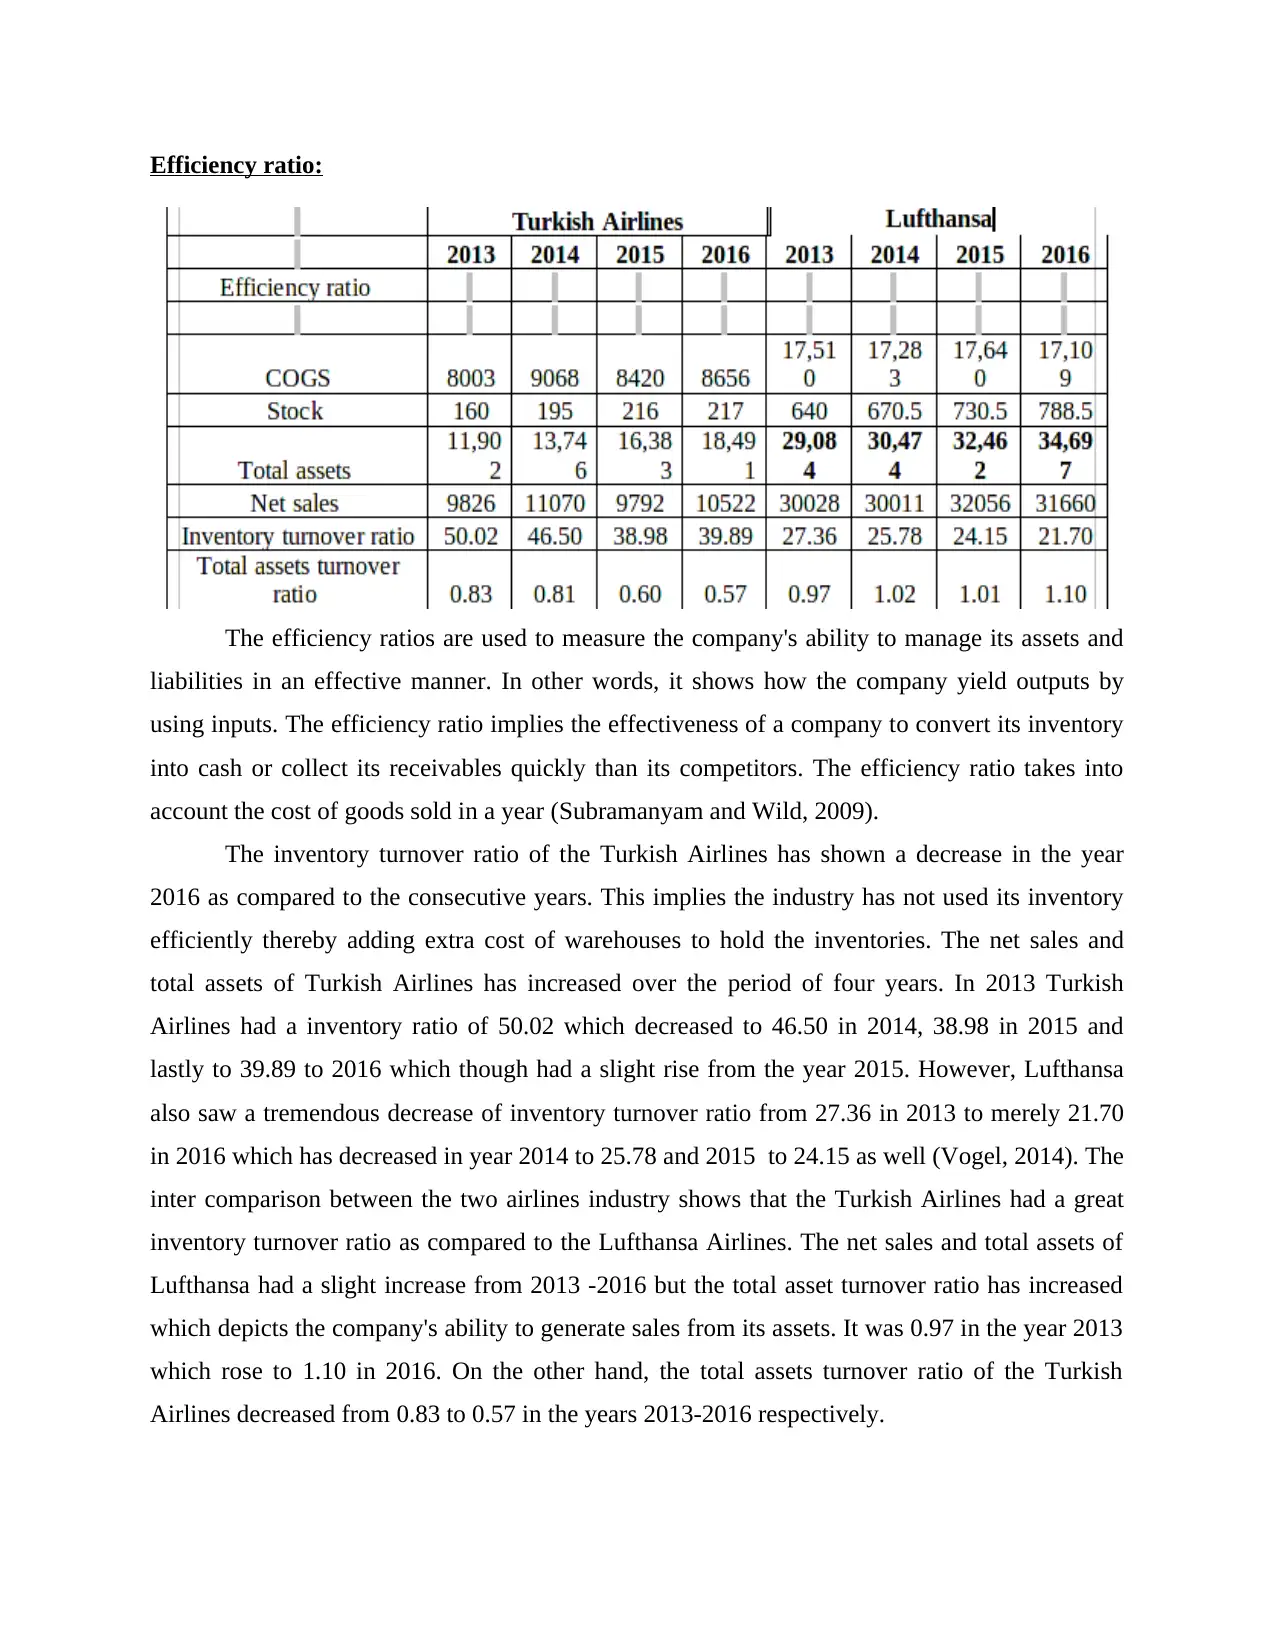
Efficiency ratio:
The efficiency ratios are used to measure the company's ability to manage its assets and
liabilities in an effective manner. In other words, it shows how the company yield outputs by
using inputs. The efficiency ratio implies the effectiveness of a company to convert its inventory
into cash or collect its receivables quickly than its competitors. The efficiency ratio takes into
account the cost of goods sold in a year (Subramanyam and Wild, 2009).
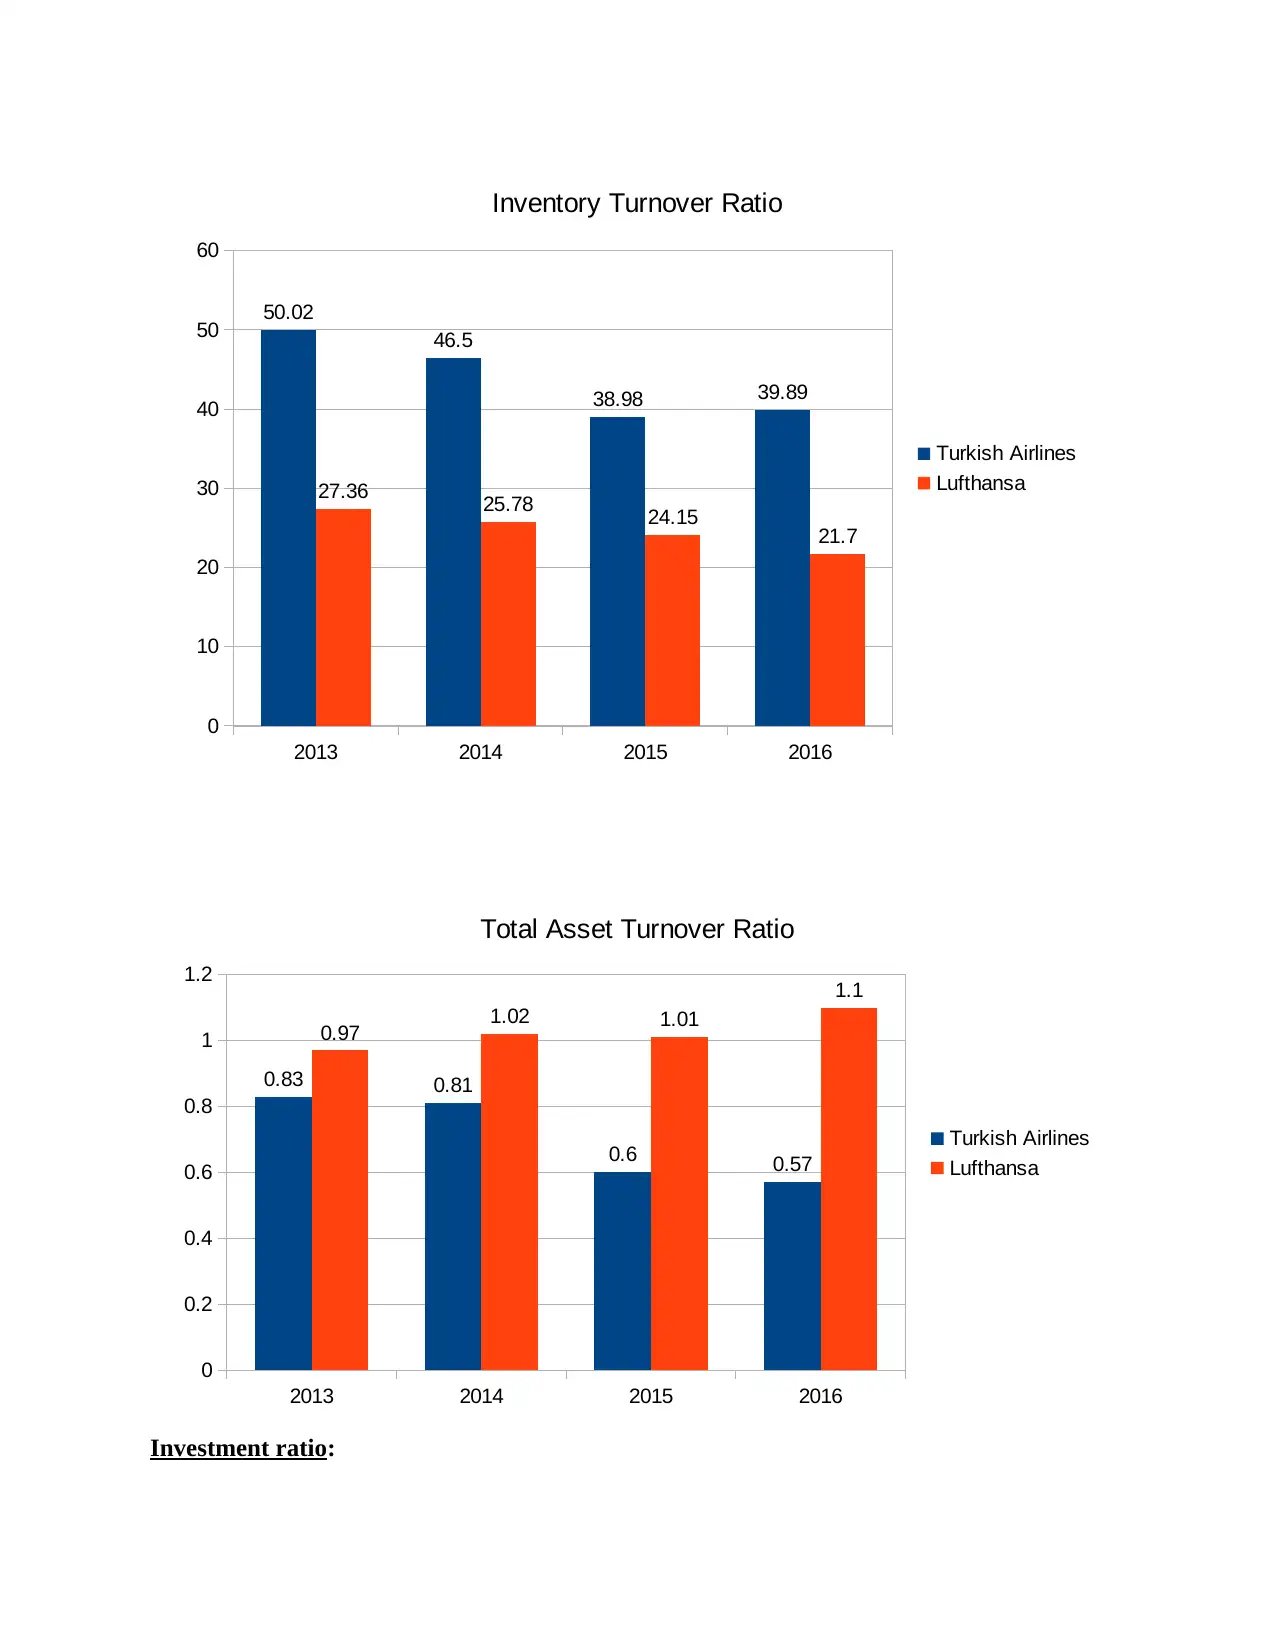
The inventory turnover ratio of the Turkish Airlines has shown a decrease in the year
2016 as compared to the consecutive years. This implies the industry has not used its inventory
efficiently thereby adding extra cost of warehouses to hold the inventories. The net sales and
total assets of Turkish Airlines has increased over the period of four years. In 2013 Turkish
Airlines had a inventory ratio of 50.02 which decreased to 46.50 in 2014, 38.98 in 2015 and
lastly to 39.89 to 2016 which though had a slight rise from the year 2015. However, Lufthansa
also saw a tremendous decrease of inventory turnover ratio from 27.36 in 2013 to merely 21.70
in 2016 which has decreased in year 2014 to 25.78 and 2015 to 24.15 as well (Vogel, 2014). The
inter comparison between the two airlines industry shows that the Turkish Airlines had a great
inventory turnover ratio as compared to the Lufthansa Airlines. The net sales and total assets of
Lufthansa had a slight increase from 2013 -2016 but the total asset turnover ratio has increased
which depicts the company's ability to generate sales from its assets. It was 0.97 in the year 2013
which rose to 1.10 in 2016. On the other hand, the total assets turnover ratio of the Turkish
Airlines decreased from 0.83 to 0.57 in the years 2013-2016 respectively.
The efficiency ratios are used to measure the company's ability to manage its assets and
liabilities in an effective manner. In other words, it shows how the company yield outputs by
using inputs. The efficiency ratio implies the effectiveness of a company to convert its inventory
into cash or collect its receivables quickly than its competitors. The efficiency ratio takes into
account the cost of goods sold in a year (Subramanyam and Wild, 2009).
The inventory turnover ratio of the Turkish Airlines has shown a decrease in the year
2016 as compared to the consecutive years. This implies the industry has not used its inventory
efficiently thereby adding extra cost of warehouses to hold the inventories. The net sales and
total assets of Turkish Airlines has increased over the period of four years. In 2013 Turkish
Airlines had a inventory ratio of 50.02 which decreased to 46.50 in 2014, 38.98 in 2015 and
lastly to 39.89 to 2016 which though had a slight rise from the year 2015. However, Lufthansa
also saw a tremendous decrease of inventory turnover ratio from 27.36 in 2013 to merely 21.70
in 2016 which has decreased in year 2014 to 25.78 and 2015 to 24.15 as well (Vogel, 2014). The
inter comparison between the two airlines industry shows that the Turkish Airlines had a great
inventory turnover ratio as compared to the Lufthansa Airlines. The net sales and total assets of
Lufthansa had a slight increase from 2013 -2016 but the total asset turnover ratio has increased
which depicts the company's ability to generate sales from its assets. It was 0.97 in the year 2013
which rose to 1.10 in 2016. On the other hand, the total assets turnover ratio of the Turkish
Airlines decreased from 0.83 to 0.57 in the years 2013-2016 respectively.
⊘ This is a preview!⊘
Do you want full access?
Subscribe today to unlock all pages.
Trusted by 1+ million students worldwide
Investment ratio:
2013 2014 2015 2016
0
10
20
30
40
50
60
50.02
46.5
38.98 39.89
27.36 25.78 24.15 21.7
Inventory Turnover Ratio
Turkish Airlines
Lufthansa
2013 2014 2015 2016
0
0.2
0.4
0.6
0.8
1
1.2
0.83 0.81
0.6 0.57
0.97 1.02 1.01
1.1
Total Asset Turnover Ratio
Turkish Airlines
Lufthansa
2013 2014 2015 2016
0
10
20
30
40
50
60
50.02
46.5
38.98 39.89
27.36 25.78 24.15 21.7
Inventory Turnover Ratio
Turkish Airlines
Lufthansa
2013 2014 2015 2016
0
0.2
0.4
0.6
0.8
1
1.2
0.83 0.81
0.6 0.57
0.97 1.02 1.01
1.1
Total Asset Turnover Ratio
Turkish Airlines
Lufthansa
Paraphrase This Document
Need a fresh take? Get an instant paraphrase of this document with our AI Paraphraser
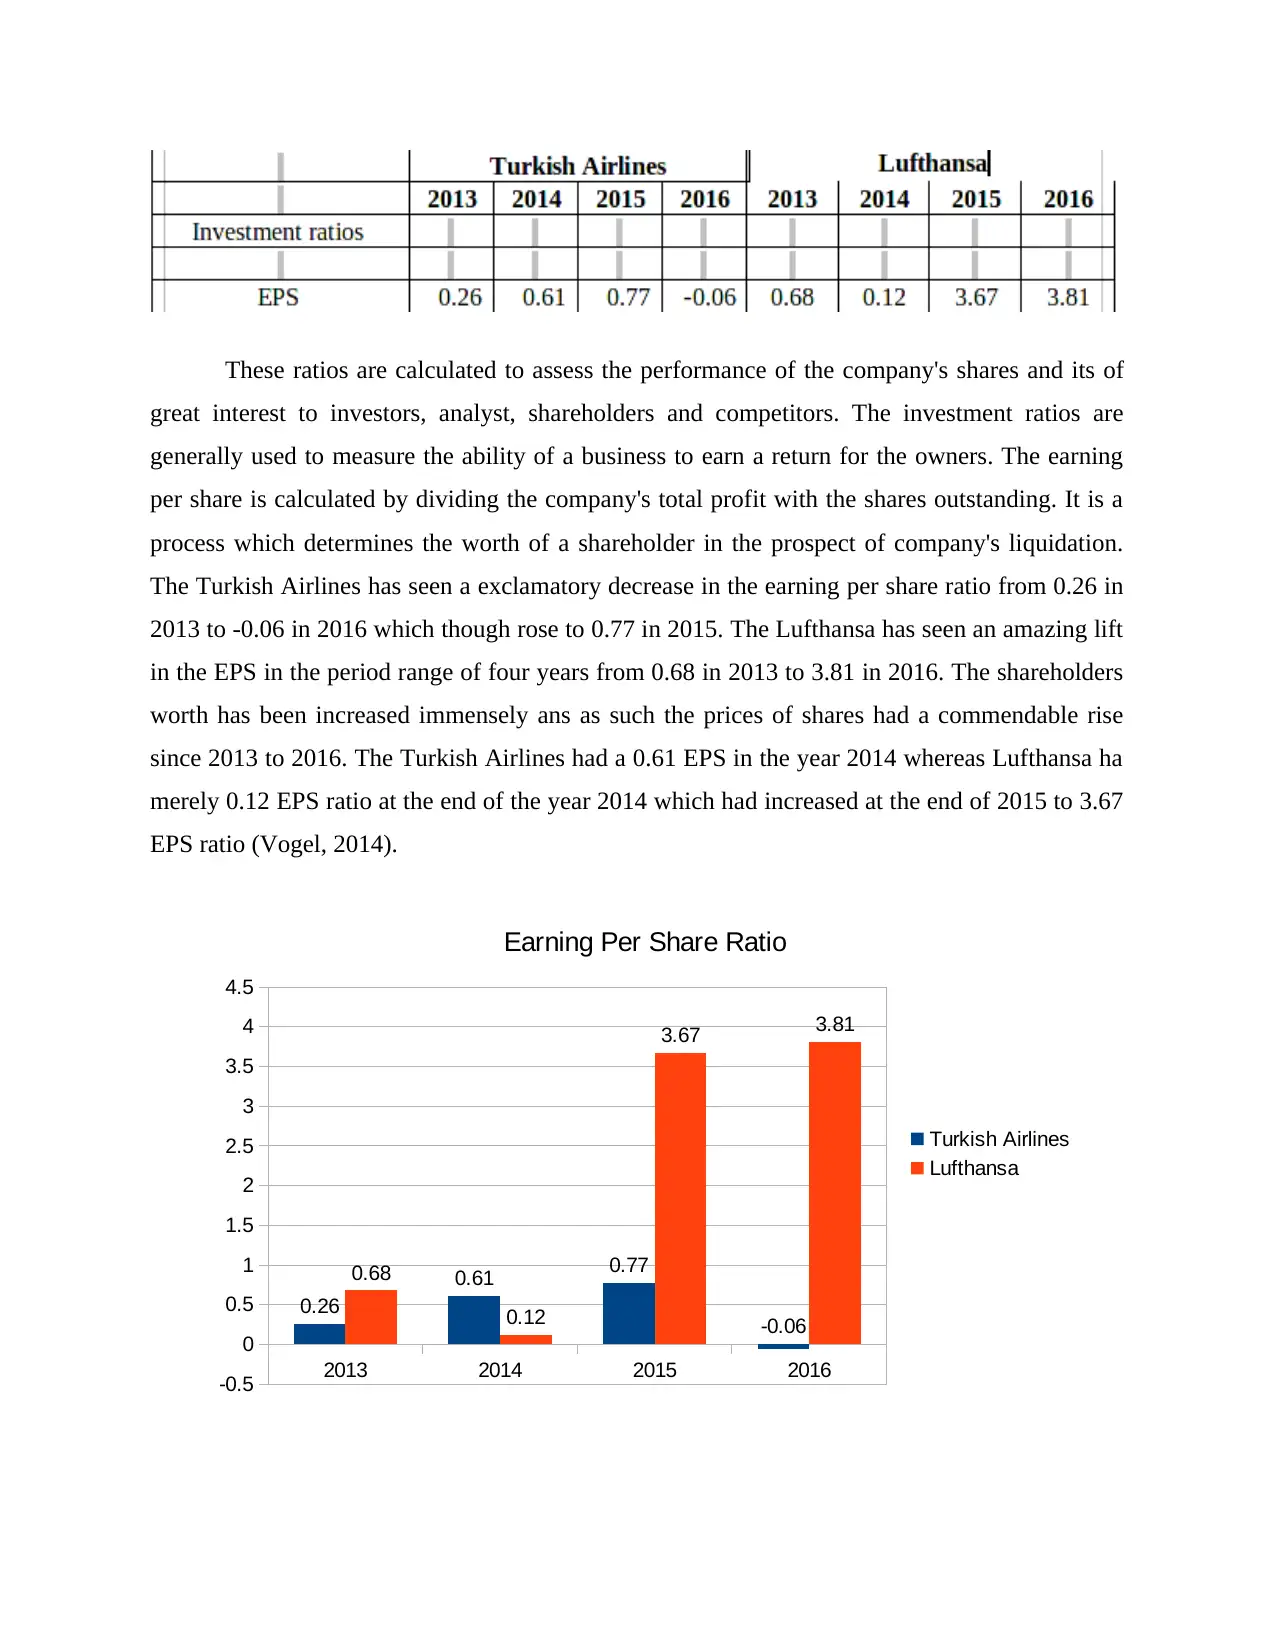
These ratios are calculated to assess the performance of the company's shares and its of
great interest to investors, analyst, shareholders and competitors. The investment ratios are
generally used to measure the ability of a business to earn a return for the owners. The earning
per share is calculated by dividing the company's total profit with the shares outstanding. It is a
process which determines the worth of a shareholder in the prospect of company's liquidation.
The Turkish Airlines has seen a exclamatory decrease in the earning per share ratio from 0.26 in
2013 to -0.06 in 2016 which though rose to 0.77 in 2015. The Lufthansa has seen an amazing lift
in the EPS in the period range of four years from 0.68 in 2013 to 3.81 in 2016. The shareholders
worth has been increased immensely ans as such the prices of shares had a commendable rise
since 2013 to 2016. The Turkish Airlines had a 0.61 EPS in the year 2014 whereas Lufthansa ha
merely 0.12 EPS ratio at the end of the year 2014 which had increased at the end of 2015 to 3.67
EPS ratio (Vogel, 2014).
2013 2014 2015 2016
-0.5
0
0.5
1
1.5
2
2.5
3
3.5
4
4.5
0.26
0.61 0.77
-0.06
0.68
0.12
3.67 3.81
Earning Per Share Ratio
Turkish Airlines
Lufthansa
From: Financial analyst
To: Head of Equity Research
Subject: Determining the performance of the organisation with the help of financial analysis
Sir,
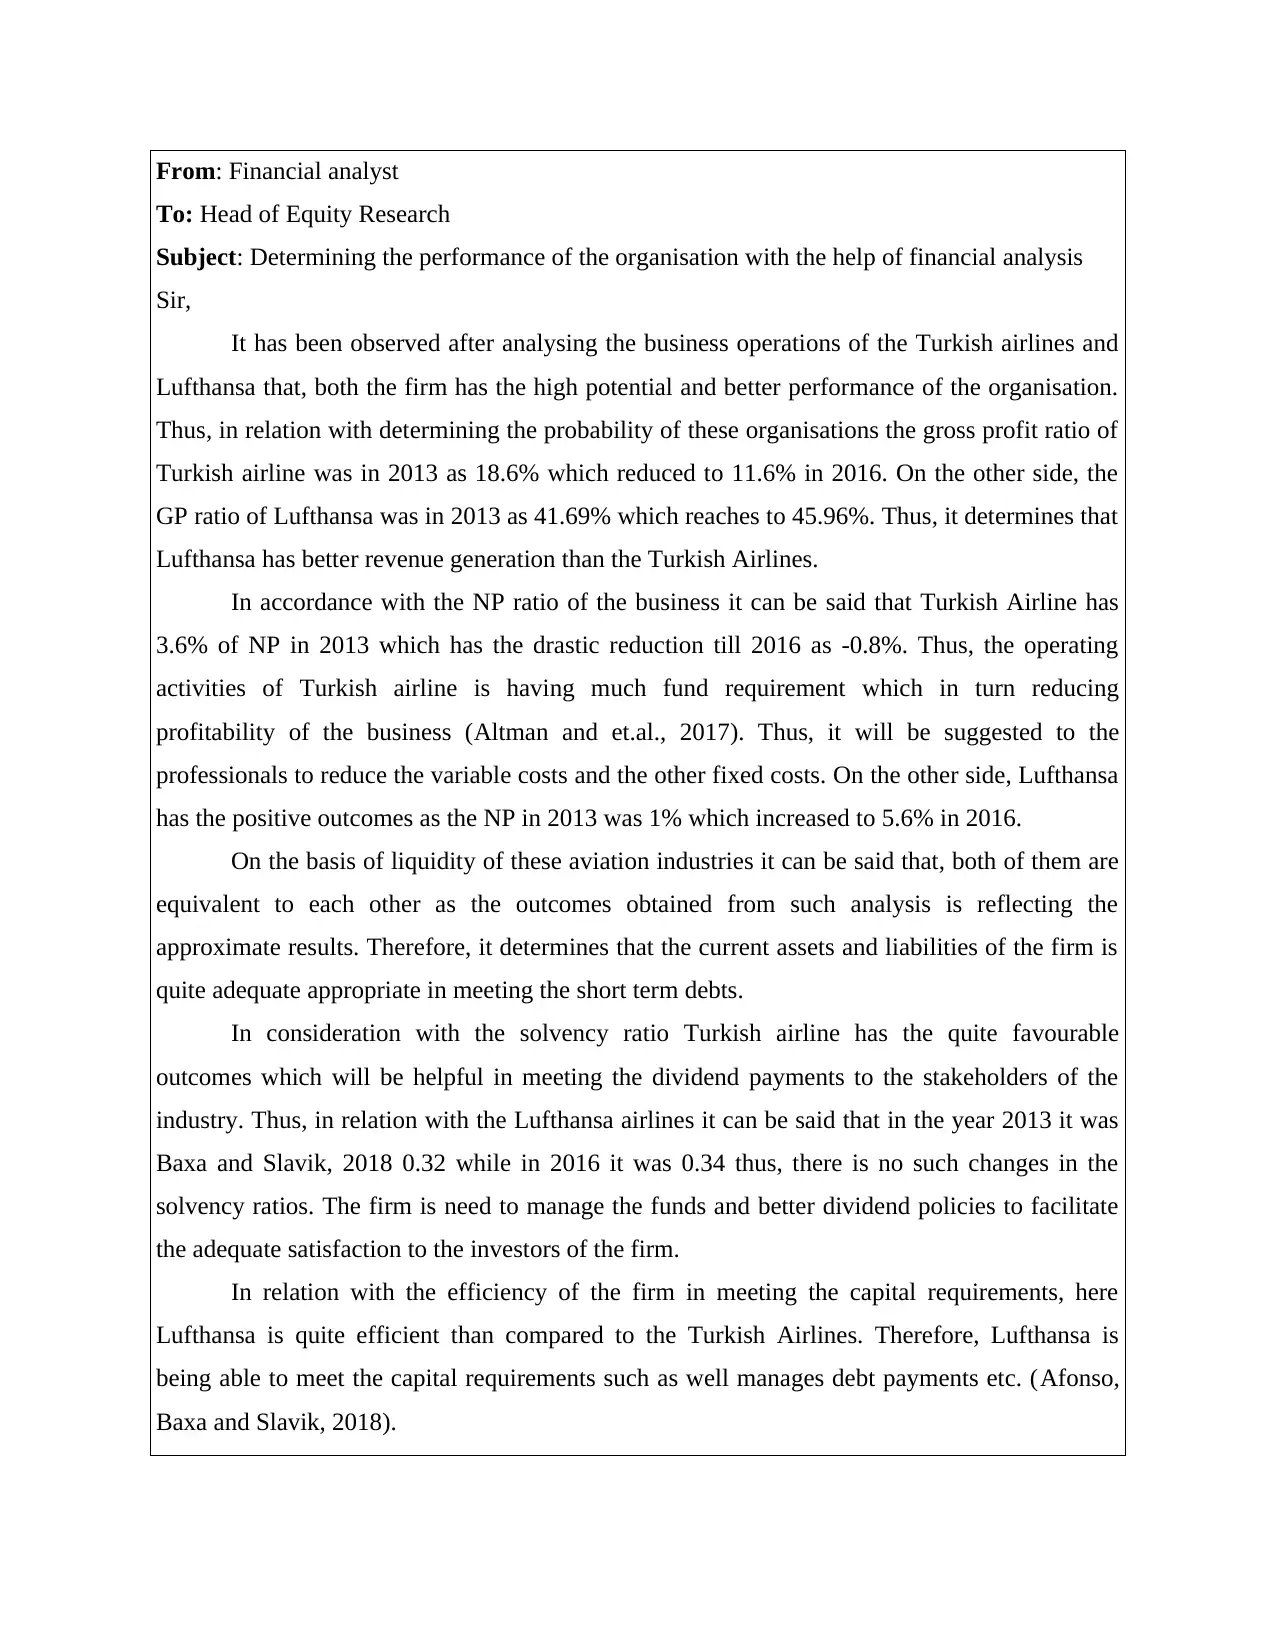
It has been observed after analysing the business operations of the Turkish airlines and
Lufthansa that, both the firm has the high potential and better performance of the organisation.
Thus, in relation with determining the probability of these organisations the gross profit ratio of
Turkish airline was in 2013 as 18.6% which reduced to 11.6% in 2016. On the other side, the
GP ratio of Lufthansa was in 2013 as 41.69% which reaches to 45.96%. Thus, it determines that
Lufthansa has better revenue generation than the Turkish Airlines.
In accordance with the NP ratio of the business it can be said that Turkish Airline has
3.6% of NP in 2013 which has the drastic reduction till 2016 as -0.8%. Thus, the operating
activities of Turkish airline is having much fund requirement which in turn reducing
profitability of the business (Altman and et.al., 2017). Thus, it will be suggested to the
professionals to reduce the variable costs and the other fixed costs. On the other side, Lufthansa
has the positive outcomes as the NP in 2013 was 1% which increased to 5.6% in 2016.
On the basis of liquidity of these aviation industries it can be said that, both of them are
equivalent to each other as the outcomes obtained from such analysis is reflecting the
approximate results. Therefore, it determines that the current assets and liabilities of the firm is
quite adequate appropriate in meeting the short term debts.
In consideration with the solvency ratio Turkish airline has the quite favourable
outcomes which will be helpful in meeting the dividend payments to the stakeholders of the
industry. Thus, in relation with the Lufthansa airlines it can be said that in the year 2013 it was
Baxa and Slavik, 2018 0.32 while in 2016 it was 0.34 thus, there is no such changes in the
solvency ratios. The firm is need to manage the funds and better dividend policies to facilitate
the adequate satisfaction to the investors of the firm.
In relation with the efficiency of the firm in meeting the capital requirements, here
Lufthansa is quite efficient than compared to the Turkish Airlines. Therefore, Lufthansa is
being able to meet the capital requirements such as well manages debt payments etc. (Afonso,
Baxa and Slavik, 2018).
To: Head of Equity Research
Subject: Determining the performance of the organisation with the help of financial analysis
Sir,
It has been observed after analysing the business operations of the Turkish airlines and
Lufthansa that, both the firm has the high potential and better performance of the organisation.
Thus, in relation with determining the probability of these organisations the gross profit ratio of
Turkish airline was in 2013 as 18.6% which reduced to 11.6% in 2016. On the other side, the
GP ratio of Lufthansa was in 2013 as 41.69% which reaches to 45.96%. Thus, it determines that
Lufthansa has better revenue generation than the Turkish Airlines.
In accordance with the NP ratio of the business it can be said that Turkish Airline has
3.6% of NP in 2013 which has the drastic reduction till 2016 as -0.8%. Thus, the operating
activities of Turkish airline is having much fund requirement which in turn reducing
profitability of the business (Altman and et.al., 2017). Thus, it will be suggested to the
professionals to reduce the variable costs and the other fixed costs. On the other side, Lufthansa
has the positive outcomes as the NP in 2013 was 1% which increased to 5.6% in 2016.
On the basis of liquidity of these aviation industries it can be said that, both of them are
equivalent to each other as the outcomes obtained from such analysis is reflecting the
approximate results. Therefore, it determines that the current assets and liabilities of the firm is
quite adequate appropriate in meeting the short term debts.
In consideration with the solvency ratio Turkish airline has the quite favourable
outcomes which will be helpful in meeting the dividend payments to the stakeholders of the
industry. Thus, in relation with the Lufthansa airlines it can be said that in the year 2013 it was
Baxa and Slavik, 2018 0.32 while in 2016 it was 0.34 thus, there is no such changes in the
solvency ratios. The firm is need to manage the funds and better dividend policies to facilitate
the adequate satisfaction to the investors of the firm.
In relation with the efficiency of the firm in meeting the capital requirements, here
Lufthansa is quite efficient than compared to the Turkish Airlines. Therefore, Lufthansa is
being able to meet the capital requirements such as well manages debt payments etc. (Afonso,
Baxa and Slavik, 2018).
⊘ This is a preview!⊘
Do you want full access?
Subscribe today to unlock all pages.
Trusted by 1+ million students worldwide
1 out of 17
Related Documents


Your All-in-One AI-Powered Toolkit for Academic Success.
+13062052269
info@desklib.com
Available 24*7 on WhatsApp / Email
![[object Object]](/_next/static/media/star-bottom.7253800d.svg)
Unlock your academic potential
Copyright © 2020–2026 A2Z Services. All Rights Reserved. Developed and managed by ZUCOL.