Financial Analysis Report: Investment Appraisal and Analysis
VerifiedAdded on 2020/12/09
|17
|4217
|343
Report
AI Summary
This report presents a detailed financial analysis, beginning with the preparation of an income statement and balance sheet for Gravepale Plc, followed by a contribution and break-even analysis for Cornpeace Ltd. The report then delves into investment planning for Dane Jones Ltd, utilizing capital budgeting tools such as payback period, net present value (NPV), and accounting rate of return (ARR). It assesses the viability of capital projects, compares different investment appraisal techniques, and evaluates the benefits and limitations of using budgets as a strategic planning tool. The analysis includes interpretations of financial data, calculations of profitability, and strategic recommendations regarding advertisement expenses and sales levels. The report concludes with an evaluation of investment appraisal techniques, offering insights into their advantages and disadvantages, and providing a comprehensive overview of financial management principles.

UGB163
Paraphrase This Document
Need a fresh take? Get an instant paraphrase of this document with our AI Paraphraser
Table of Contents
INTRODUCTION...........................................................................................................................1
MAIN BODY..................................................................................................................................1
PART A...........................................................................................................................................1
Income Statement for year ended 31/12/2017........................................................................1
Balance Sheet as on 31/03/2017.............................................................................................1
Interpretation:...................................................................................................................................4
PART B............................................................................................................................................4
a. Calculation of contribution per unit for Cornpeace Ltd.....................................................4
b. Computation of break even point and margin of safety.....................................................5
c. Computation of profits of the company at different sales levels........................................5
d. Analysis of the strategy for change in advertisement expenses and sales level.................5
PART C............................................................................................................................................6
a. Assessing the viability of capital projects using investment appraisal tools and techniques .6
B. Advantages and disadvantages of different investment appraisal techniques..................8
C. Report on benefits and limitation of using budgets as strategic planning tool...............11
CONCLUSION..............................................................................................................................13
REFERENCES..............................................................................................................................14
INTRODUCTION
Budgeting is tool which is used by a business to create a plan for spending the money in
most efficient way. The plan made is called as budgets and these are preprepared to forecast the
best investment plan in which money can be spent for best profitability. In the present report
Income statement and balance sheet for Gravepale Plc is prepared and for Cornpeace Ltd
contribution and break even analysis is done. Investment plan for Dane Jones Ltd is prepared
through various capital budgeting tools for purchasing a machine from available two options.
Along with this, advantages and disadvantages of various investment appraisal techniques such
as Average rate of return, net present value and pay back period is presented.
MAIN BODY
PART A
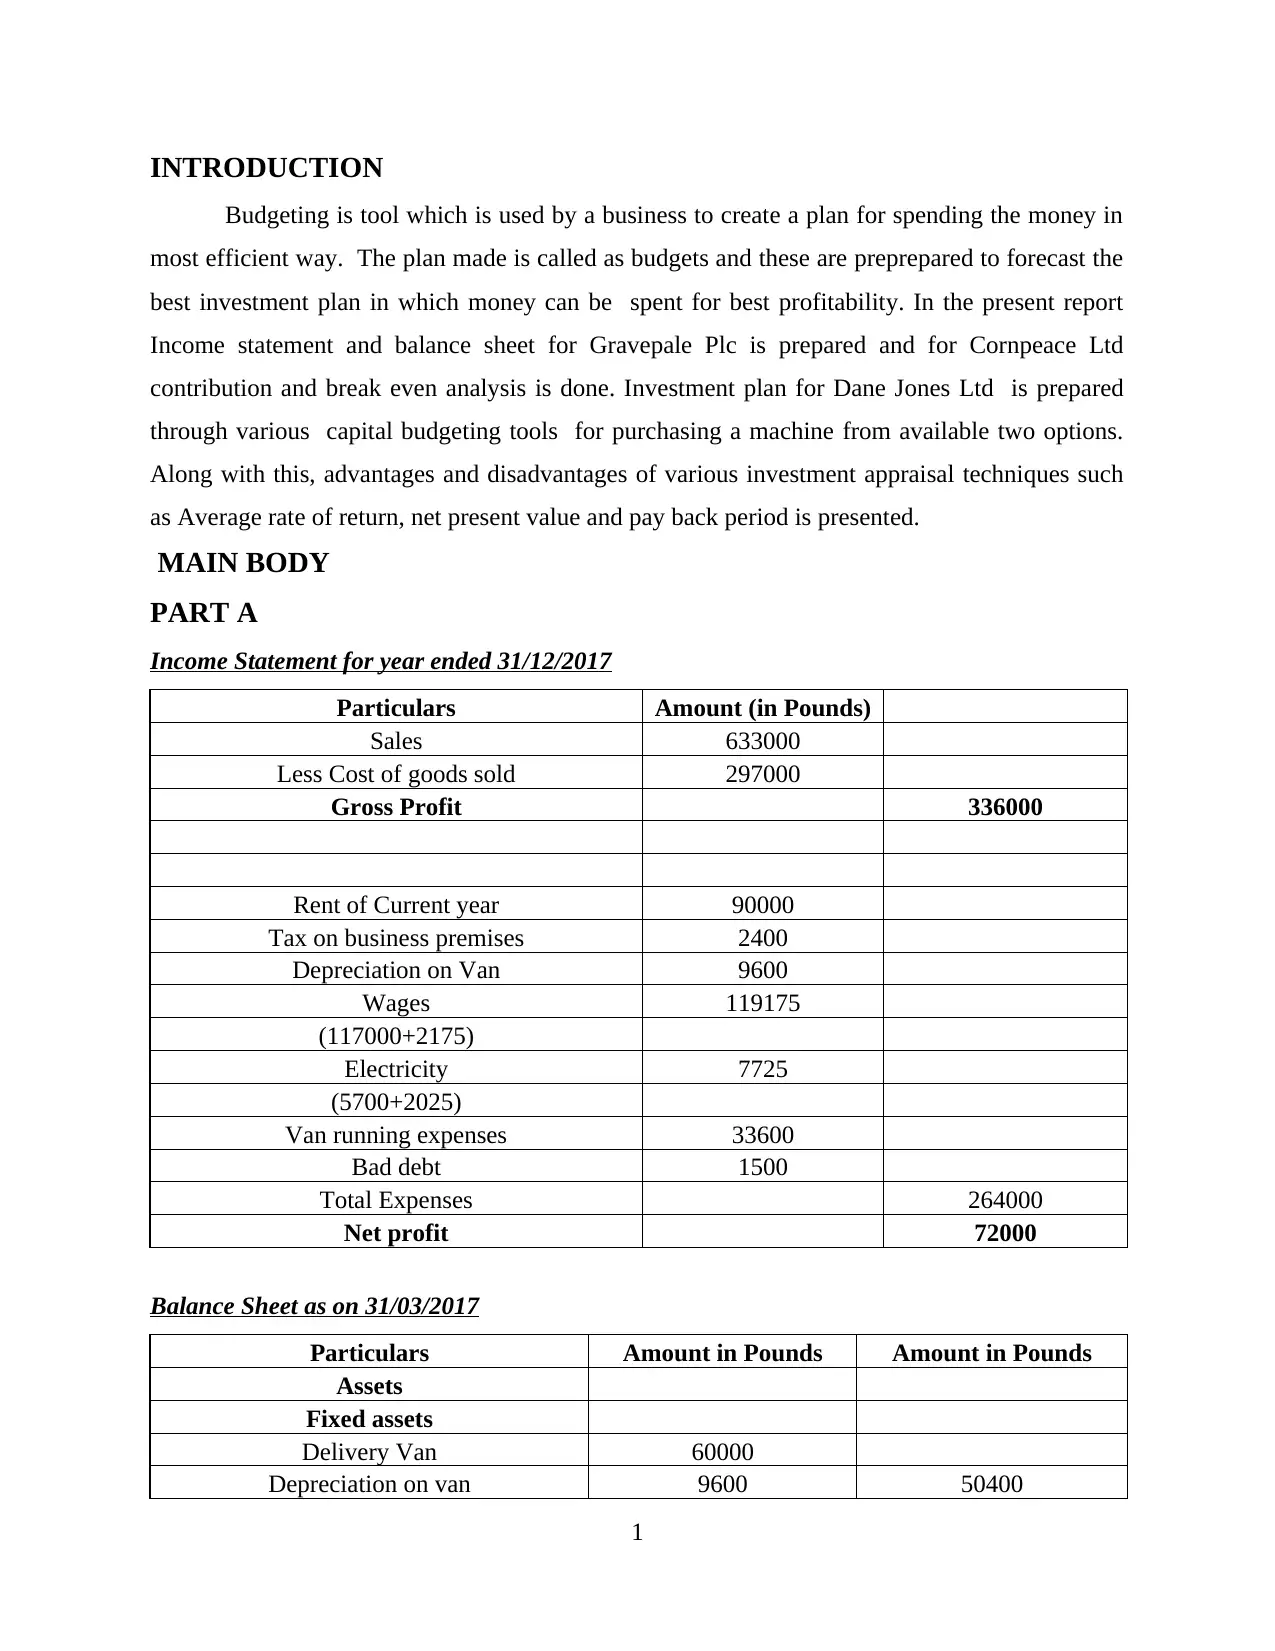
Income Statement for year ended 31/12/2017
Particulars Amount (in Pounds)
Sales 633000
Less Cost of goods sold 297000
Gross Profit 336000
Rent of Current year 90000
Tax on business premises 2400
Depreciation on Van 9600
Wages 119175
(117000+2175)
Electricity 7725
(5700+2025)
Van running expenses 33600
Bad debt 1500
Total Expenses 264000
Net profit 72000
Balance Sheet as on 31/03/2017
Particulars Amount in Pounds Amount in Pounds
Assets
Fixed assets
Delivery Van 60000
Depreciation on van 9600 50400
1
Budgeting is tool which is used by a business to create a plan for spending the money in
most efficient way. The plan made is called as budgets and these are preprepared to forecast the
best investment plan in which money can be spent for best profitability. In the present report
Income statement and balance sheet for Gravepale Plc is prepared and for Cornpeace Ltd
contribution and break even analysis is done. Investment plan for Dane Jones Ltd is prepared
through various capital budgeting tools for purchasing a machine from available two options.
Along with this, advantages and disadvantages of various investment appraisal techniques such
as Average rate of return, net present value and pay back period is presented.
MAIN BODY
PART A
Income Statement for year ended 31/12/2017
Particulars Amount (in Pounds)
Sales 633000
Less Cost of goods sold 297000
Gross Profit 336000
Rent of Current year 90000
Tax on business premises 2400
Depreciation on Van 9600
Wages 119175
(117000+2175)
Electricity 7725
(5700+2025)
Van running expenses 33600
Bad debt 1500
Total Expenses 264000
Net profit 72000
Balance Sheet as on 31/03/2017
Particulars Amount in Pounds Amount in Pounds
Assets
Fixed assets
Delivery Van 60000
Depreciation on van 9600 50400
1
⊘ This is a preview!⊘
Do you want full access?
Subscribe today to unlock all pages.
Trusted by 1+ million students worldwide
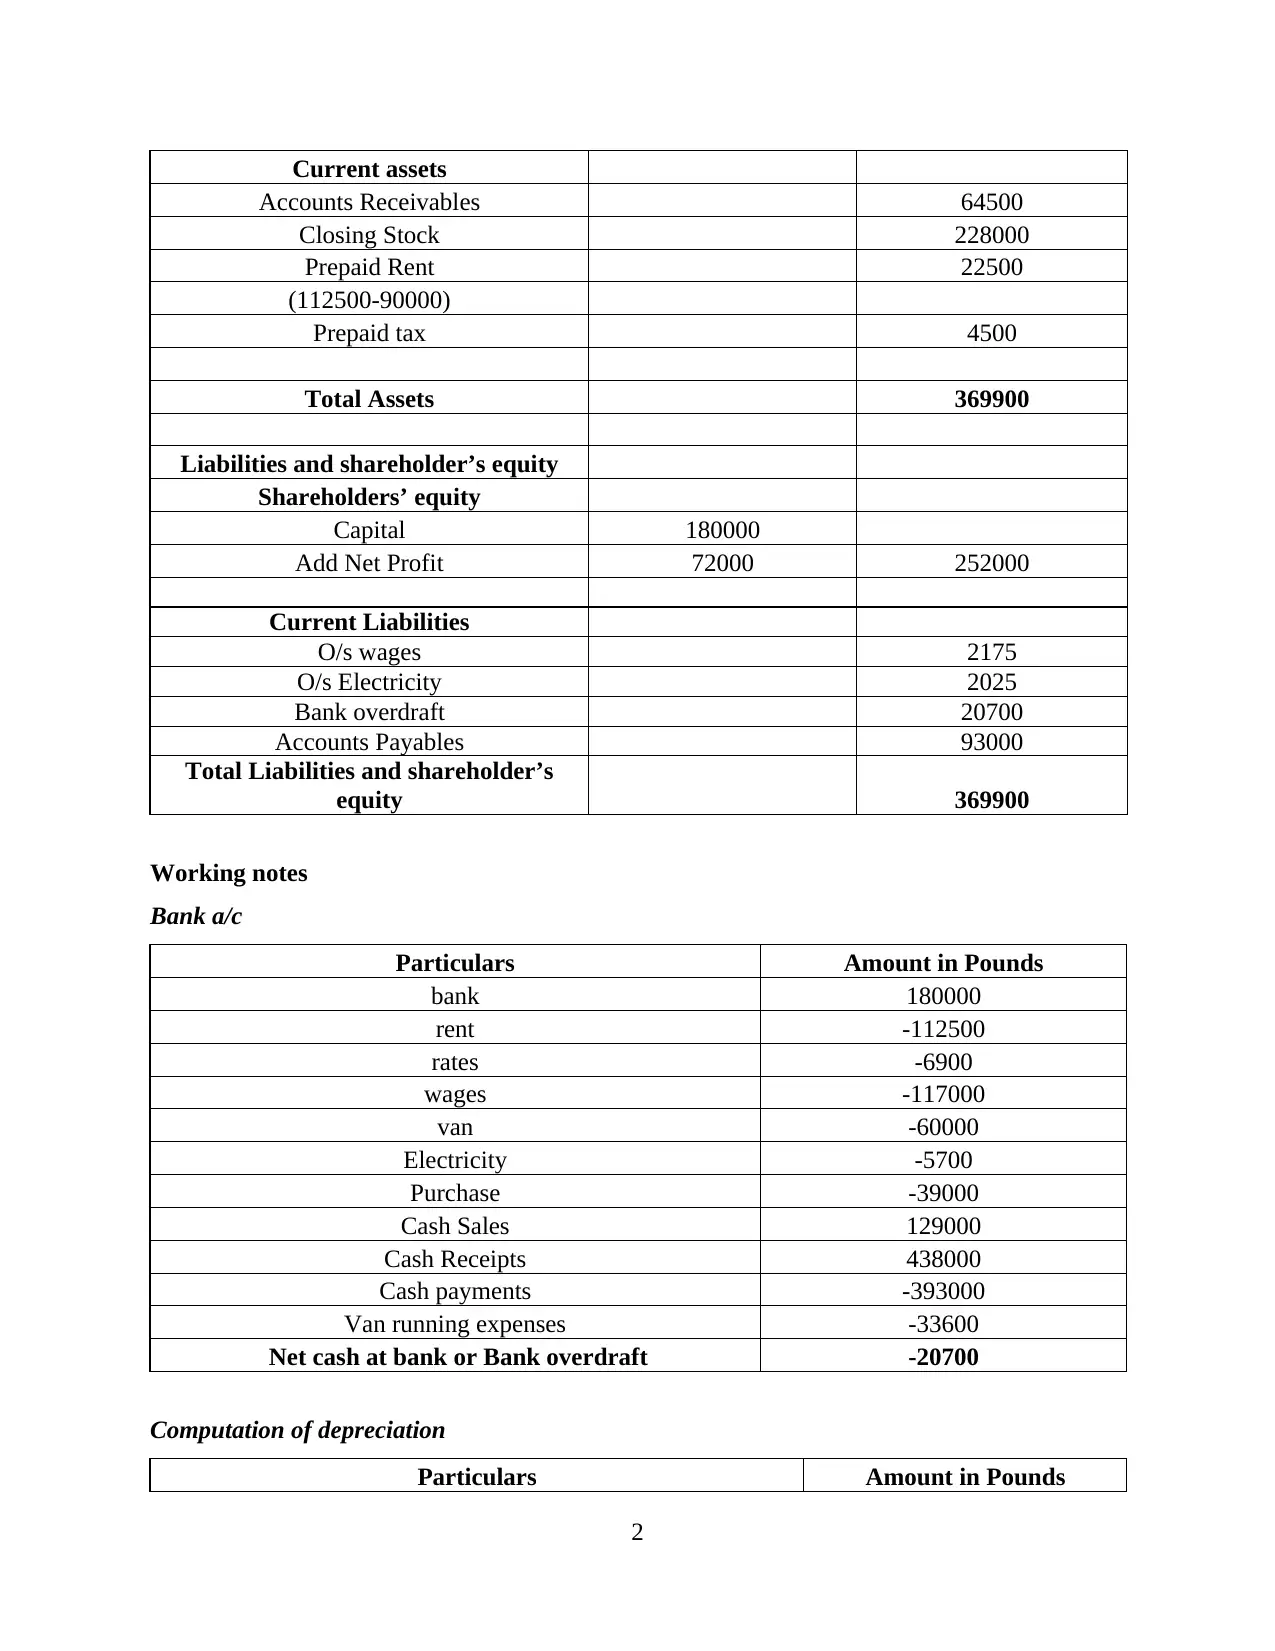
Current assets
Accounts Receivables 64500
Closing Stock 228000
Prepaid Rent 22500
(112500-90000)
Prepaid tax 4500
Total Assets 369900
Liabilities and shareholder’s equity
Shareholders’ equity
Capital 180000
Add Net Profit 72000 252000
Current Liabilities
O/s wages 2175
O/s Electricity 2025
Bank overdraft 20700
Accounts Payables 93000
Total Liabilities and shareholder’s
equity 369900
Working notes
Bank a/c
Particulars Amount in Pounds
bank 180000
rent -112500
rates -6900
wages -117000
van -60000
Electricity -5700
Purchase -39000
Cash Sales 129000
Cash Receipts 438000
Cash payments -393000
Van running expenses -33600
Net cash at bank or Bank overdraft -20700
Computation of depreciation
Particulars Amount in Pounds
2
Paraphrase This Document
Need a fresh take? Get an instant paraphrase of this document with our AI Paraphraser
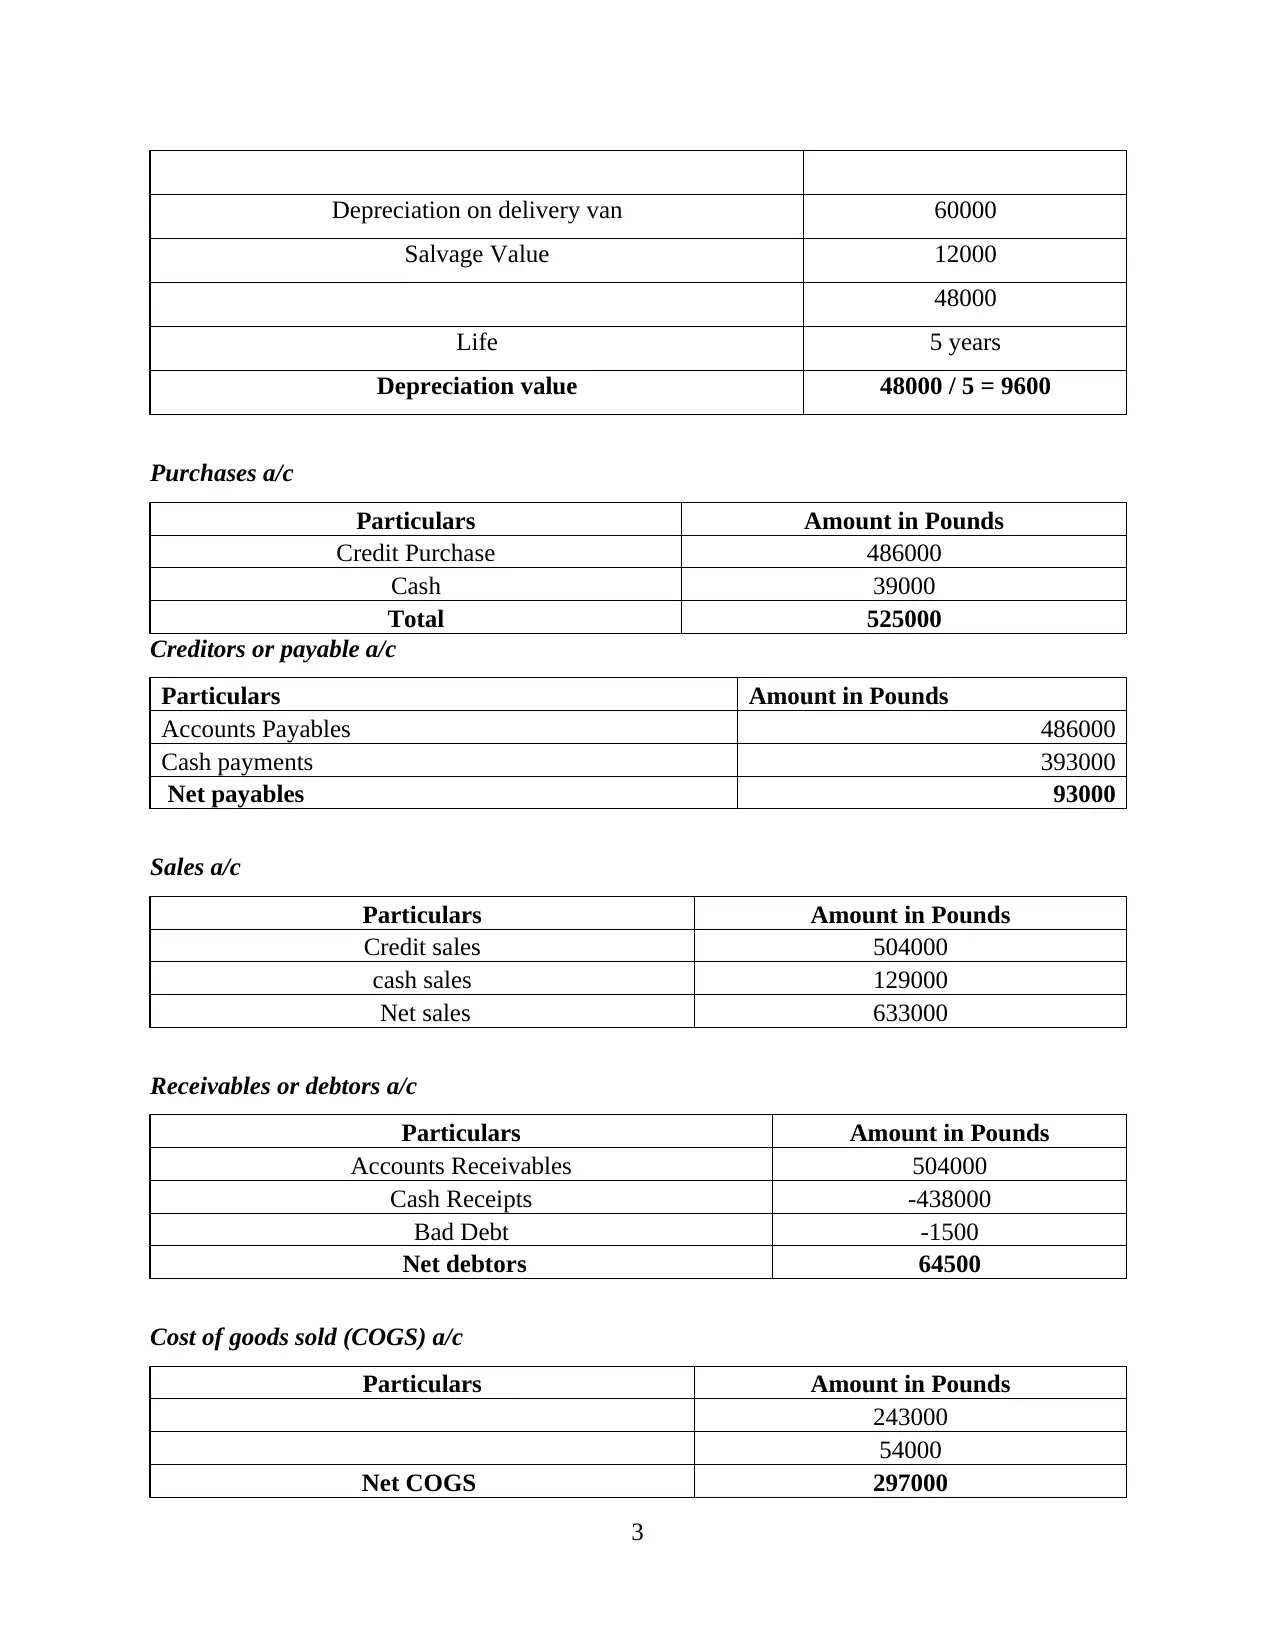
Depreciation on delivery van 60000
Salvage Value 12000
48000
Life 5 years
Depreciation value 48000 / 5 = 9600
Purchases a/c
Particulars Amount in Pounds
Credit Purchase 486000
Cash 39000
Total 525000
Creditors or payable a/c
Particulars Amount in Pounds
Accounts Payables 486000
Cash payments 393000
Net payables 93000
Sales a/c
Particulars Amount in Pounds
Credit sales 504000
cash sales 129000
Net sales 633000
Receivables or debtors a/c
Particulars Amount in Pounds
Accounts Receivables 504000
Cash Receipts -438000
Bad Debt -1500
Net debtors 64500
Cost of goods sold (COGS) a/c
Particulars Amount in Pounds
243000
54000
Net COGS 297000
3
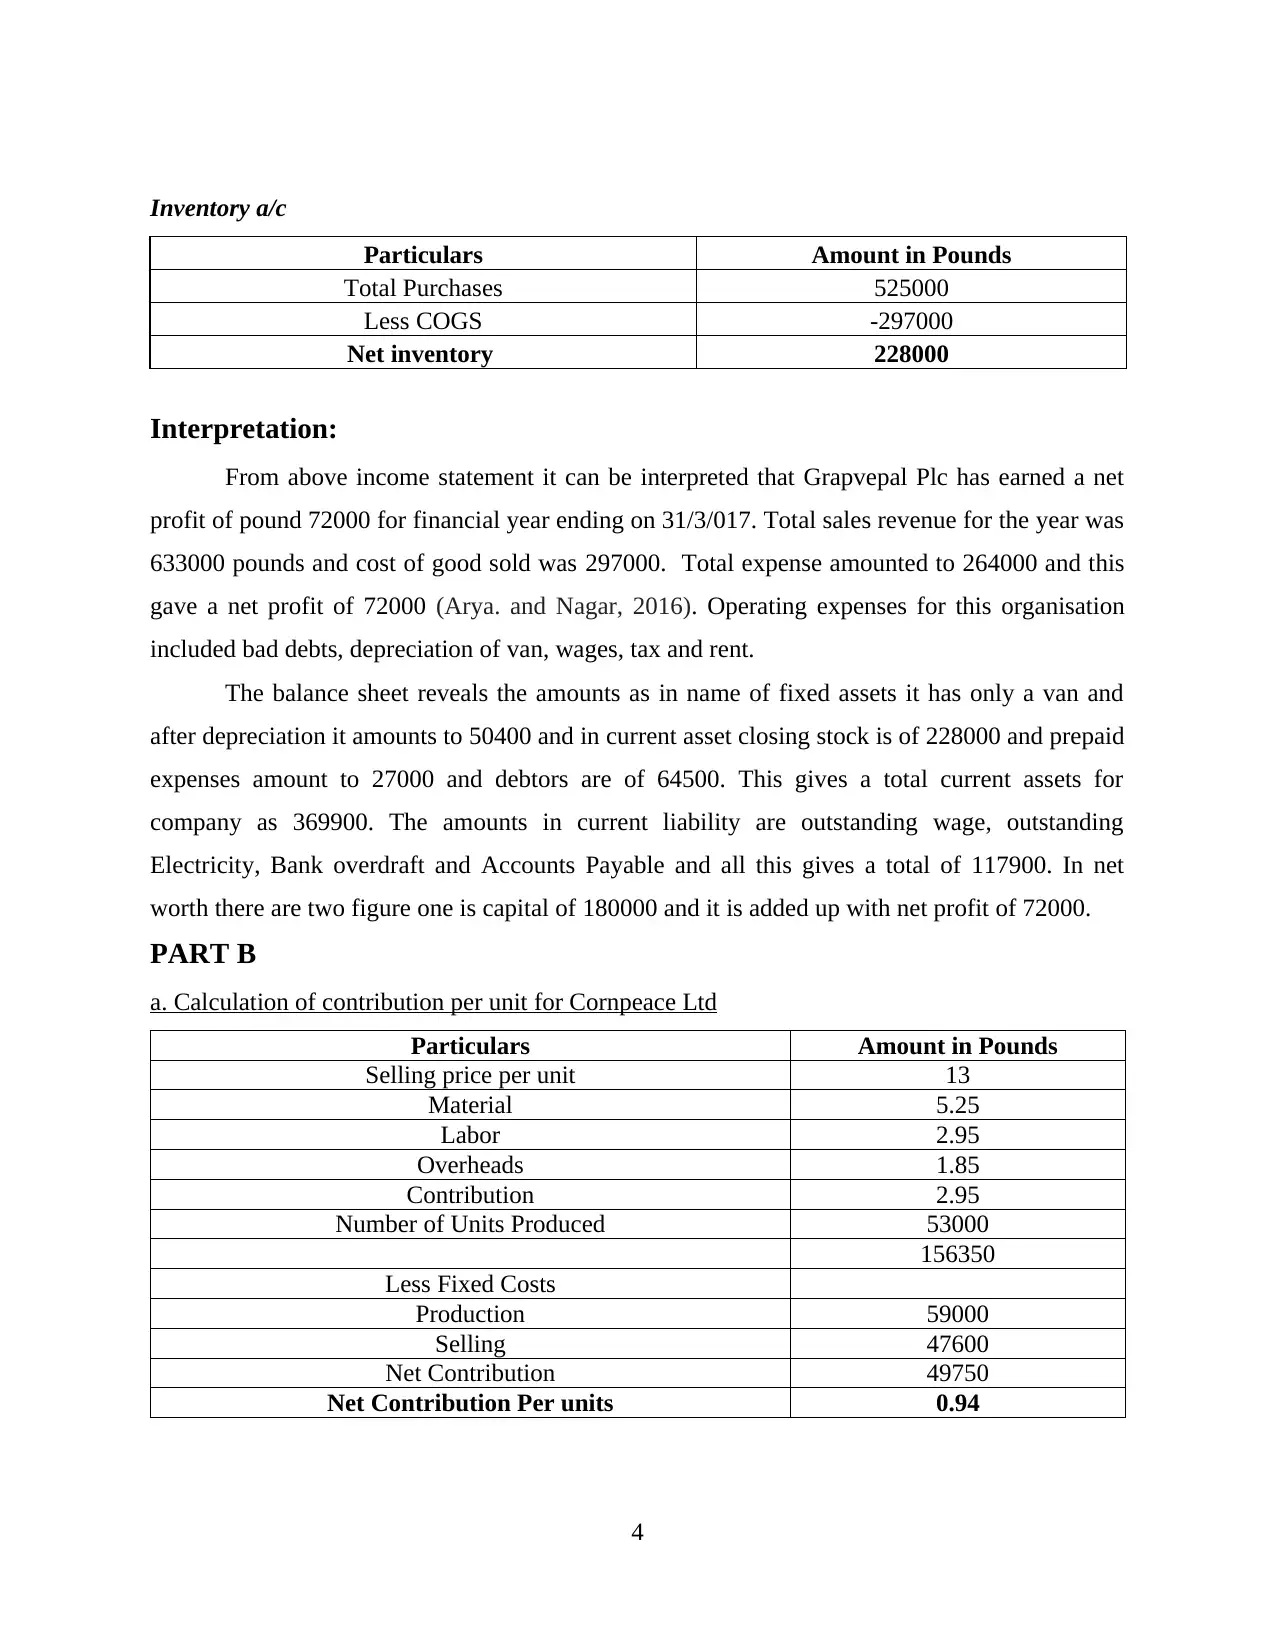
Inventory a/c
Particulars Amount in Pounds
Total Purchases 525000
Less COGS -297000
Net inventory 228000
Interpretation:
From above income statement it can be interpreted that Grapvepal Plc has earned a net
profit of pound 72000 for financial year ending on 31/3/017. Total sales revenue for the year was
633000 pounds and cost of good sold was 297000. Total expense amounted to 264000 and this
gave a net profit of 72000 (Arya. and Nagar, 2016). Operating expenses for this organisation
included bad debts, depreciation of van, wages, tax and rent.
The balance sheet reveals the amounts as in name of fixed assets it has only a van and
after depreciation it amounts to 50400 and in current asset closing stock is of 228000 and prepaid
expenses amount to 27000 and debtors are of 64500. This gives a total current assets for
company as 369900. The amounts in current liability are outstanding wage, outstanding
Electricity, Bank overdraft and Accounts Payable and all this gives a total of 117900. In net
worth there are two figure one is capital of 180000 and it is added up with net profit of 72000.
PART B
a. Calculation of contribution per unit for Cornpeace Ltd
Particulars Amount in Pounds
Selling price per unit 13
Material 5.25
Labor 2.95
Overheads 1.85
Contribution 2.95
Number of Units Produced 53000
156350
Less Fixed Costs
Production 59000
Selling 47600
Net Contribution 49750
Net Contribution Per units 0.94
4
Particulars Amount in Pounds
Total Purchases 525000
Less COGS -297000
Net inventory 228000
Interpretation:
From above income statement it can be interpreted that Grapvepal Plc has earned a net
profit of pound 72000 for financial year ending on 31/3/017. Total sales revenue for the year was
633000 pounds and cost of good sold was 297000. Total expense amounted to 264000 and this
gave a net profit of 72000 (Arya. and Nagar, 2016). Operating expenses for this organisation
included bad debts, depreciation of van, wages, tax and rent.
The balance sheet reveals the amounts as in name of fixed assets it has only a van and
after depreciation it amounts to 50400 and in current asset closing stock is of 228000 and prepaid
expenses amount to 27000 and debtors are of 64500. This gives a total current assets for
company as 369900. The amounts in current liability are outstanding wage, outstanding
Electricity, Bank overdraft and Accounts Payable and all this gives a total of 117900. In net
worth there are two figure one is capital of 180000 and it is added up with net profit of 72000.
PART B
a. Calculation of contribution per unit for Cornpeace Ltd
Particulars Amount in Pounds
Selling price per unit 13
Material 5.25
Labor 2.95
Overheads 1.85
Contribution 2.95
Number of Units Produced 53000
156350
Less Fixed Costs
Production 59000
Selling 47600
Net Contribution 49750
Net Contribution Per units 0.94
4
⊘ This is a preview!⊘
Do you want full access?
Subscribe today to unlock all pages.
Trusted by 1+ million students worldwide
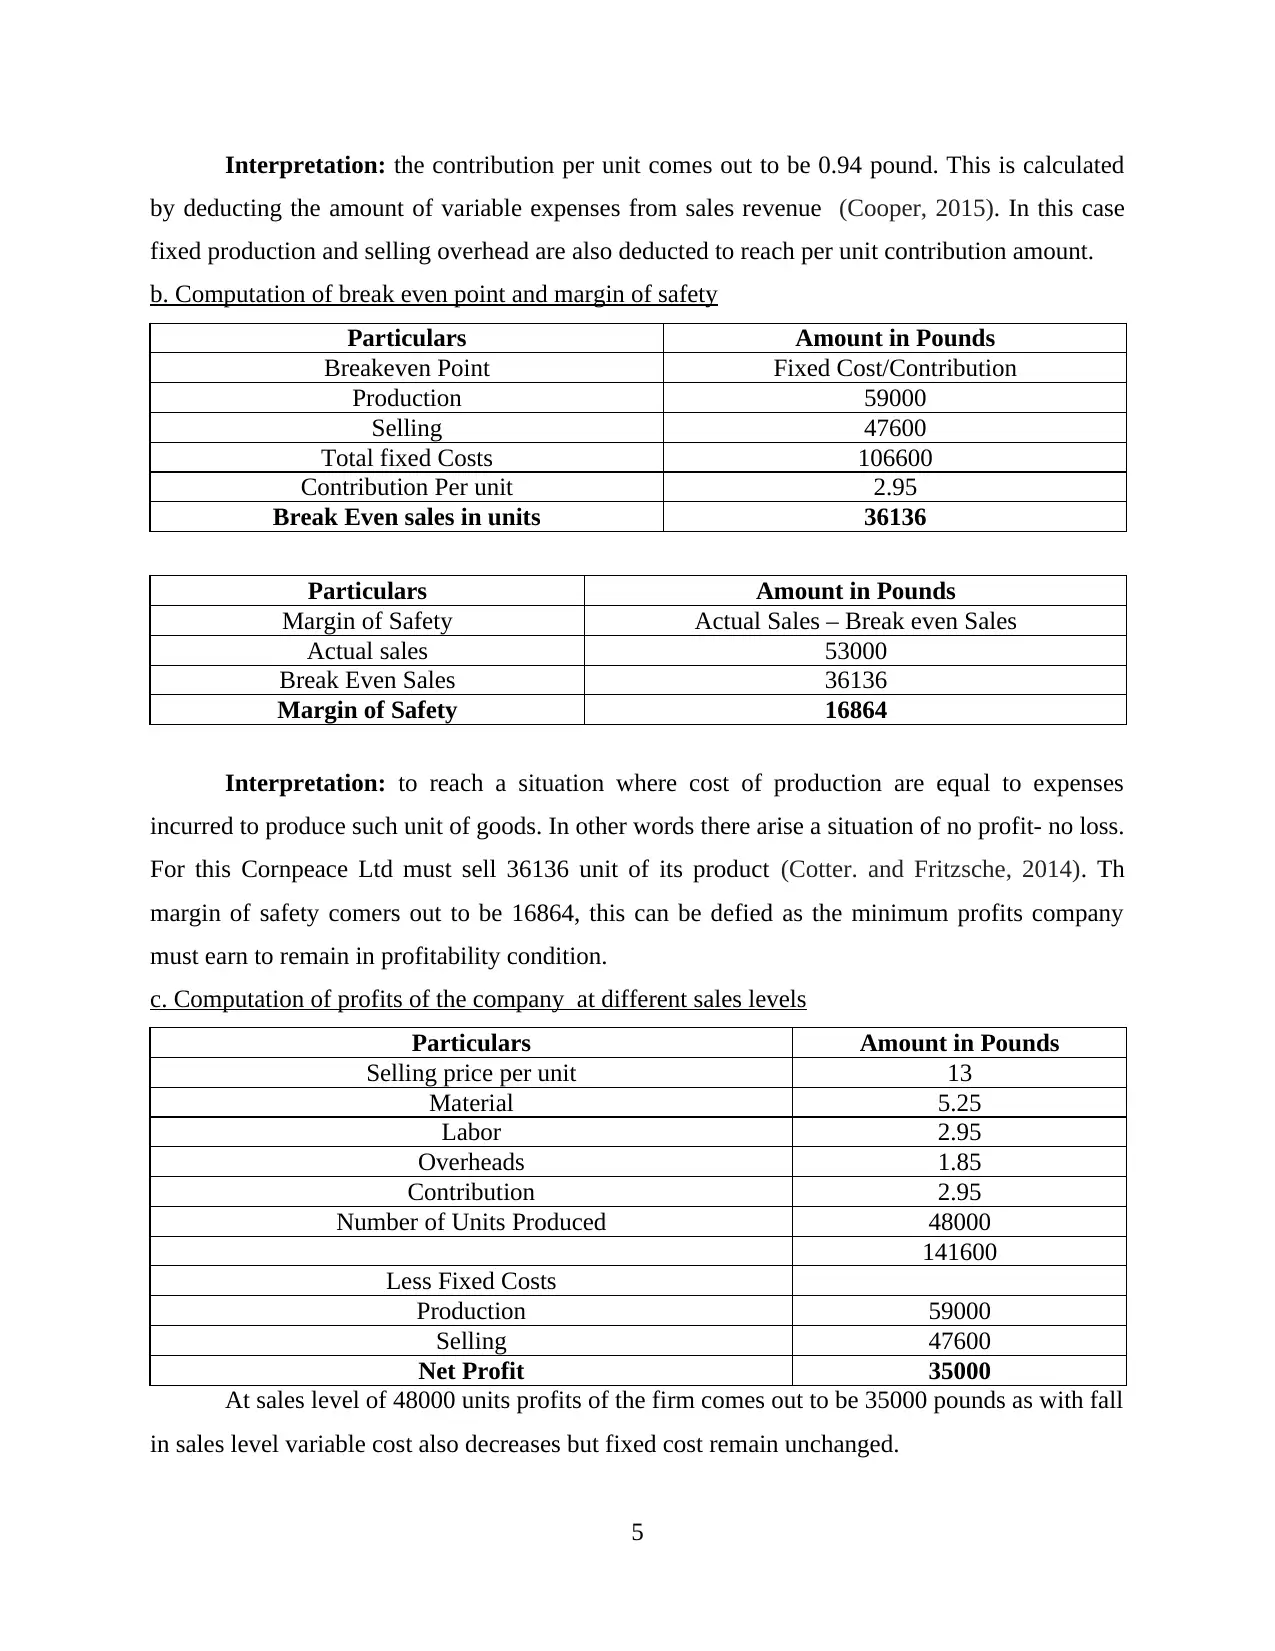
Interpretation: the contribution per unit comes out to be 0.94 pound. This is calculated
by deducting the amount of variable expenses from sales revenue (Cooper, 2015). In this case
fixed production and selling overhead are also deducted to reach per unit contribution amount.
b. Computation of break even point and margin of safety
Particulars Amount in Pounds
Breakeven Point Fixed Cost/Contribution
Production 59000
Selling 47600
Total fixed Costs 106600
Contribution Per unit 2.95
Break Even sales in units 36136
Particulars Amount in Pounds
Margin of Safety Actual Sales – Break even Sales
Actual sales 53000
Break Even Sales 36136
Margin of Safety 16864
Interpretation: to reach a situation where cost of production are equal to expenses
incurred to produce such unit of goods. In other words there arise a situation of no profit- no loss.
For this Cornpeace Ltd must sell 36136 unit of its product (Cotter. and Fritzsche, 2014). Th
margin of safety comers out to be 16864, this can be defied as the minimum profits company
must earn to remain in profitability condition.
c. Computation of profits of the company at different sales levels
Particulars Amount in Pounds
Selling price per unit 13
Material 5.25
Labor 2.95
Overheads 1.85
Contribution 2.95
Number of Units Produced 48000
141600
Less Fixed Costs
Production 59000
Selling 47600
Net Profit 35000
At sales level of 48000 units profits of the firm comes out to be 35000 pounds as with fall
in sales level variable cost also decreases but fixed cost remain unchanged.
5
Paraphrase This Document
Need a fresh take? Get an instant paraphrase of this document with our AI Paraphraser
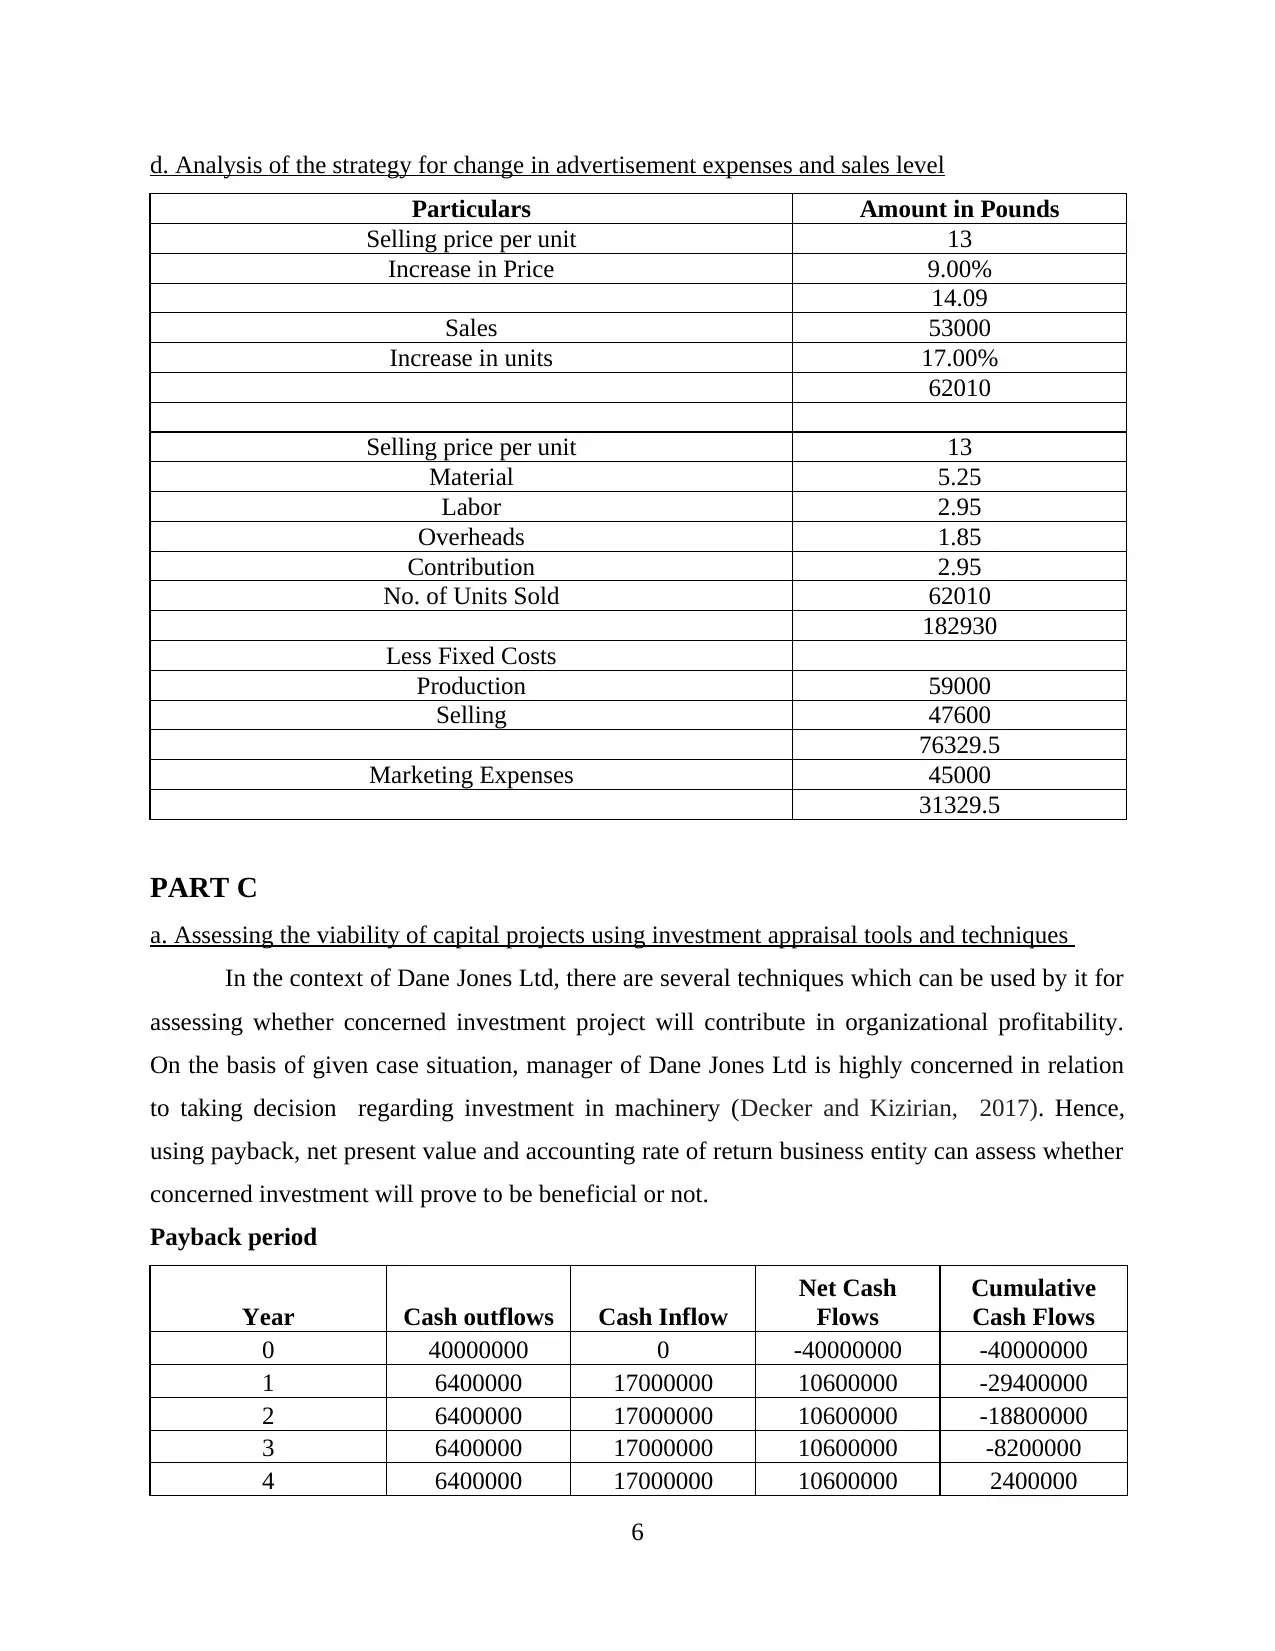
d. Analysis of the strategy for change in advertisement expenses and sales level
Particulars Amount in Pounds
Selling price per unit 13
Increase in Price 9.00%
14.09
Sales 53000
Increase in units 17.00%
62010
Selling price per unit 13
Material 5.25
Labor 2.95
Overheads 1.85
Contribution 2.95
No. of Units Sold 62010
182930
Less Fixed Costs
Production 59000
Selling 47600
76329.5
Marketing Expenses 45000
31329.5
PART C
a. Assessing the viability of capital projects using investment appraisal tools and techniques
In the context of Dane Jones Ltd, there are several techniques which can be used by it for
assessing whether concerned investment project will contribute in organizational profitability.
On the basis of given case situation, manager of Dane Jones Ltd is highly concerned in relation
to taking decision regarding investment in machinery (Decker and Kizirian, 2017). Hence,
using payback, net present value and accounting rate of return business entity can assess whether
concerned investment will prove to be beneficial or not.
Payback period
Year Cash outflows Cash Inflow
Net Cash
Flows
Cumulative
Cash Flows
0 40000000 0 -40000000 -40000000
1 6400000 17000000 10600000 -29400000
2 6400000 17000000 10600000 -18800000
3 6400000 17000000 10600000 -8200000
4 6400000 17000000 10600000 2400000
6
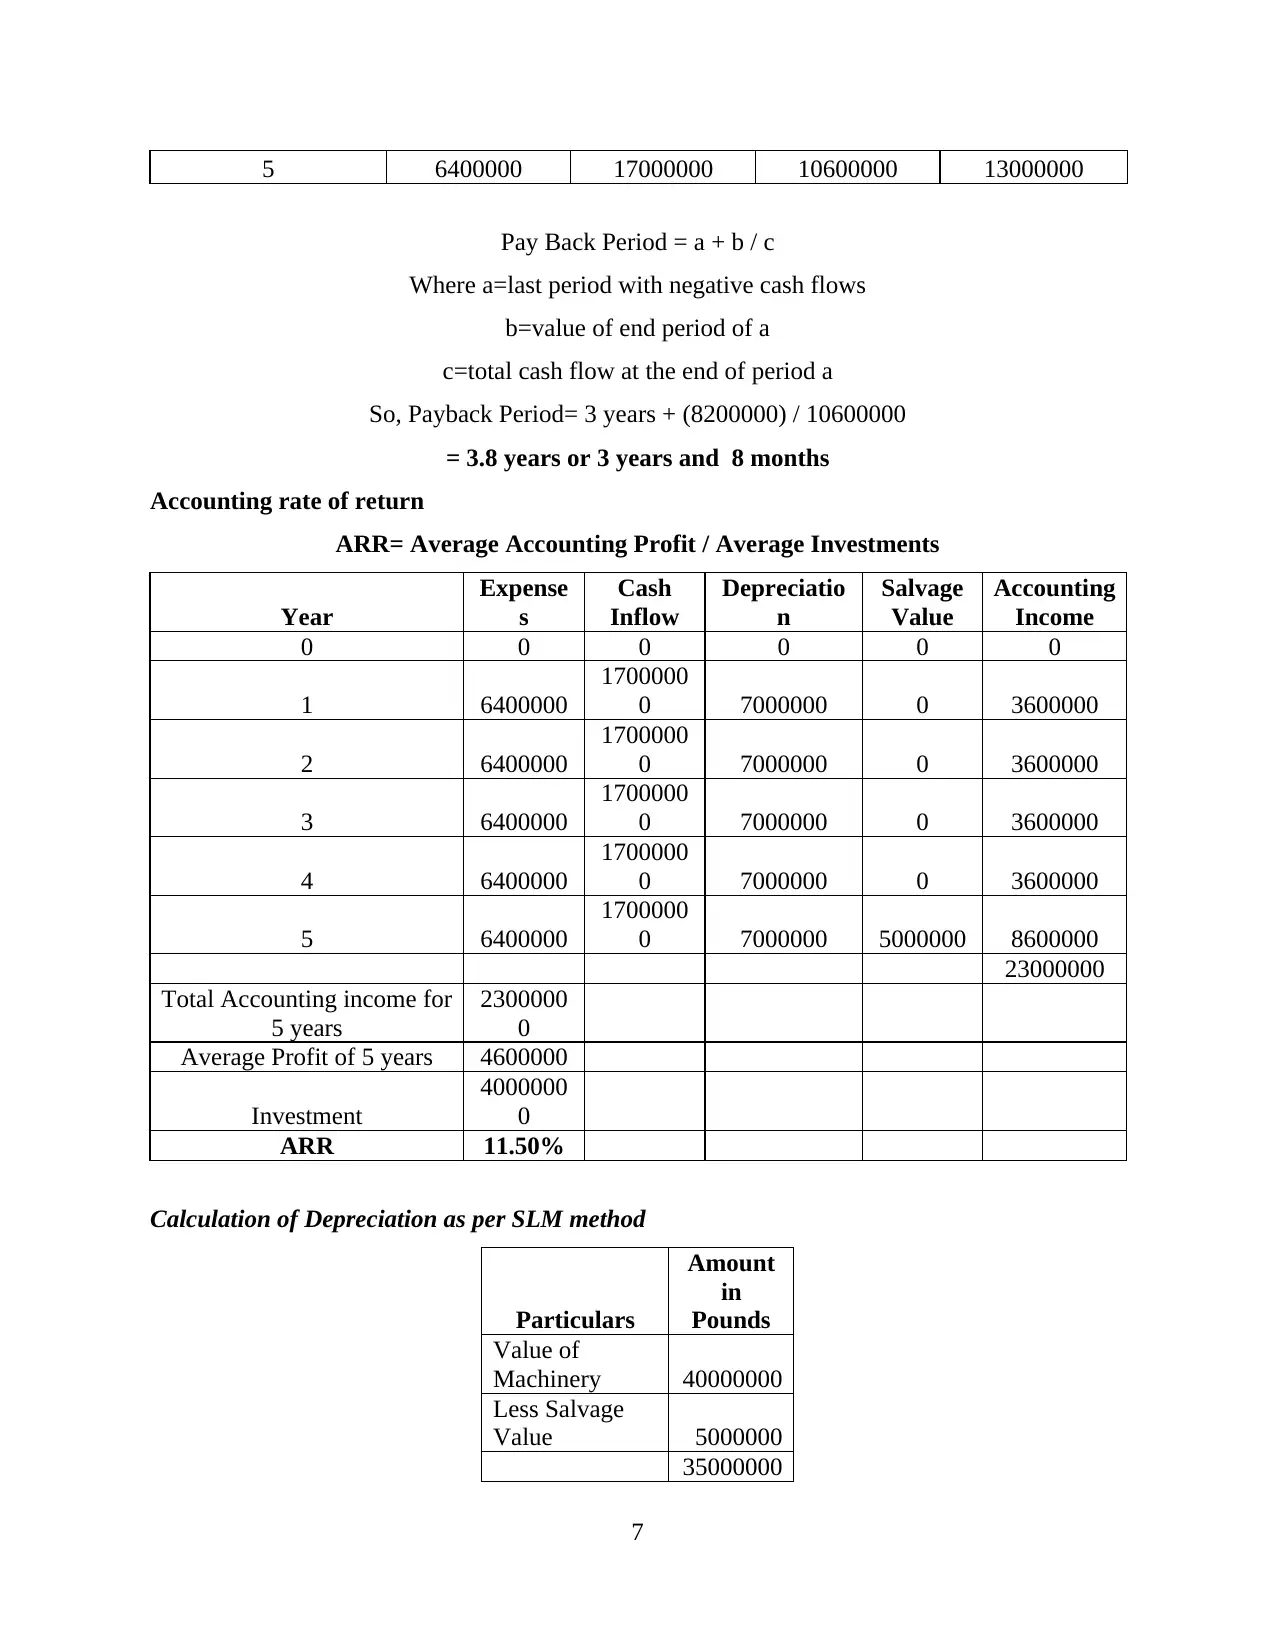
5 6400000 17000000 10600000 13000000
Pay Back Period = a + b / c
Where a=last period with negative cash flows
b=value of end period of a
c=total cash flow at the end of period a
So, Payback Period= 3 years + (8200000) / 10600000
= 3.8 years or 3 years and 8 months
Accounting rate of return
ARR= Average Accounting Profit / Average Investments
Year
Expense
s
Cash
Inflow
Depreciatio
n
Salvage
Value
Accounting
Income
0 0 0 0 0 0
1 6400000
1700000
0 7000000 0 3600000
2 6400000
1700000
0 7000000 0 3600000
3 6400000
1700000
0 7000000 0 3600000
4 6400000
1700000
0 7000000 0 3600000
5 6400000
1700000
0 7000000 5000000 8600000
23000000
Total Accounting income for
5 years
2300000
0
Average Profit of 5 years 4600000
Investment
4000000
0
ARR 11.50%
Calculation of Depreciation as per SLM method
Particulars
Amount
in
Pounds
Value of
Machinery 40000000
Less Salvage
Value 5000000
35000000
7
⊘ This is a preview!⊘
Do you want full access?
Subscribe today to unlock all pages.
Trusted by 1+ million students worldwide
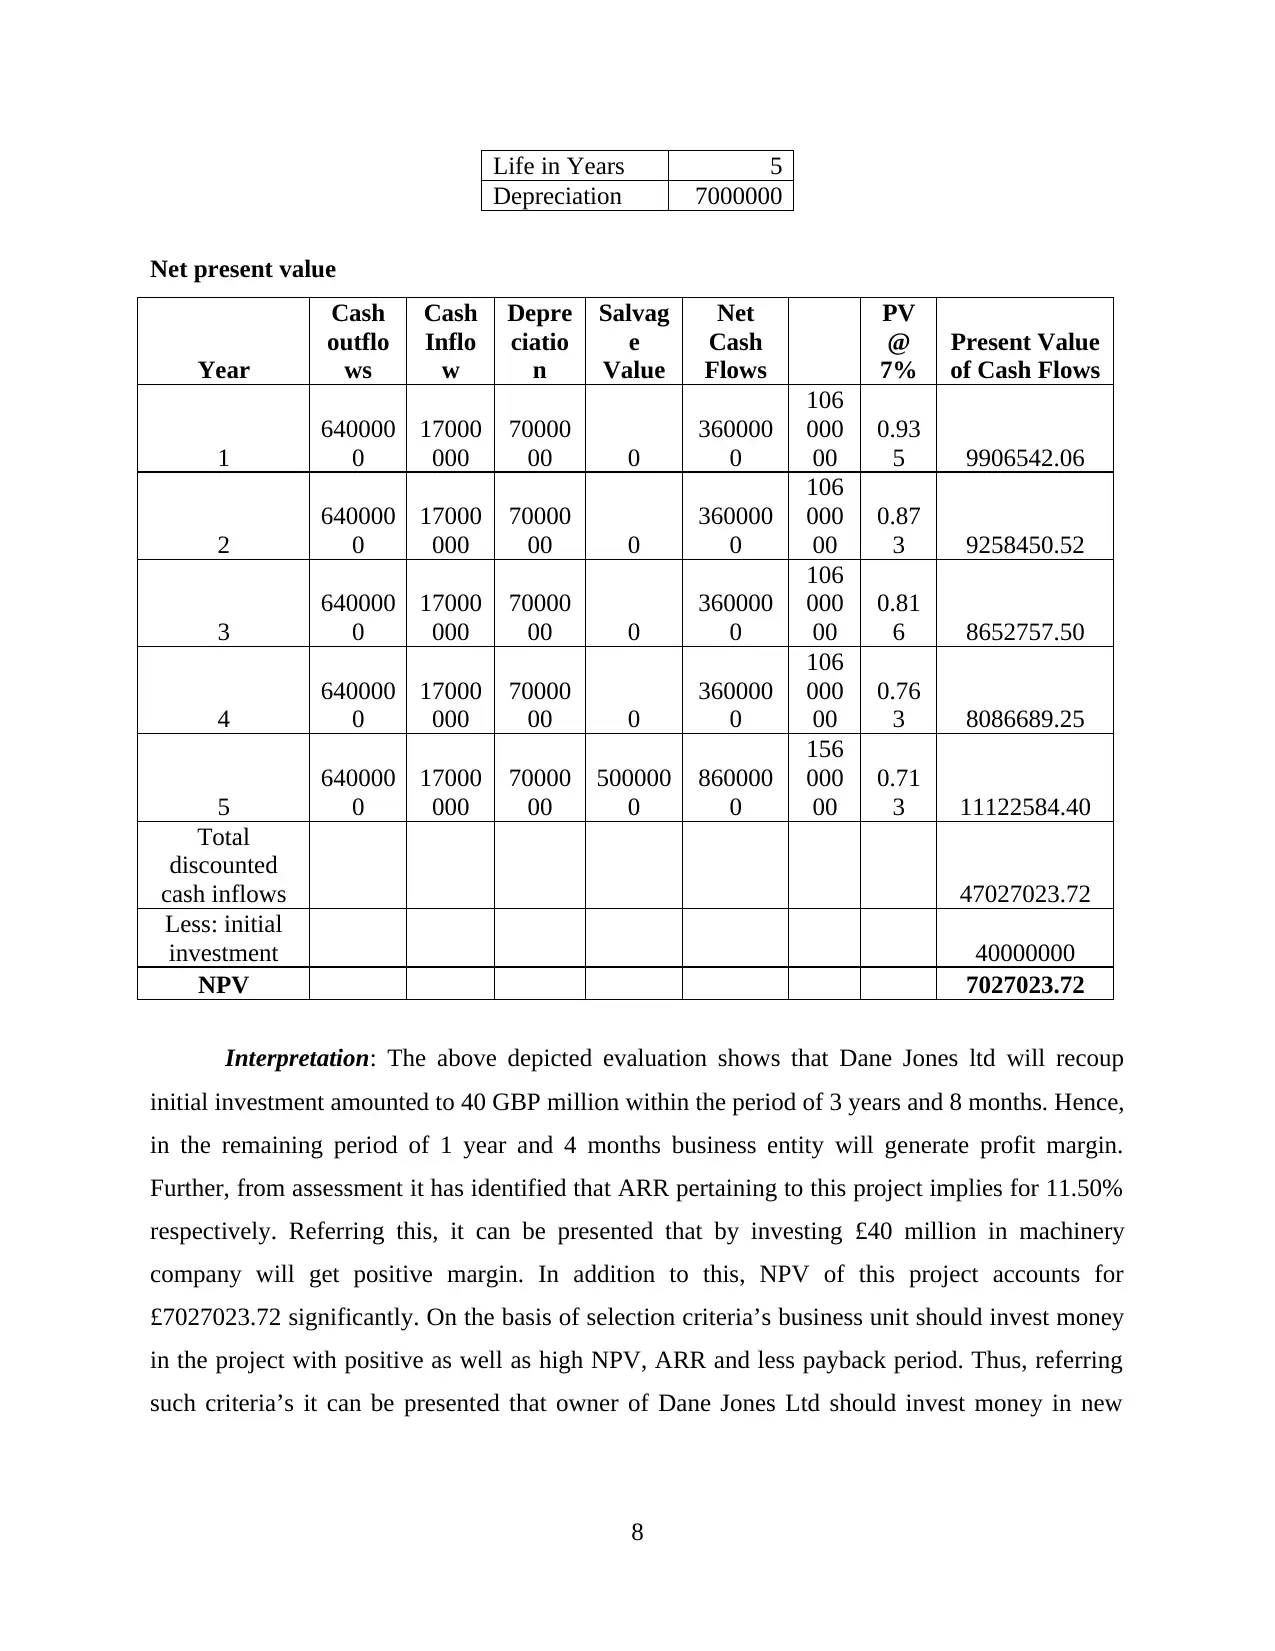
Life in Years 5
Depreciation 7000000
Net present value
Year
Cash
outflo
ws
Cash
Inflo
w
Depre
ciatio
n
Salvag
e
Value
Net
Cash
Flows
PV
@
7%
Present Value
of Cash Flows
1
640000
0
17000
000
70000
00 0
360000
0
106
000
00
0.93
5 9906542.06
2
640000
0
17000
000
70000
00 0
360000
0
106
000
00
0.87
3 9258450.52
3
640000
0
17000
000
70000
00 0
360000
0
106
000
00
0.81
6 8652757.50
4
640000
0
17000
000
70000
00 0
360000
0
106
000
00
0.76
3 8086689.25
5
640000
0
17000
000
70000
00
500000
0
860000
0
156
000
00
0.71
3 11122584.40
Total
discounted
cash inflows 47027023.72
Less: initial
investment 40000000
NPV 7027023.72
Interpretation: The above depicted evaluation shows that Dane Jones ltd will recoup
initial investment amounted to 40 GBP million within the period of 3 years and 8 months. Hence,
in the remaining period of 1 year and 4 months business entity will generate profit margin.
Further, from assessment it has identified that ARR pertaining to this project implies for 11.50%
respectively. Referring this, it can be presented that by investing £40 million in machinery
company will get positive margin. In addition to this, NPV of this project accounts for
£7027023.72 significantly. On the basis of selection criteria’s business unit should invest money
in the project with positive as well as high NPV, ARR and less payback period. Thus, referring
such criteria’s it can be presented that owner of Dane Jones Ltd should invest money in new
8
Paraphrase This Document
Need a fresh take? Get an instant paraphrase of this document with our AI Paraphraser
machinery. As, it will provide firm with positive and high returns which in turn makes
contribution in the achievement of organizational goals.
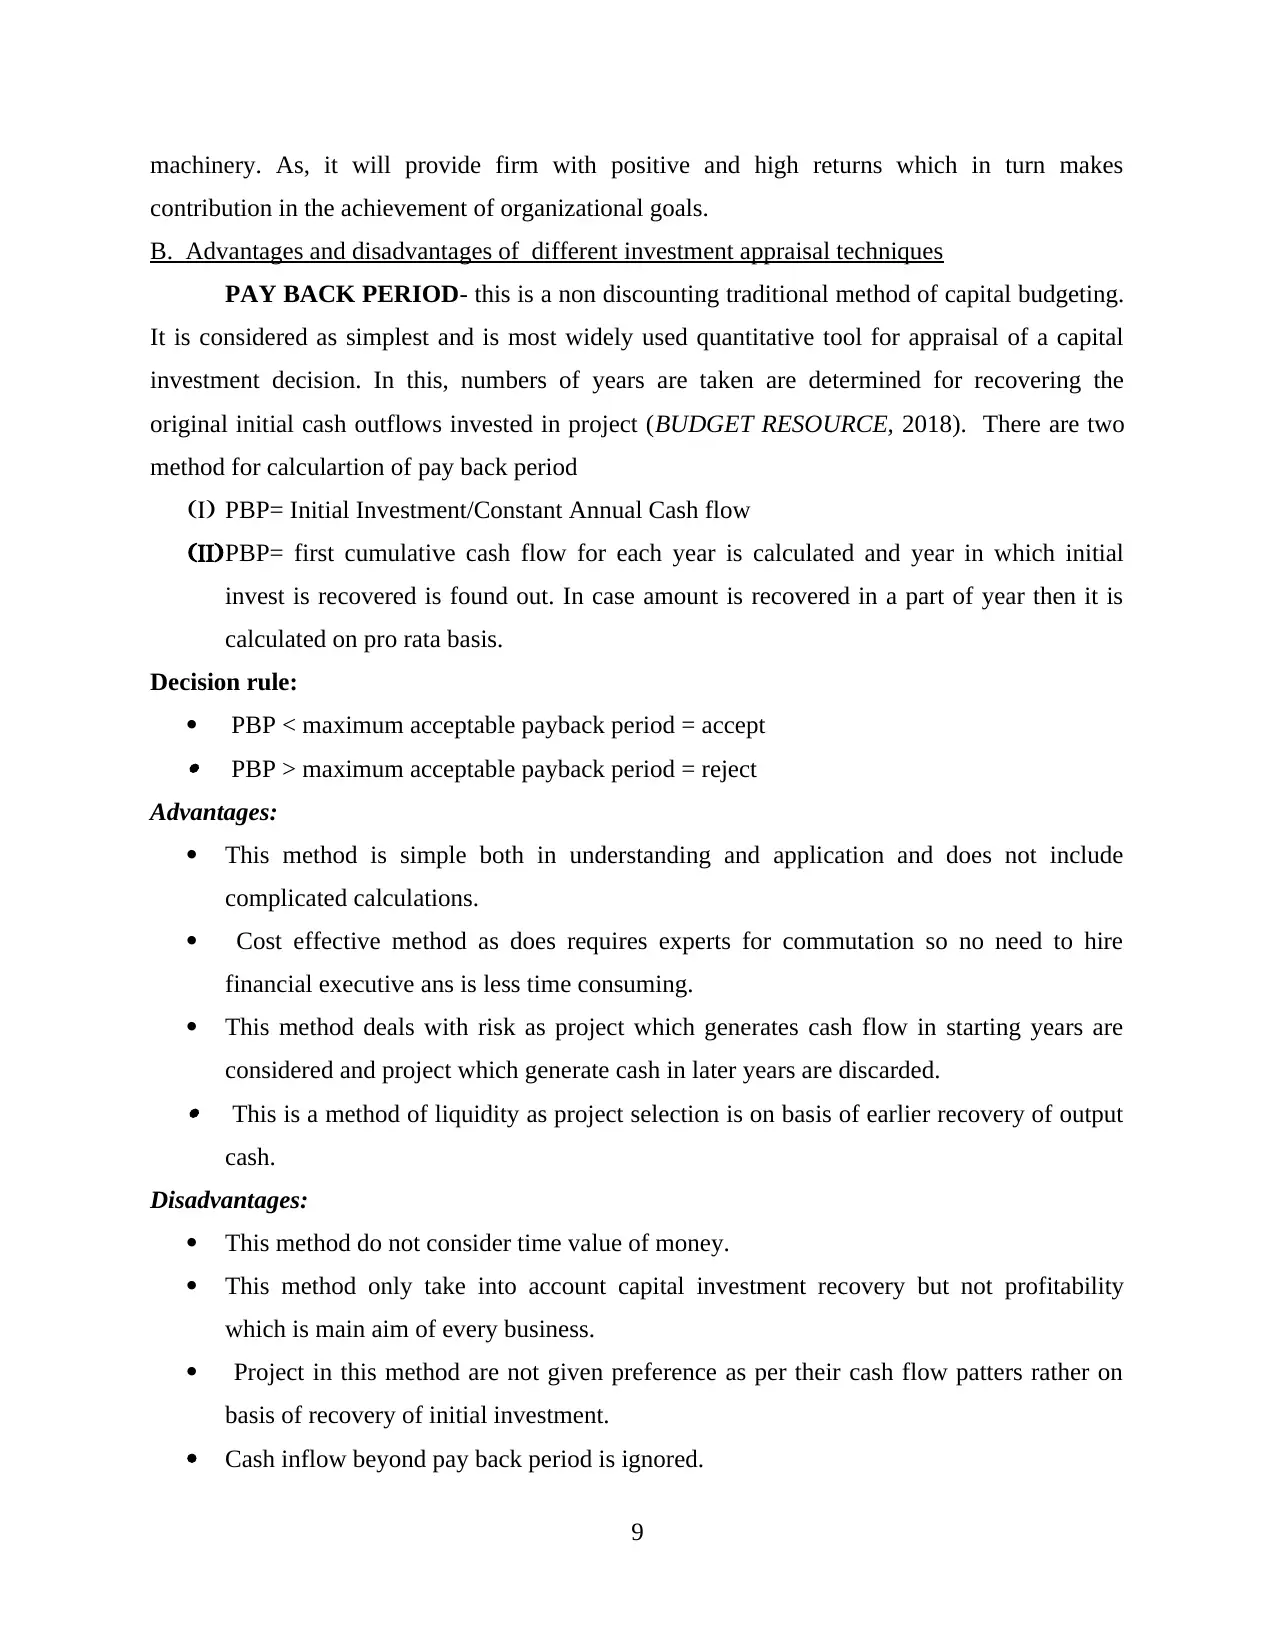
B. Advantages and disadvantages of different investment appraisal techniques
PAY BACK PERIOD- this is a non discounting traditional method of capital budgeting.
It is considered as simplest and is most widely used quantitative tool for appraisal of a capital
investment decision. In this, numbers of years are taken are determined for recovering the
original initial cash outflows invested in project (BUDGET RESOURCE, 2018). There are two
method for calculartion of pay back period
(I) PBP= Initial Investment/Constant Annual Cash flow
(II)PBP= first cumulative cash flow for each year is calculated and year in which initial
invest is recovered is found out. In case amount is recovered in a part of year then it is
calculated on pro rata basis.
Decision rule:
PBP < maximum acceptable payback period = accept PBP > maximum acceptable payback period = reject
Advantages:
This method is simple both in understanding and application and does not include
complicated calculations.
Cost effective method as does requires experts for commutation so no need to hire
financial executive ans is less time consuming.
This method deals with risk as project which generates cash flow in starting years are
considered and project which generate cash in later years are discarded. This is a method of liquidity as project selection is on basis of earlier recovery of output
cash.
Disadvantages:
This method do not consider time value of money.
This method only take into account capital investment recovery but not profitability
which is main aim of every business.
Project in this method are not given preference as per their cash flow patters rather on
basis of recovery of initial investment.
Cash inflow beyond pay back period is ignored.
9
contribution in the achievement of organizational goals.
B. Advantages and disadvantages of different investment appraisal techniques
PAY BACK PERIOD- this is a non discounting traditional method of capital budgeting.
It is considered as simplest and is most widely used quantitative tool for appraisal of a capital
investment decision. In this, numbers of years are taken are determined for recovering the
original initial cash outflows invested in project (BUDGET RESOURCE, 2018). There are two
method for calculartion of pay back period
(I) PBP= Initial Investment/Constant Annual Cash flow
(II)PBP= first cumulative cash flow for each year is calculated and year in which initial
invest is recovered is found out. In case amount is recovered in a part of year then it is
calculated on pro rata basis.
Decision rule:
PBP < maximum acceptable payback period = accept PBP > maximum acceptable payback period = reject
Advantages:
This method is simple both in understanding and application and does not include
complicated calculations.
Cost effective method as does requires experts for commutation so no need to hire
financial executive ans is less time consuming.
This method deals with risk as project which generates cash flow in starting years are
considered and project which generate cash in later years are discarded. This is a method of liquidity as project selection is on basis of earlier recovery of output
cash.
Disadvantages:
This method do not consider time value of money.
This method only take into account capital investment recovery but not profitability
which is main aim of every business.
Project in this method are not given preference as per their cash flow patters rather on
basis of recovery of initial investment.
Cash inflow beyond pay back period is ignored.
9
NET PRESENT VALUE- this is a discounting cash flow or time adjustment technique. In this
method, present value of future cash flow is considered. Recognition of cash flows at different
time period is done in this method.
The NPV can be calculated with the help of equation:-
NPV = Present value of cash inflows – Initial investment
Decision Rule:
If the,
NPV >0, accept the project.
NPV < 0, reject the project.
Advantages:
In this method the time value of money is recognized.
Cash flows of all years are considered over its useful life.
It is an independent measurement of profits earned ion a project.
This is the only method which fulfill the value-additive principle. Outputs are calculated
on absolute terms, and NPV of projects can be added to reach a decision. This method is consistent with wealth maximization goal of shareholders.
Disadvantages:
Estimation cash flow is required in this method which is a difficult task due to
involvement of uncertainties related with business environment.
While valuation of project is carried out contingencies are not fully considered in this
method.
The value of exploring other option is ignored in this method.
In case of mutually exclusive projects, reasonable results are not found as projects have
unequal life, different cash flows, outflows.
Calculation under this method are complicated as discounted cash flows are determined
on given rate of return. The rate must be taken same as different rate will give changed
result (Sunder, Sunder and Zhang, 2018).
AVERAGE RATE OF RETURN- this is also known as return on investment(ROI), return on
capital employed (ROEC) and considers accounting information rather than cash flows.
Calculation under this is done as:
ARR= Average annual profits after tax * 100
10
⊘ This is a preview!⊘
Do you want full access?
Subscribe today to unlock all pages.
Trusted by 1+ million students worldwide
1 out of 17
Related Documents


Your All-in-One AI-Powered Toolkit for Academic Success.
+13062052269
info@desklib.com
Available 24*7 on WhatsApp / Email
![[object Object]](/_next/static/media/star-bottom.7253800d.svg)
Unlock your academic potential
Copyright © 2020–2026 A2Z Services. All Rights Reserved. Developed and managed by ZUCOL.