Analyzing Financial and Non-Financial Performance: Next Plc & H&M
VerifiedAdded on 2020/01/28
|13
|2965
|155
Report
AI Summary
This report presents a comprehensive financial analysis of Next Plc and H&M, evaluating their performance using profitability and efficiency ratios. It compares their financial strengths and weaknesses, offering recommendations for improvement. The report also delves into investment appraisal techniques, including payback period, net present value (NPV), and average rate of return (ARR), to aid in making sound investment decisions. The analysis covers the cash inflows of different projects, calculates the payback period, and determines the NPV and ARR to assess the viability of investment options. Furthermore, the report acknowledges the limitations of financial ratios and investment appraisal techniques, providing a balanced perspective on their application in financial analysis and decision-making.

Accounting and Finance
1
1
Paraphrase This Document
Need a fresh take? Get an instant paraphrase of this document with our AI Paraphraser

Table of Contents
INTRODUCTION ...............................................................................................................................3
Question 1.............................................................................................................................................3
1. Analyzing financial and non-financial performance of Next Plc and H&M...............................3
2. Using charts to compare the performance of two companies .....................................................5
3. Recommending the ways through which Next plc and H&M can improve its financial
performance ....................................................................................................................................7
4. Stating the limitations of financial ratios.....................................................................................7
Question 2.............................................................................................................................................8
1. Using investment appraisal techniques for making the best investment decisions.....................8
Cash inflow of project 2...................................................................................................................8
2. Stating the limitations of investment appraisal techniques........................................................10
CONCLUSION..................................................................................................................................10
References..........................................................................................................................................12
2
INTRODUCTION
Accounting is the main part of finance which provides deeper insight to the manager about
the monetary transaction which are made by them during the accounting year. By making thorough
analysis of such aspects finance manager can make strategic decisions (Gitman, 2013). Further,
investment appraisal techniques are also the most effectual tool which helps manager in making
suitable investment decision which aid in the growth and profitability of it. This report is based on
the different case scenarios. The present report will shed light on the financial health and
performance of H&M and Next plc. It will also describe the extent to which capital budgeting tool
helps Hilltop Ltd. In making best investment decisions.
QUESTION 1
1. Analyzing financial and non-financial performance of Next Plc and H&M
Financial ratios: It refers to those which helps in evaluating the financial health, position and
performance of the enterprise are as follows:
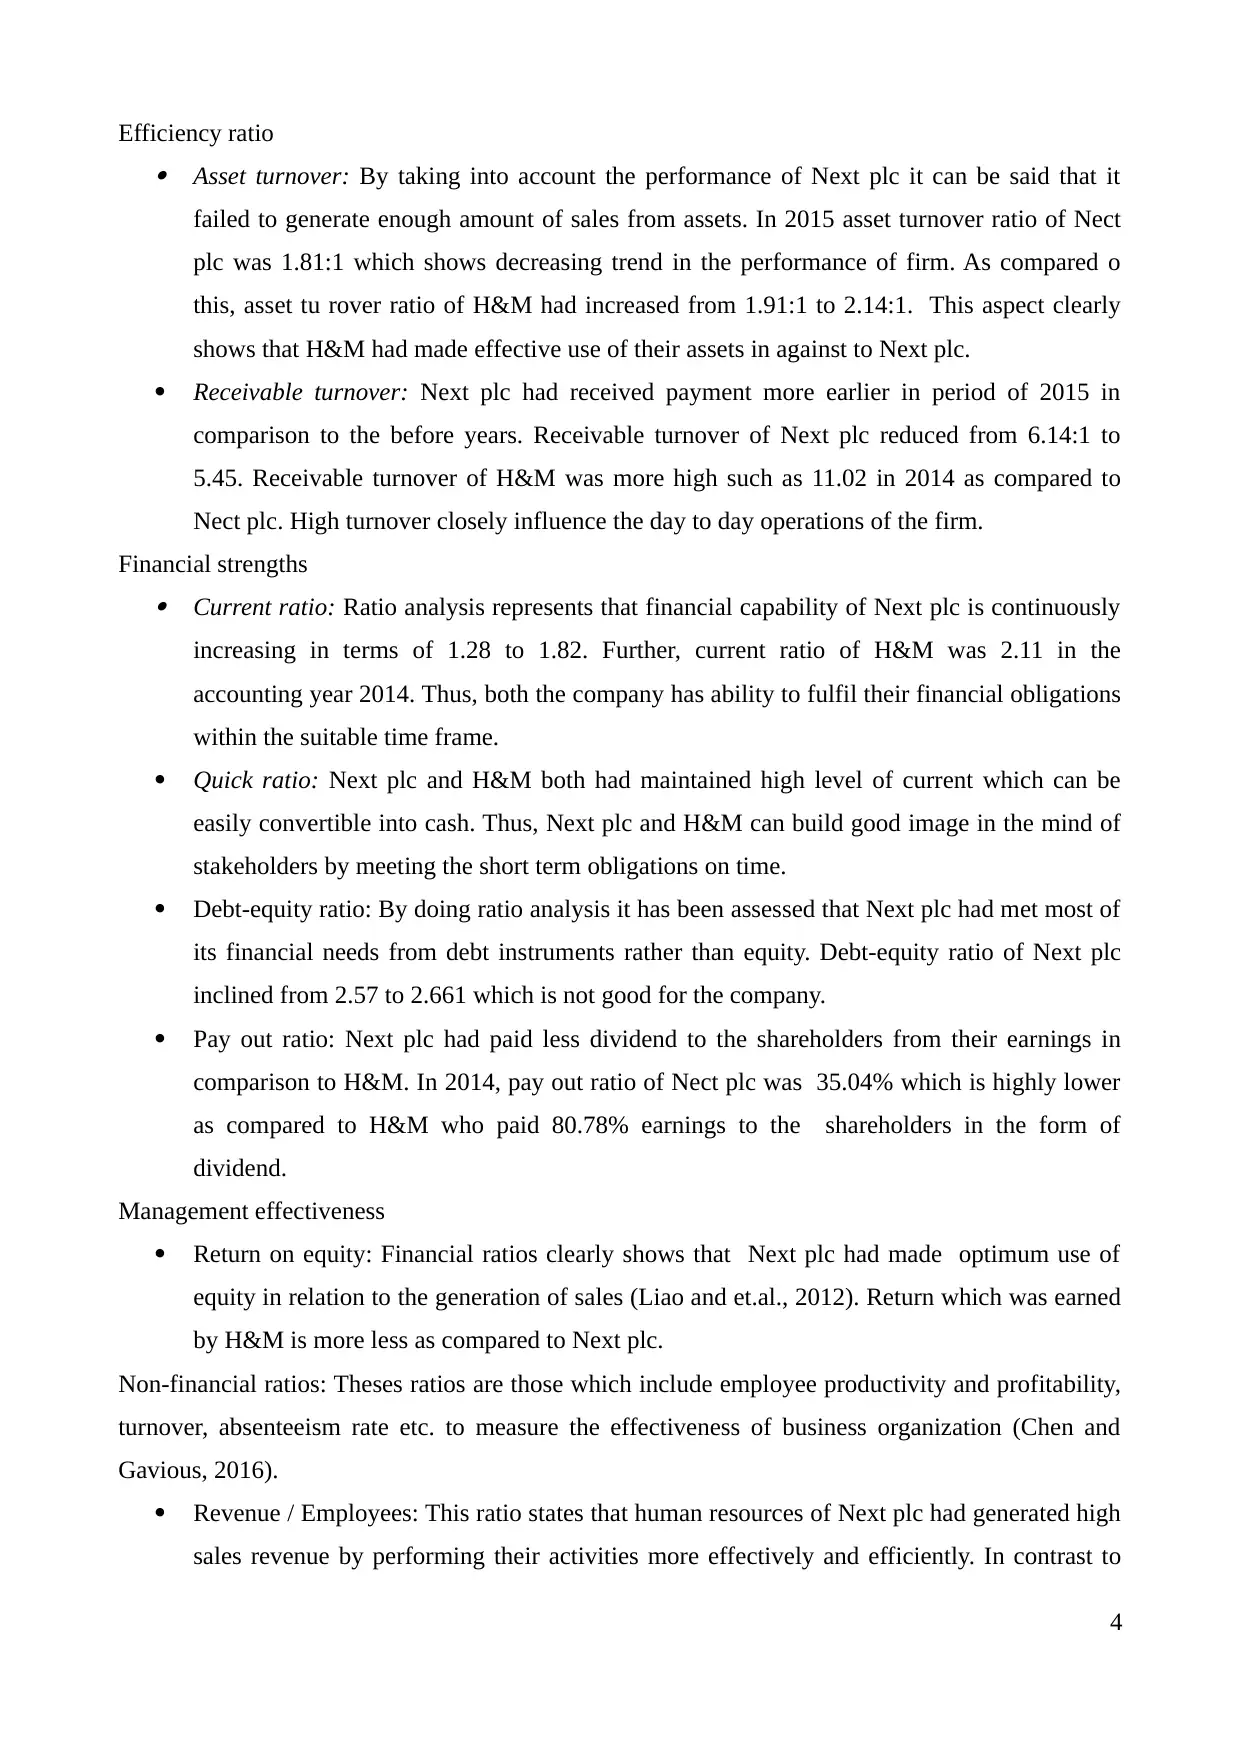
Profitability ratios Gross profit margin: In 2011 and 2012, gross profitability of Next plc was 29.27% &
30.38%. Whereas in 2015, GP ratio of the firm was 33.59% which shows that gross margin
of the business unit is get inclined. In comparison to Next plc, gross profitability of H&M
had reduced from 2010 to 2014 in terms of 62.93% to 58.81%. Thus , it can be said that
H&M failed to generate high amount of sales over the expenses in 2015 as compared to
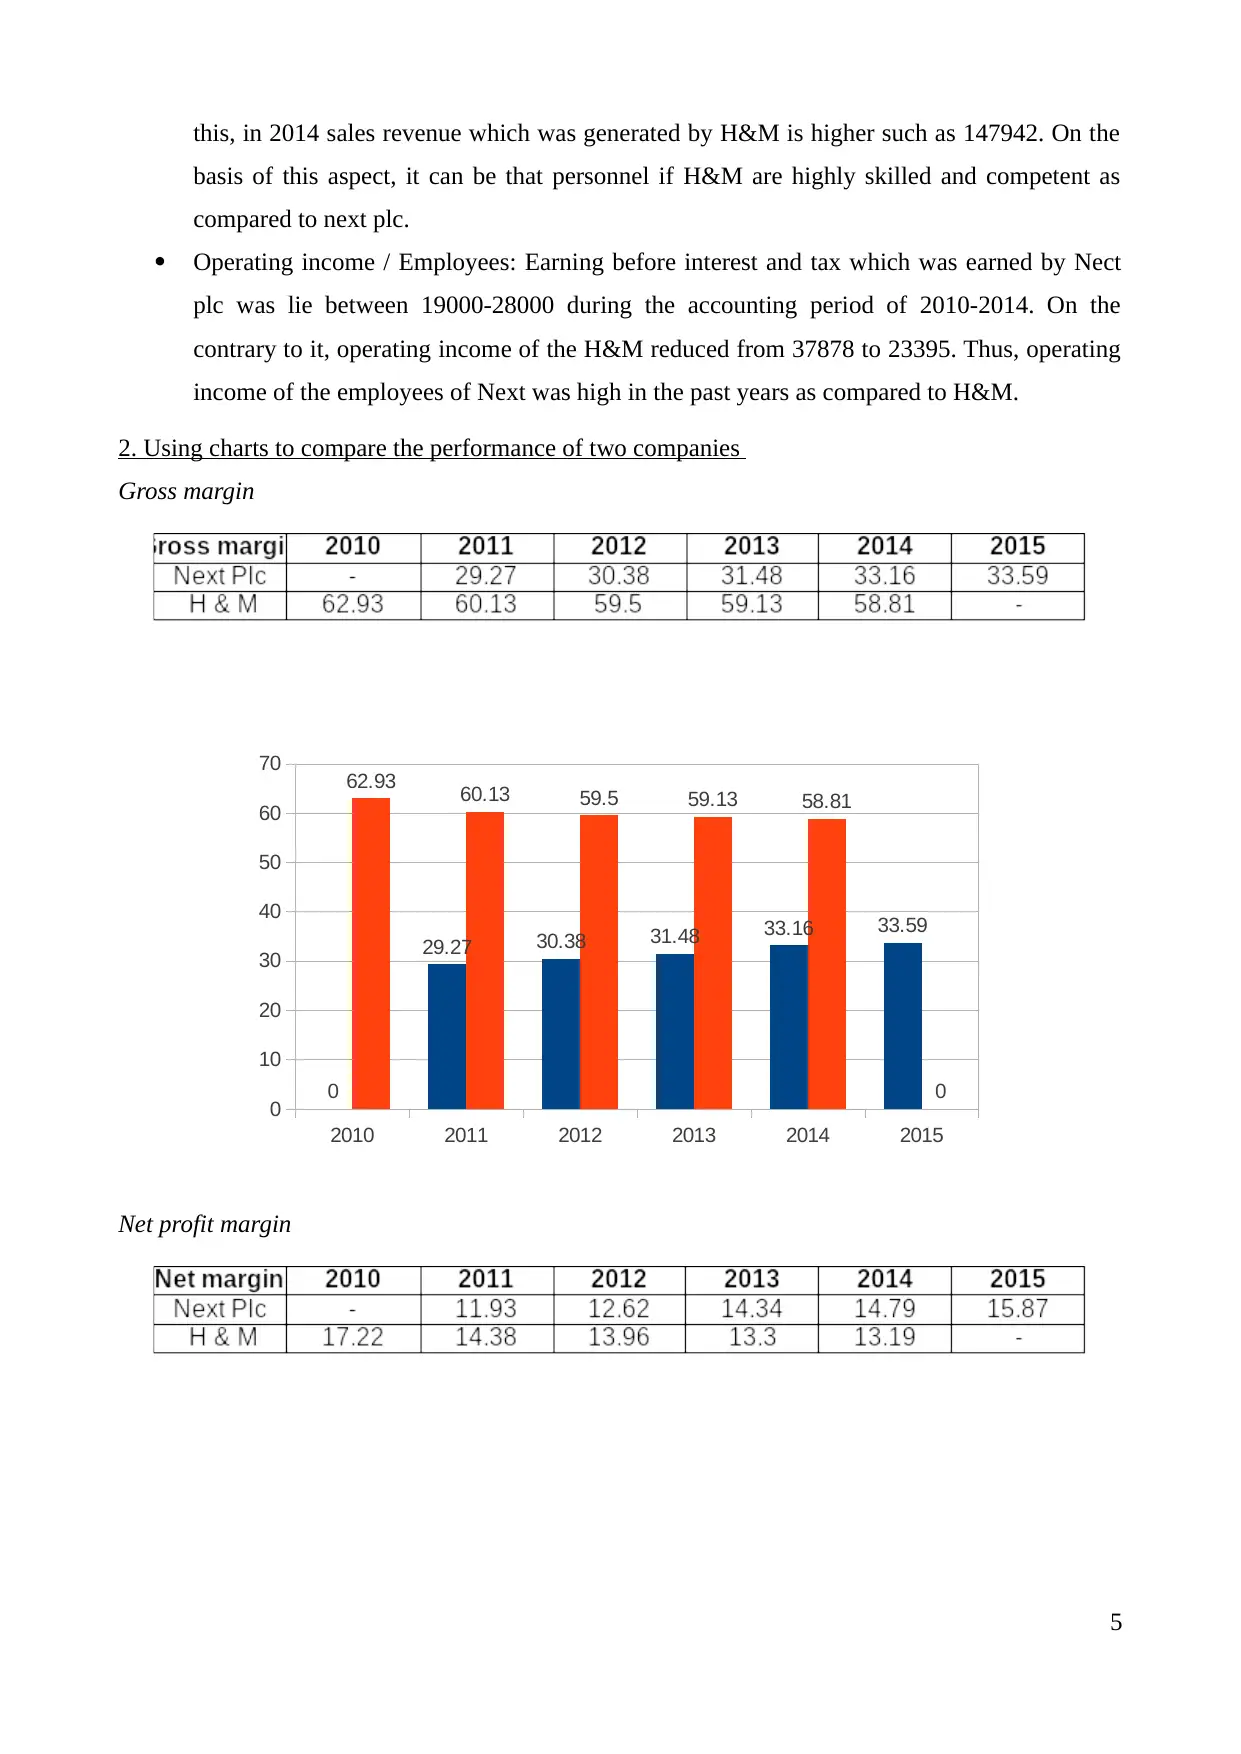
Next plc. Net profit margin: This measure provides deeper insight about the profit which is generated
by them during the year after paying the tax amount. Net profit margin of Next Plc was
increased from 11.93% to 15.87%. This, profit margin of the firm increased in last five
years. Whereas, net profit margin of H&M showed declining trend in the performance. In
2010 NP ratio of H&M was 17.22% and it reached on 13.19%. Low sales may be cause of
declining trend in the net profitability of the business unit.
COGS /Revenue: It represents the revenue which is generated by the firm by incurring the
indirect expenses. During the financial year 2011, this ratio of Nest plc was 69.62%,
whereas COGS/revenue percentage of H&M is 39.87%. This ratio of H&M was increased
from 37.047% to 41.19%. On the contrary to it, in 2015 COGS /Revenue of Next plc was
66.41%. By referring this aspect it can be said that sales revenue of Nect plc had decreased
over the past years.
3
Accounting is the main part of finance which provides deeper insight to the manager about
the monetary transaction which are made by them during the accounting year. By making thorough
analysis of such aspects finance manager can make strategic decisions (Gitman, 2013). Further,
investment appraisal techniques are also the most effectual tool which helps manager in making
suitable investment decision which aid in the growth and profitability of it. This report is based on
the different case scenarios. The present report will shed light on the financial health and
performance of H&M and Next plc. It will also describe the extent to which capital budgeting tool
helps Hilltop Ltd. In making best investment decisions.
QUESTION 1
1. Analyzing financial and non-financial performance of Next Plc and H&M
Financial ratios: It refers to those which helps in evaluating the financial health, position and
performance of the enterprise are as follows:
Profitability ratios Gross profit margin: In 2011 and 2012, gross profitability of Next plc was 29.27% &
30.38%. Whereas in 2015, GP ratio of the firm was 33.59% which shows that gross margin
of the business unit is get inclined. In comparison to Next plc, gross profitability of H&M
had reduced from 2010 to 2014 in terms of 62.93% to 58.81%. Thus , it can be said that
H&M failed to generate high amount of sales over the expenses in 2015 as compared to
Next plc. Net profit margin: This measure provides deeper insight about the profit which is generated
by them during the year after paying the tax amount. Net profit margin of Next Plc was
increased from 11.93% to 15.87%. This, profit margin of the firm increased in last five
years. Whereas, net profit margin of H&M showed declining trend in the performance. In
2010 NP ratio of H&M was 17.22% and it reached on 13.19%. Low sales may be cause of
declining trend in the net profitability of the business unit.
COGS /Revenue: It represents the revenue which is generated by the firm by incurring the
indirect expenses. During the financial year 2011, this ratio of Nest plc was 69.62%,
whereas COGS/revenue percentage of H&M is 39.87%. This ratio of H&M was increased
from 37.047% to 41.19%. On the contrary to it, in 2015 COGS /Revenue of Next plc was
66.41%. By referring this aspect it can be said that sales revenue of Nect plc had decreased
over the past years.
3
⊘ This is a preview!⊘
Do you want full access?
Subscribe today to unlock all pages.
Trusted by 1+ million students worldwide
Efficiency ratio Asset turnover: By taking into account the performance of Next plc it can be said that it
failed to generate enough amount of sales from assets. In 2015 asset turnover ratio of Nect
plc was 1.81:1 which shows decreasing trend in the performance of firm. As compared o
this, asset tu rover ratio of H&M had increased from 1.91:1 to 2.14:1. This aspect clearly
shows that H&M had made effective use of their assets in against to Next plc.
Receivable turnover: Next plc had received payment more earlier in period of 2015 in
comparison to the before years. Receivable turnover of Next plc reduced from 6.14:1 to
5.45. Receivable turnover of H&M was more high such as 11.02 in 2014 as compared to
Nect plc. High turnover closely influence the day to day operations of the firm.
Financial strengths Current ratio: Ratio analysis represents that financial capability of Next plc is continuously
increasing in terms of 1.28 to 1.82. Further, current ratio of H&M was 2.11 in the
accounting year 2014. Thus, both the company has ability to fulfil their financial obligations
within the suitable time frame.
Quick ratio: Next plc and H&M both had maintained high level of current which can be
easily convertible into cash. Thus, Next plc and H&M can build good image in the mind of
stakeholders by meeting the short term obligations on time.
Debt-equity ratio: By doing ratio analysis it has been assessed that Next plc had met most of
its financial needs from debt instruments rather than equity. Debt-equity ratio of Next plc
inclined from 2.57 to 2.661 which is not good for the company.
Pay out ratio: Next plc had paid less dividend to the shareholders from their earnings in
comparison to H&M. In 2014, pay out ratio of Nect plc was 35.04% which is highly lower
as compared to H&M who paid 80.78% earnings to the shareholders in the form of
dividend.
Management effectiveness
Return on equity: Financial ratios clearly shows that Next plc had made optimum use of
equity in relation to the generation of sales (Liao and et.al., 2012). Return which was earned
by H&M is more less as compared to Next plc.
Non-financial ratios: Theses ratios are those which include employee productivity and profitability,
turnover, absenteeism rate etc. to measure the effectiveness of business organization (Chen and
Gavious, 2016).
Revenue / Employees: This ratio states that human resources of Next plc had generated high
sales revenue by performing their activities more effectively and efficiently. In contrast to
4
Paraphrase This Document
Need a fresh take? Get an instant paraphrase of this document with our AI Paraphraser
this, in 2014 sales revenue which was generated by H&M is higher such as 147942. On the
basis of this aspect, it can be that personnel if H&M are highly skilled and competent as
compared to next plc.
Operating income / Employees: Earning before interest and tax which was earned by Nect
plc was lie between 19000-28000 during the accounting period of 2010-2014. On the
contrary to it, operating income of the H&M reduced from 37878 to 23395. Thus, operating
income of the employees of Next was high in the past years as compared to H&M.
2. Using charts to compare the performance of two companies
Gross margin
Net profit margin
5
2010 2011 2012 2013 2014 2015
0
10
20
30
40
50
60
70
0
29.27 30.38 31.48 33.16 33.59
62.93 60.13 59.5 59.13 58.81
0
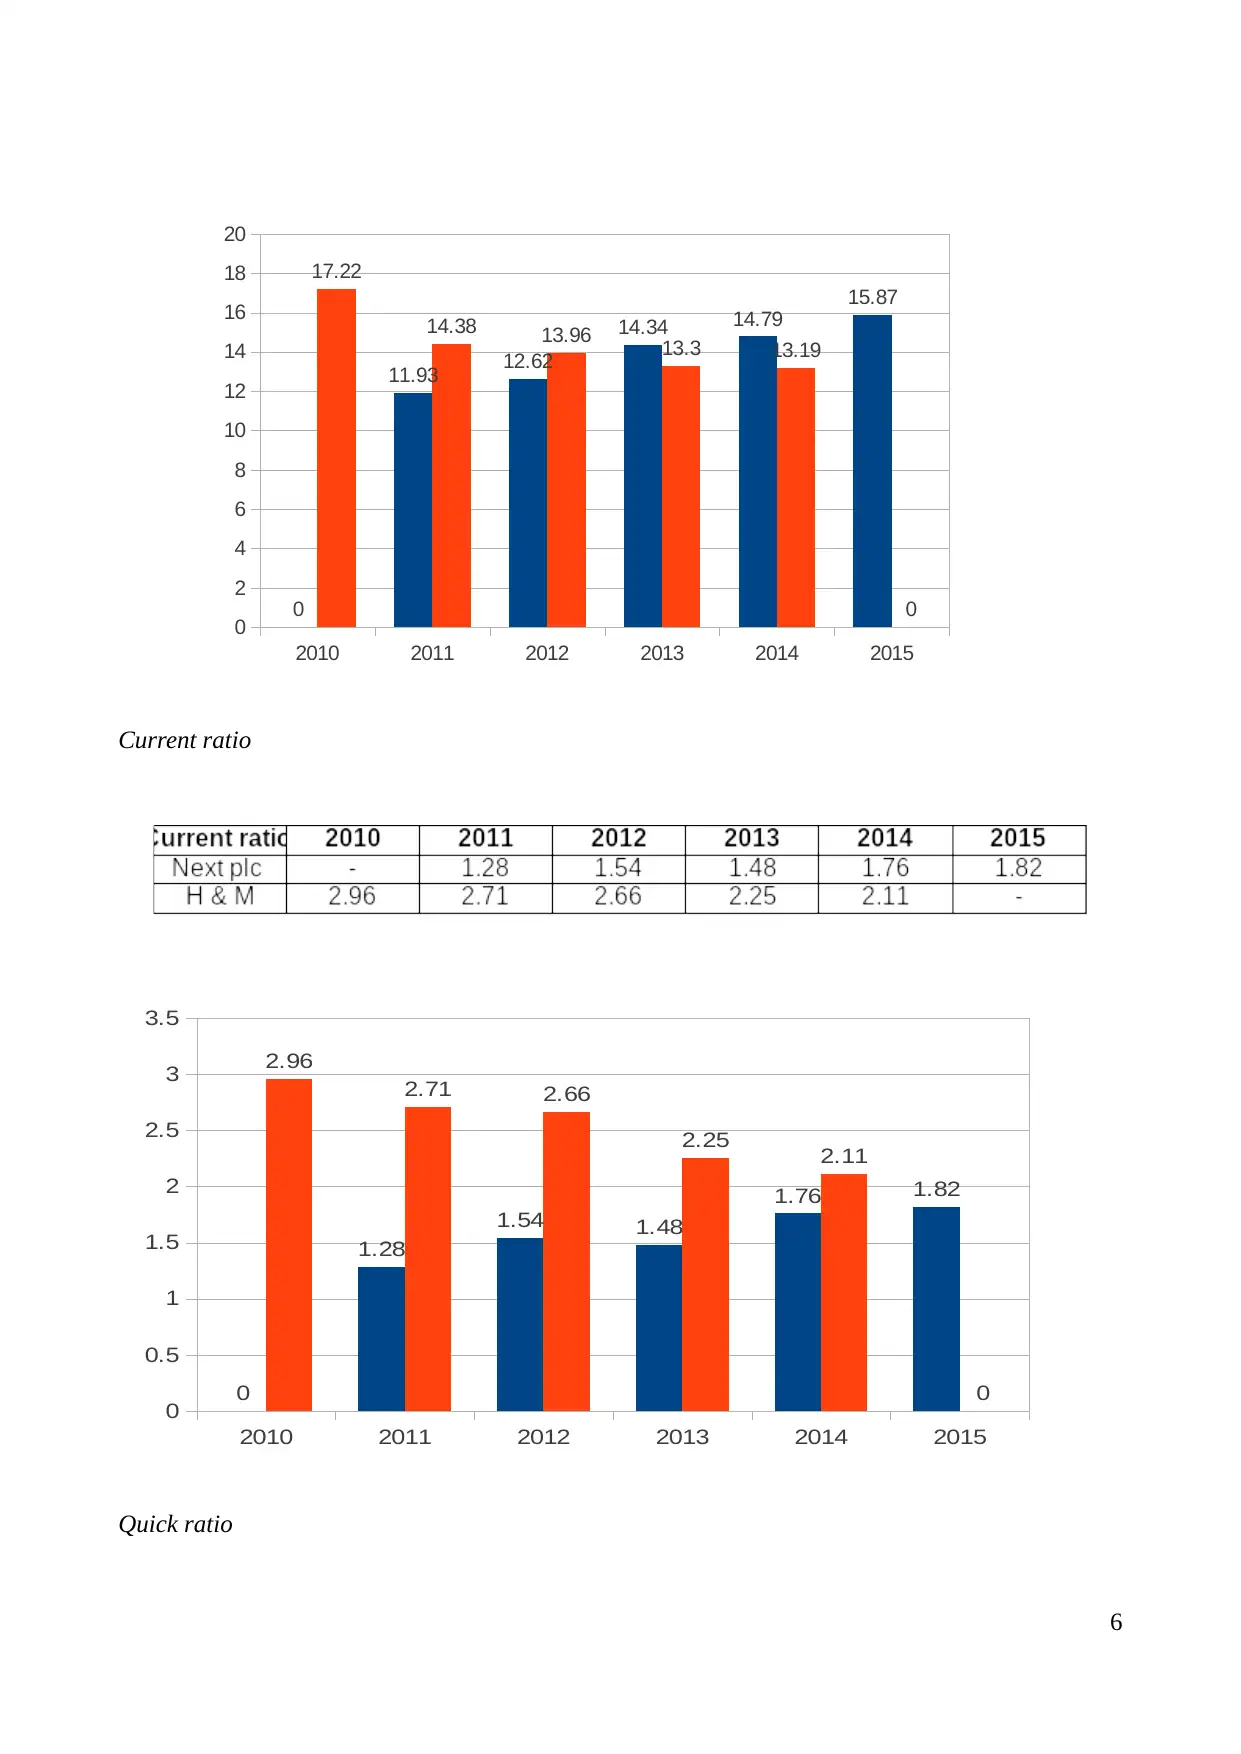
Current ratio
Quick ratio
6
2010 2011 2012 2013 2014 2015
0
2
4
6
8
10
12
14
16
18
20
0
11.93 12.62
14.34 14.79
15.87
17.22
14.38 13.96 13.3 13.19
0
2010 2011 2012 2013 2014 2015
0
0.5
1
1.5
2
2.5
3
3.5
0
1.28
1.54 1.48
1.76 1.82
2.96
2.71 2.66
2.25 2.11
0
Quick ratio
6
2010 2011 2012 2013 2014 2015
0
2
4
6
8
10
12
14
16
18
20
0
11.93 12.62
14.34 14.79
15.87
17.22
14.38 13.96 13.3 13.19
0
2010 2011 2012 2013 2014 2015
0
0.5
1
1.5
2
2.5
3
3.5
0
1.28
1.54 1.48
1.76 1.82
2.96
2.71 2.66
2.25 2.11
0
⊘ This is a preview!⊘
Do you want full access?
Subscribe today to unlock all pages.
Trusted by 1+ million students worldwide
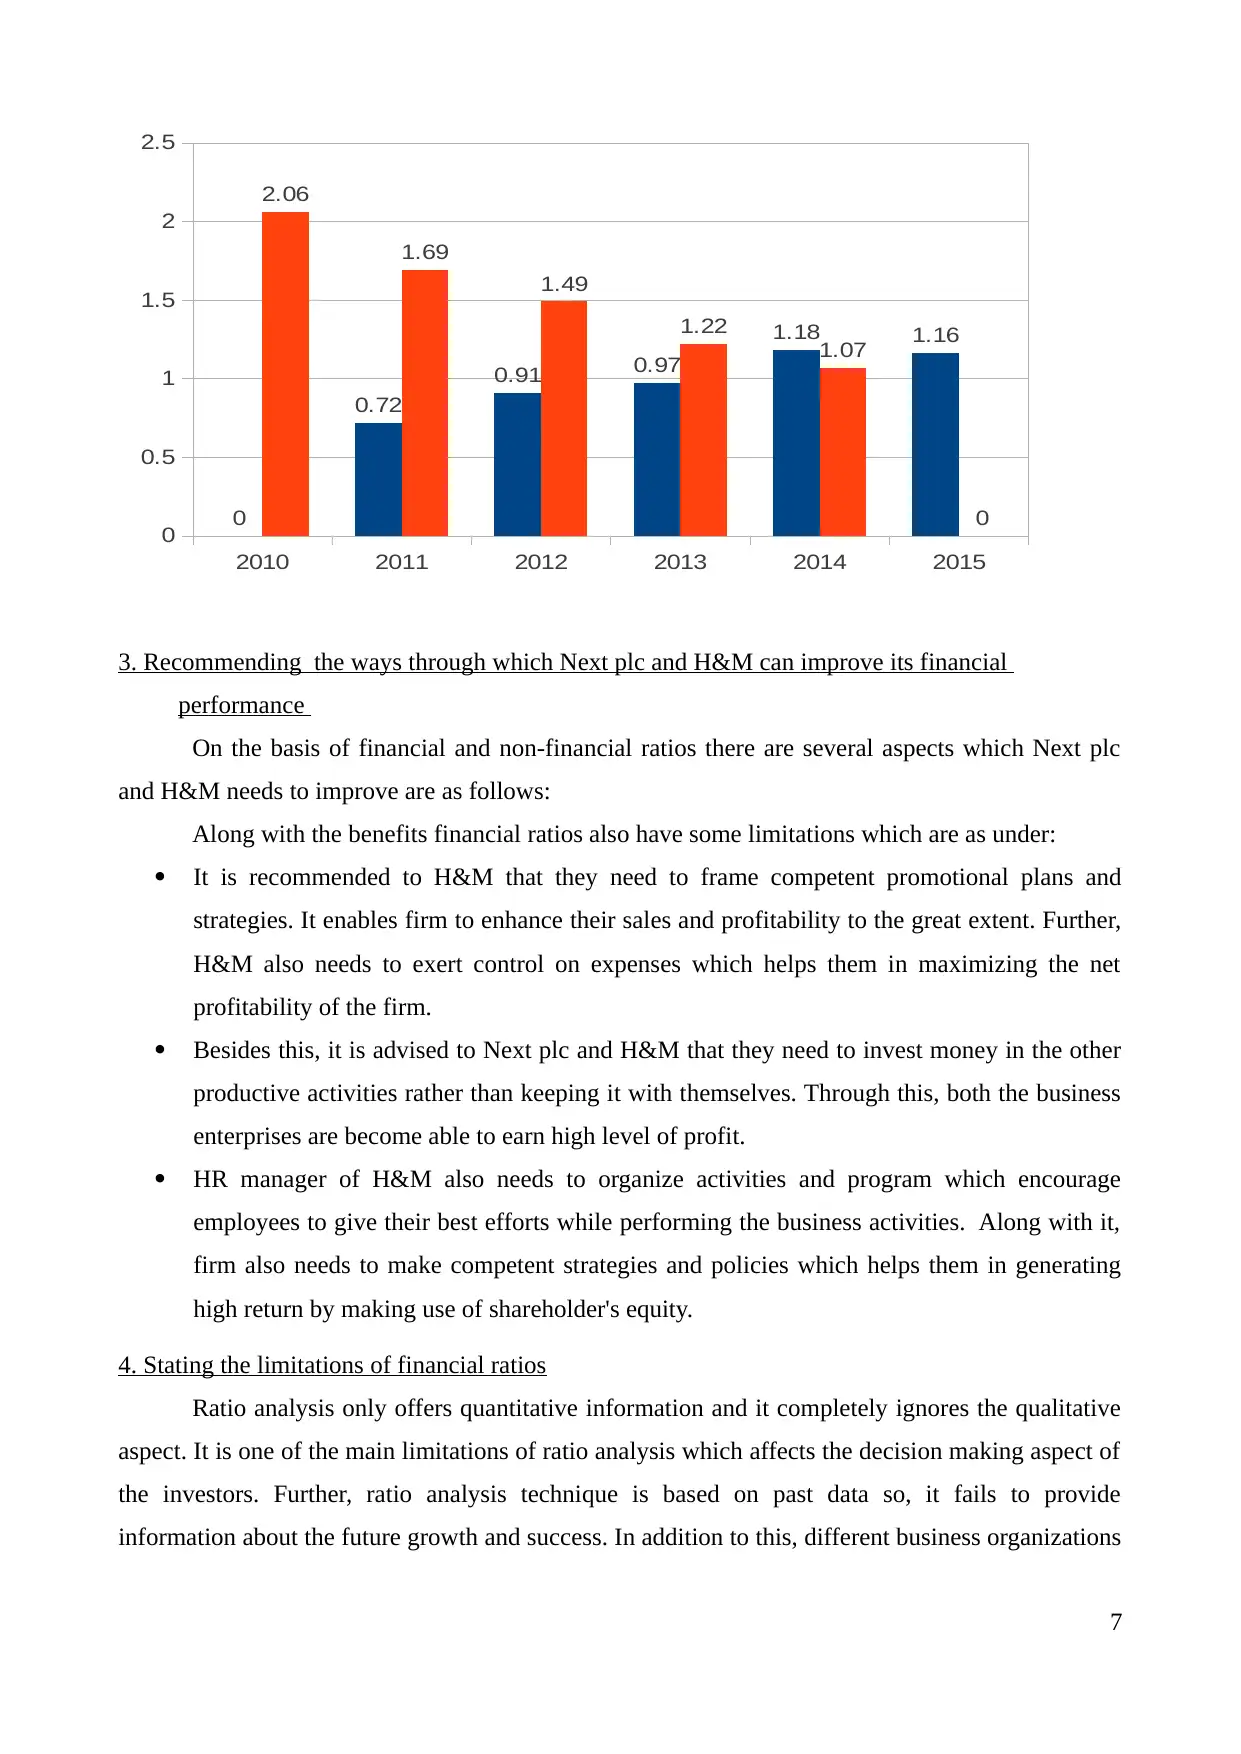
3. Recommending the ways through which Next plc and H&M can improve its financial
performance
On the basis of financial and non-financial ratios there are several aspects which Next plc
and H&M needs to improve are as follows:
Along with the benefits financial ratios also have some limitations which are as under:
It is recommended to H&M that they need to frame competent promotional plans and
strategies. It enables firm to enhance their sales and profitability to the great extent. Further,
H&M also needs to exert control on expenses which helps them in maximizing the net
profitability of the firm.
Besides this, it is advised to Next plc and H&M that they need to invest money in the other
productive activities rather than keeping it with themselves. Through this, both the business
enterprises are become able to earn high level of profit.
HR manager of H&M also needs to organize activities and program which encourage
employees to give their best efforts while performing the business activities. Along with it,
firm also needs to make competent strategies and policies which helps them in generating
high return by making use of shareholder's equity.
4. Stating the limitations of financial ratios
Ratio analysis only offers quantitative information and it completely ignores the qualitative
aspect. It is one of the main limitations of ratio analysis which affects the decision making aspect of
the investors. Further, ratio analysis technique is based on past data so, it fails to provide
information about the future growth and success. In addition to this, different business organizations
7
2010 2011 2012 2013 2014 2015
0
0.5
1
1.5
2
2.5
0
0.72
0.91 0.97
1.18 1.16
2.06
1.69
1.49
1.22
1.07
0
Paraphrase This Document
Need a fresh take? Get an instant paraphrase of this document with our AI Paraphraser
follow varied accounting rules and principles while framing the financial statements for firm
(Kumbirai and Webb, 2013). In this, it is highly difficult for the business unit to make comparison
of the financial performance of one firm with another. Varied environmental condition and market
structure also have high level of influence on the financial performance of firm. Further, economic
condition such as inflation or deflation is also affects the financials of the business enterprise
(Limitations of ratio analysis, 2013). Moreover, economic conditions are not remains same in each
year. Strategies which are employed by the manager also differs from business to business (Karande
and Chakraborty, 2012). Thus, all these aspects negatively hampers the significance of ration
analysis to some extent.
QUESTION 2
1. Using investment appraisal techniques for making the best investment decisions
Capital budgeting or investment appraisal tools include payback period, net present value
and average rate of return method which helps manager in assessing the profitability of project
(Dellavigna and Pollet, 2013). These tools and techniques assist investment manager of Hilltop Ltd.
in the selection of project which offers high return to them.
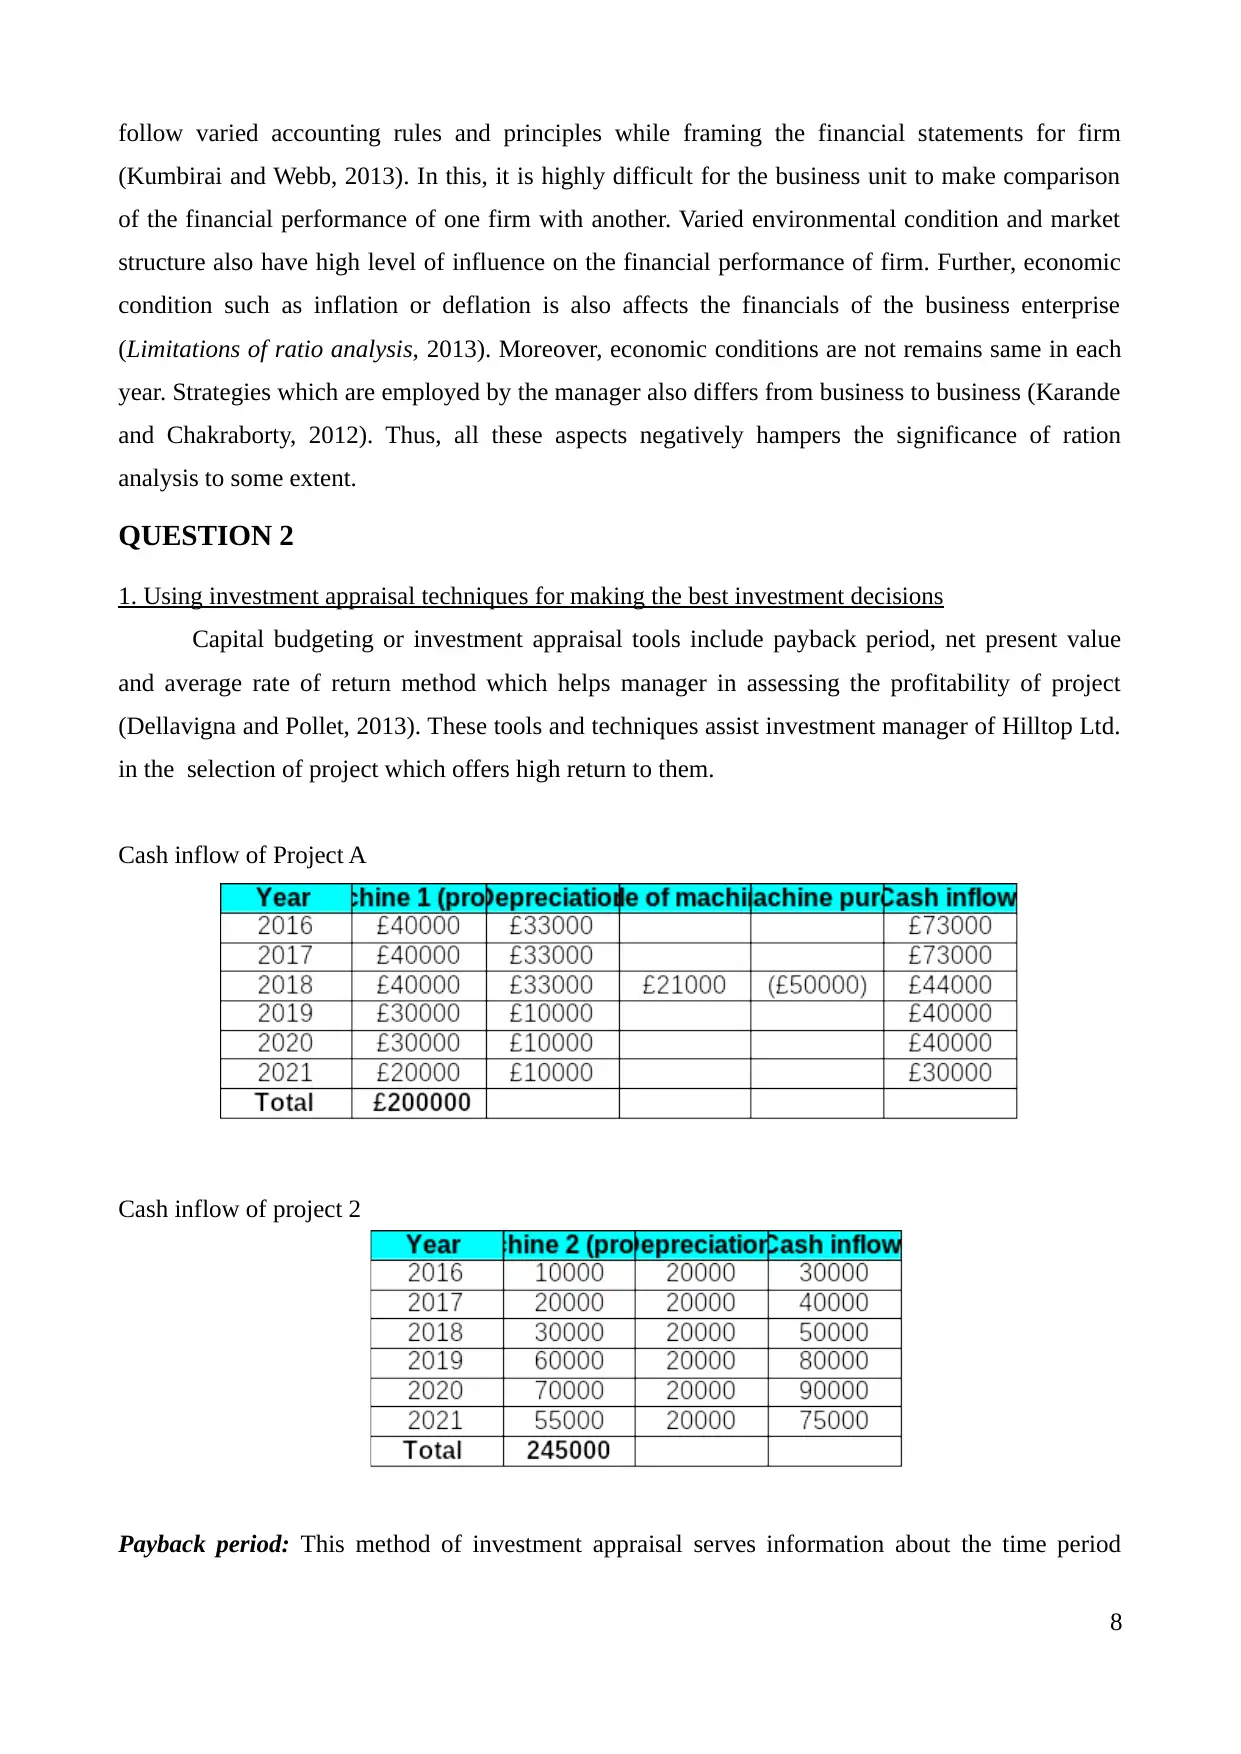
Cash inflow of Project A
Cash inflow of project 2
Payback period: This method of investment appraisal serves information about the time period
8
(Kumbirai and Webb, 2013). In this, it is highly difficult for the business unit to make comparison
of the financial performance of one firm with another. Varied environmental condition and market
structure also have high level of influence on the financial performance of firm. Further, economic
condition such as inflation or deflation is also affects the financials of the business enterprise
(Limitations of ratio analysis, 2013). Moreover, economic conditions are not remains same in each
year. Strategies which are employed by the manager also differs from business to business (Karande
and Chakraborty, 2012). Thus, all these aspects negatively hampers the significance of ration
analysis to some extent.
QUESTION 2
1. Using investment appraisal techniques for making the best investment decisions
Capital budgeting or investment appraisal tools include payback period, net present value
and average rate of return method which helps manager in assessing the profitability of project
(Dellavigna and Pollet, 2013). These tools and techniques assist investment manager of Hilltop Ltd.
in the selection of project which offers high return to them.
Cash inflow of Project A
Cash inflow of project 2
Payback period: This method of investment appraisal serves information about the time period
8
within which business organization can recover its initial investment.
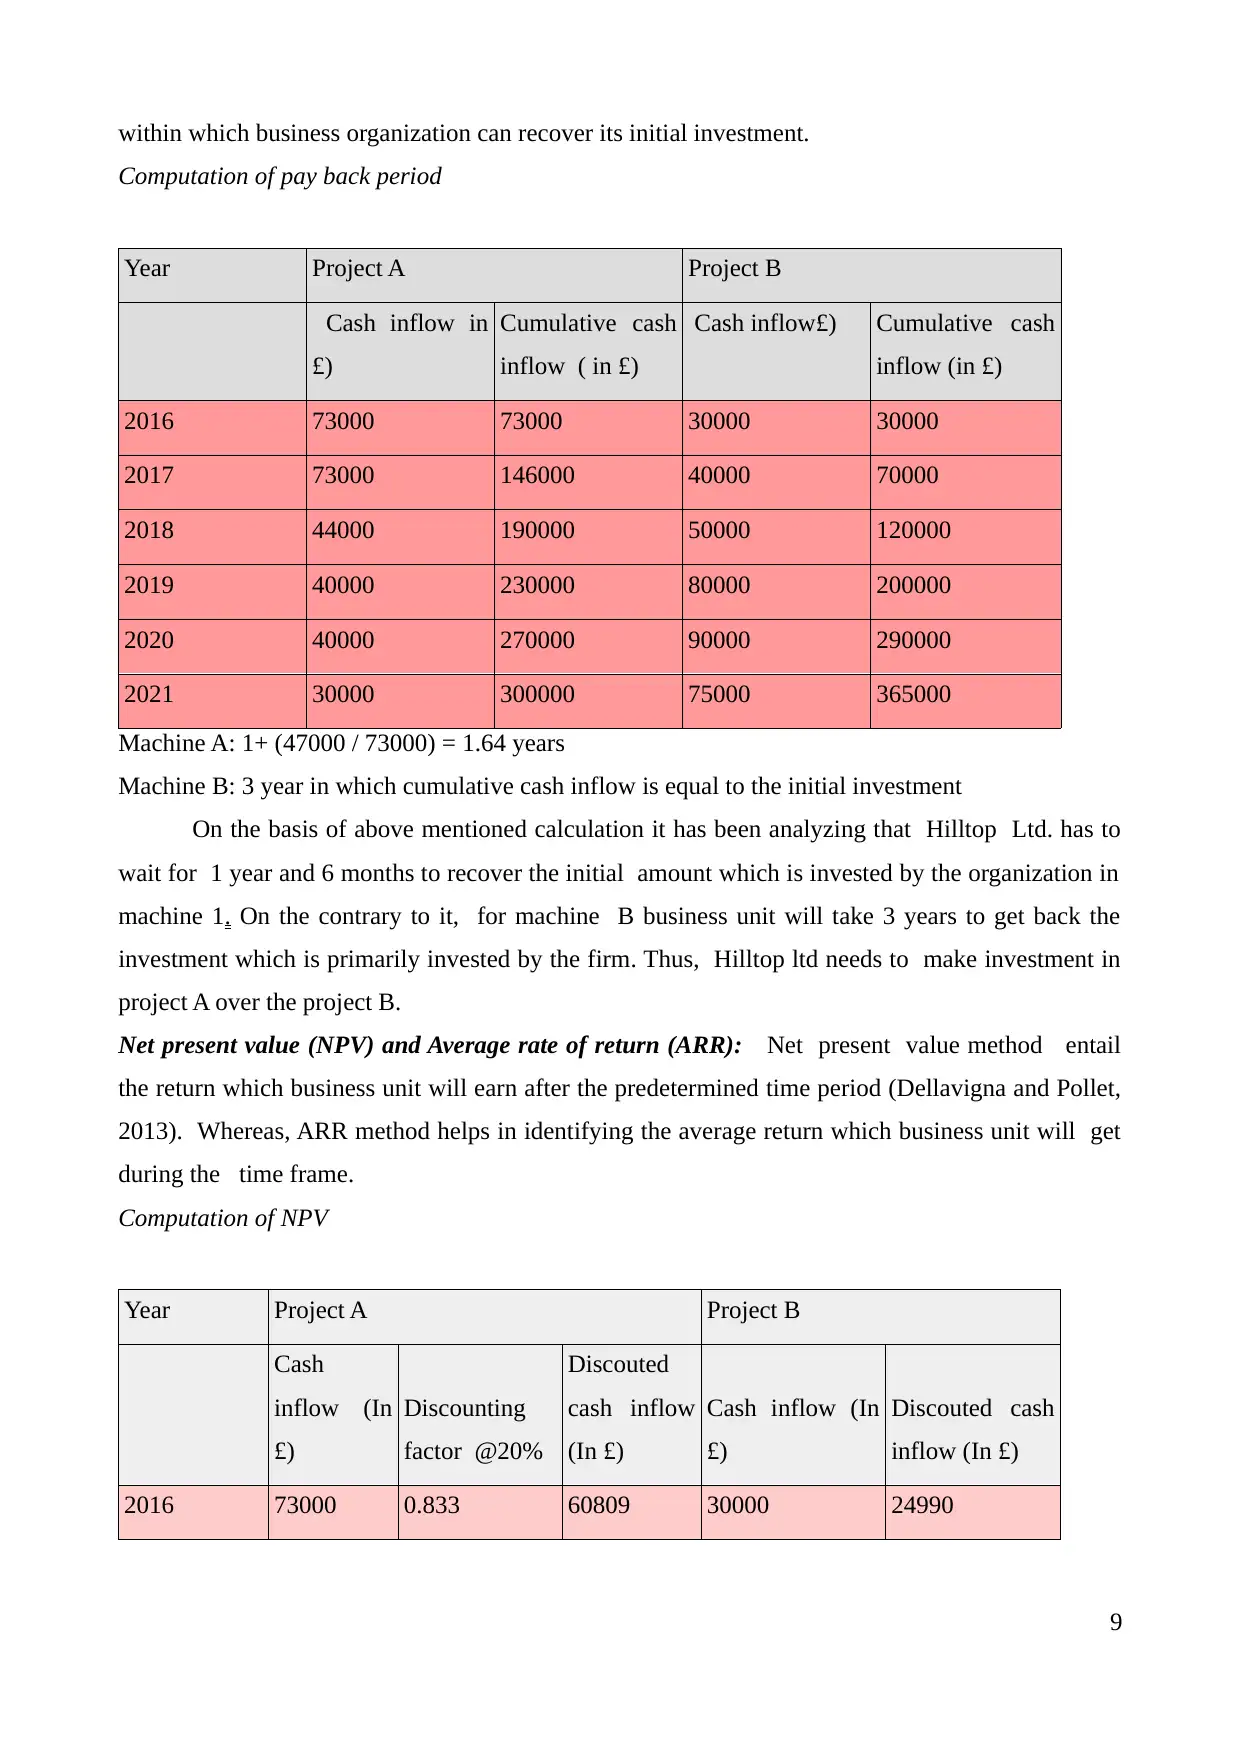
Computation of pay back period
Year Project A Project B
Cash inflow in
£)
Cumulative cash
inflow ( in £)
Cash inflow£) Cumulative cash
inflow (in £)
2016 73000 73000 30000 30000
2017 73000 146000 40000 70000
2018 44000 190000 50000 120000
2019 40000 230000 80000 200000
2020 40000 270000 90000 290000
2021 30000 300000 75000 365000
Machine A: 1+ (47000 / 73000) = 1.64 years
Machine B: 3 year in which cumulative cash inflow is equal to the initial investment
On the basis of above mentioned calculation it has been analyzing that Hilltop Ltd. has to
wait for 1 year and 6 months to recover the initial amount which is invested by the organization in
machine 1. On the contrary to it, for machine B business unit will take 3 years to get back the
investment which is primarily invested by the firm. Thus, Hilltop ltd needs to make investment in
project A over the project B.
Net present value (NPV) and Average rate of return (ARR): Net present value method entail
the return which business unit will earn after the predetermined time period (Dellavigna and Pollet,
2013). Whereas, ARR method helps in identifying the average return which business unit will get
during the time frame.
Computation of NPV
Year Project A Project B
Cash
inflow (In
£)
Discounting
factor @20%
Discouted
cash inflow
(In £)
Cash inflow (In
£)
Discouted cash
inflow (In £)
2016 73000 0.833 60809 30000 24990
9
⊘ This is a preview!⊘
Do you want full access?
Subscribe today to unlock all pages.
Trusted by 1+ million students worldwide
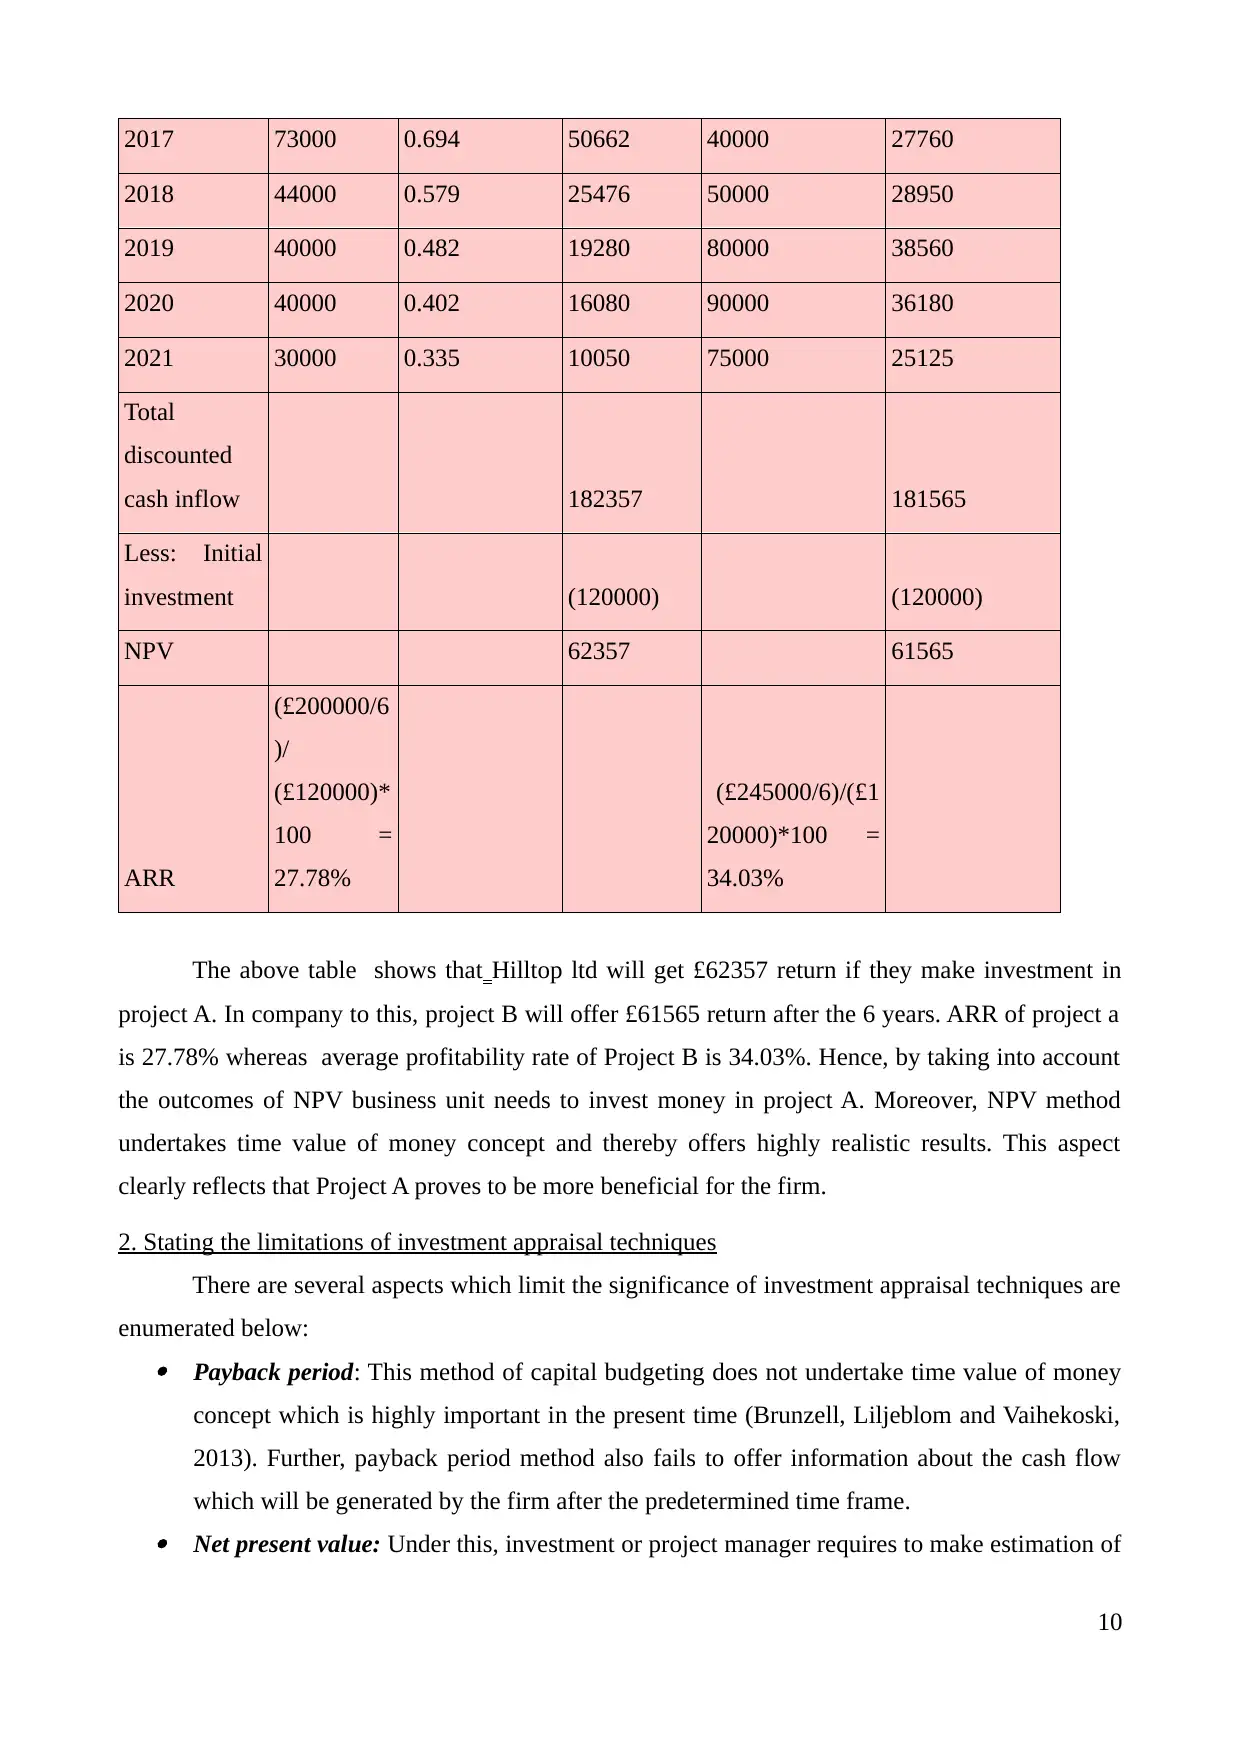
2017 73000 0.694 50662 40000 27760
2018 44000 0.579 25476 50000 28950
2019 40000 0.482 19280 80000 38560
2020 40000 0.402 16080 90000 36180
2021 30000 0.335 10050 75000 25125
Total
discounted
cash inflow 182357 181565
Less: Initial
investment (120000) (120000)
NPV 62357 61565
ARR
(£200000/6
)/
(£120000)*
100 =
27.78%
(£245000/6)/(£1
20000)*100 =
34.03%
The above table shows that Hilltop ltd will get £62357 return if they make investment in
project A. In company to this, project B will offer £61565 return after the 6 years. ARR of project a
is 27.78% whereas average profitability rate of Project B is 34.03%. Hence, by taking into account
the outcomes of NPV business unit needs to invest money in project A. Moreover, NPV method
undertakes time value of money concept and thereby offers highly realistic results. This aspect
clearly reflects that Project A proves to be more beneficial for the firm.
2. Stating the limitations of investment appraisal techniques
There are several aspects which limit the significance of investment appraisal techniques are
enumerated below: Payback period: This method of capital budgeting does not undertake time value of money
concept which is highly important in the present time (Brunzell, Liljeblom and Vaihekoski,
2013). Further, payback period method also fails to offer information about the cash flow
which will be generated by the firm after the predetermined time frame. Net present value: Under this, investment or project manager requires to make estimation of
10
Paraphrase This Document
Need a fresh take? Get an instant paraphrase of this document with our AI Paraphraser
the cost of capital (Mbabazize and Daniel, 2014). If manager fails to opt suitable discounting
factor then this method does not offer suitable framework for the purpose of decision
making.
Averages rate of return: This tool of investment appraisal also avoids time value of money
concept (Wood and et.al., 2013). Furthermore, ARR method does not offer suitable
framework when its is used to compare the two mutually exclusive projects.
CONCLUSION
From the above report, it can be concluded that profitability and liquidity position of Next
plc is improved as compared to past. Whereas, financial health and performance of H&M had
decreased in comparison to before years which is not good sign for the firm. Thus, business unit
needs to undertake effectual measure which provides assistance to them in improving the financial
aspects. Furthermore, it can be inferred that Hilltop ltd needs to select project A which will help
them in attaining success in the strategic business arena.
11
REFERENCES
Books and Journals
Brunzell, T., Liljeblom, E. and Vaihekoski, M., 2013. Determinants of capital budgeting methods
and hurdle rates in Nordic firms. Accounting & Finance. 53(1). pp.85-110.
Chen, E. and Gavious, I., 2016. Unrealized earnings, dividends and reporting aggressiveness: an
examination of firms’ behavior in the era of fair value accounting. Accounting & Finance.
56(1). pp.217-250.
Dellavigna, S. and Pollet, J.M., 2013. Capital budgeting versus market timing: An evaluation using
demographics. The Journal of Finance. 68(1). pp.237-270.
Gitman, L.J., 2013. Principles of Managerial Finance: Global Edition. Pearson Higher Ed.
Karande, P. and Chakraborty, S., 2012. Application of multi-objective optimization on the basis of
ratio analysis (MOORA) method for materials selection. Materials & Design. 37. pp.317-
324.
Kumbirai, M. and Webb, R., 2013. A financial ratio analysis of commercial bank performance in
South Africa. African Review of Economics and Finance. 2(1). pp.30-53.
Liao, G.J. and et.al., 2012. Noninvasive prenatal diagnosis of fetal trisomy 21 by allelic ratio
analysis using targeted massively parallel sequencing of maternal plasma DNA. PLoS One.
7(5). pp.e38154.
Mbabazize, P.M. and Daniel, T., 2014. Capital Budgeting Practices In Developing Countries: A
Case Of Rwanda. Research journali’s Journal of Finance. 2(3). pp.34, 38.
Wood, D.P. and et.al., 2013. Applications and limitations of wrap-around ratio to vehicle speed
estimation in pedestrian collision analysis. International Journal of Crashworthiness. 18(3).
pp.288-305.
Online
Limitations of ratio analysis, 2013. [Online]. Available through:
<http://accountingexplained.com/financial/ratios/advantages-limitations>. [Accessed on 25th
April 2016].
12
⊘ This is a preview!⊘
Do you want full access?
Subscribe today to unlock all pages.
Trusted by 1+ million students worldwide
1 out of 13
Related Documents


Your All-in-One AI-Powered Toolkit for Academic Success.
+13062052269
info@desklib.com
Available 24*7 on WhatsApp / Email
![[object Object]](/_next/static/media/star-bottom.7253800d.svg)
Unlock your academic potential
Copyright © 2020–2026 A2Z Services. All Rights Reserved. Developed and managed by ZUCOL.