Financial Analysis Management & Enterprise Report: Sainsbury and Tesco
VerifiedAdded on 2021/02/20
|31
|7584
|54
Report
AI Summary
This report, prepared by a financial manager, analyzes the financial performance of Sainsbury and Tesco Plc, focusing on providing recommendations for an Asian food manufacturer in selecting a prospective client. It includes a detailed vertical and horizontal analysis of the companies' financial statements, comparing their profitability, liquidity, solvency, and efficiency ratios. The report also examines the importance of working capital analysis for decision-making and evaluates the cash flow statements of both companies. The analysis covers the years 2016-2019, providing insights into the trends of key financial metrics such as gross profit, net profit, current ratio, debt-equity ratio, inventory turnover, and earnings per share. The report concludes with an assessment of the financial positions and performance of both Sainsbury and Tesco, supporting strategic decision-making for the food manufacturer.
Financial Analysis
Management &
Enterprise
Management &
Enterprise
Paraphrase This Document
Need a fresh take? Get an instant paraphrase of this document with our AI Paraphraser
Table of Contents
INTRODUCTION...........................................................................................................................3
1. Detailed vertical and horizontal analysis and ratio analysis of the financial statements of
Sainsbury and Tesco Plc.............................................................................................................3
Importance of working capital analysis of companies prior to decision making......................19
Evaluation of cash flow statements ..........................................................................................19
CONCLUSION..............................................................................................................................20
REFERENCES..............................................................................................................................21
APPENDIX ...................................................................................................................................22
INTRODUCTION
Financial analysis refers to a detailed study of each financial transactions of the company,
summarising all those transactions and prepare the financial reports for the company in such a
way so that they could show the actual financial performance of the business to its stakeholders
(Muda and et.al., 2018). Further, financial management is a process of evaluate overall financial
performance of the company compare it with its set objectives and goals and formulate plans and
procedures for the company so that the financial performance of the firm could be improved in
the competitive market. The present assignment shows a report made by a financial manager for
Asian food manufacturer for the purpose providing recommendations to the company in context
to the most prospective client between Sainsbury and Tesco Plc.
The report includes a detailed vertical and horizontal analysis of the company along with
brief comparision of both the companies on the basis of their financial statements. In addition to
this, the assignment also shows importance of the woring capital analysis of a firm in context to
taking several decisions for the company. Further, the report also shows a critical analysis of
both the companies on the basis of their cash flow or the liquidity position. At the end of report,
it shows several statement showing financial performance of the company.
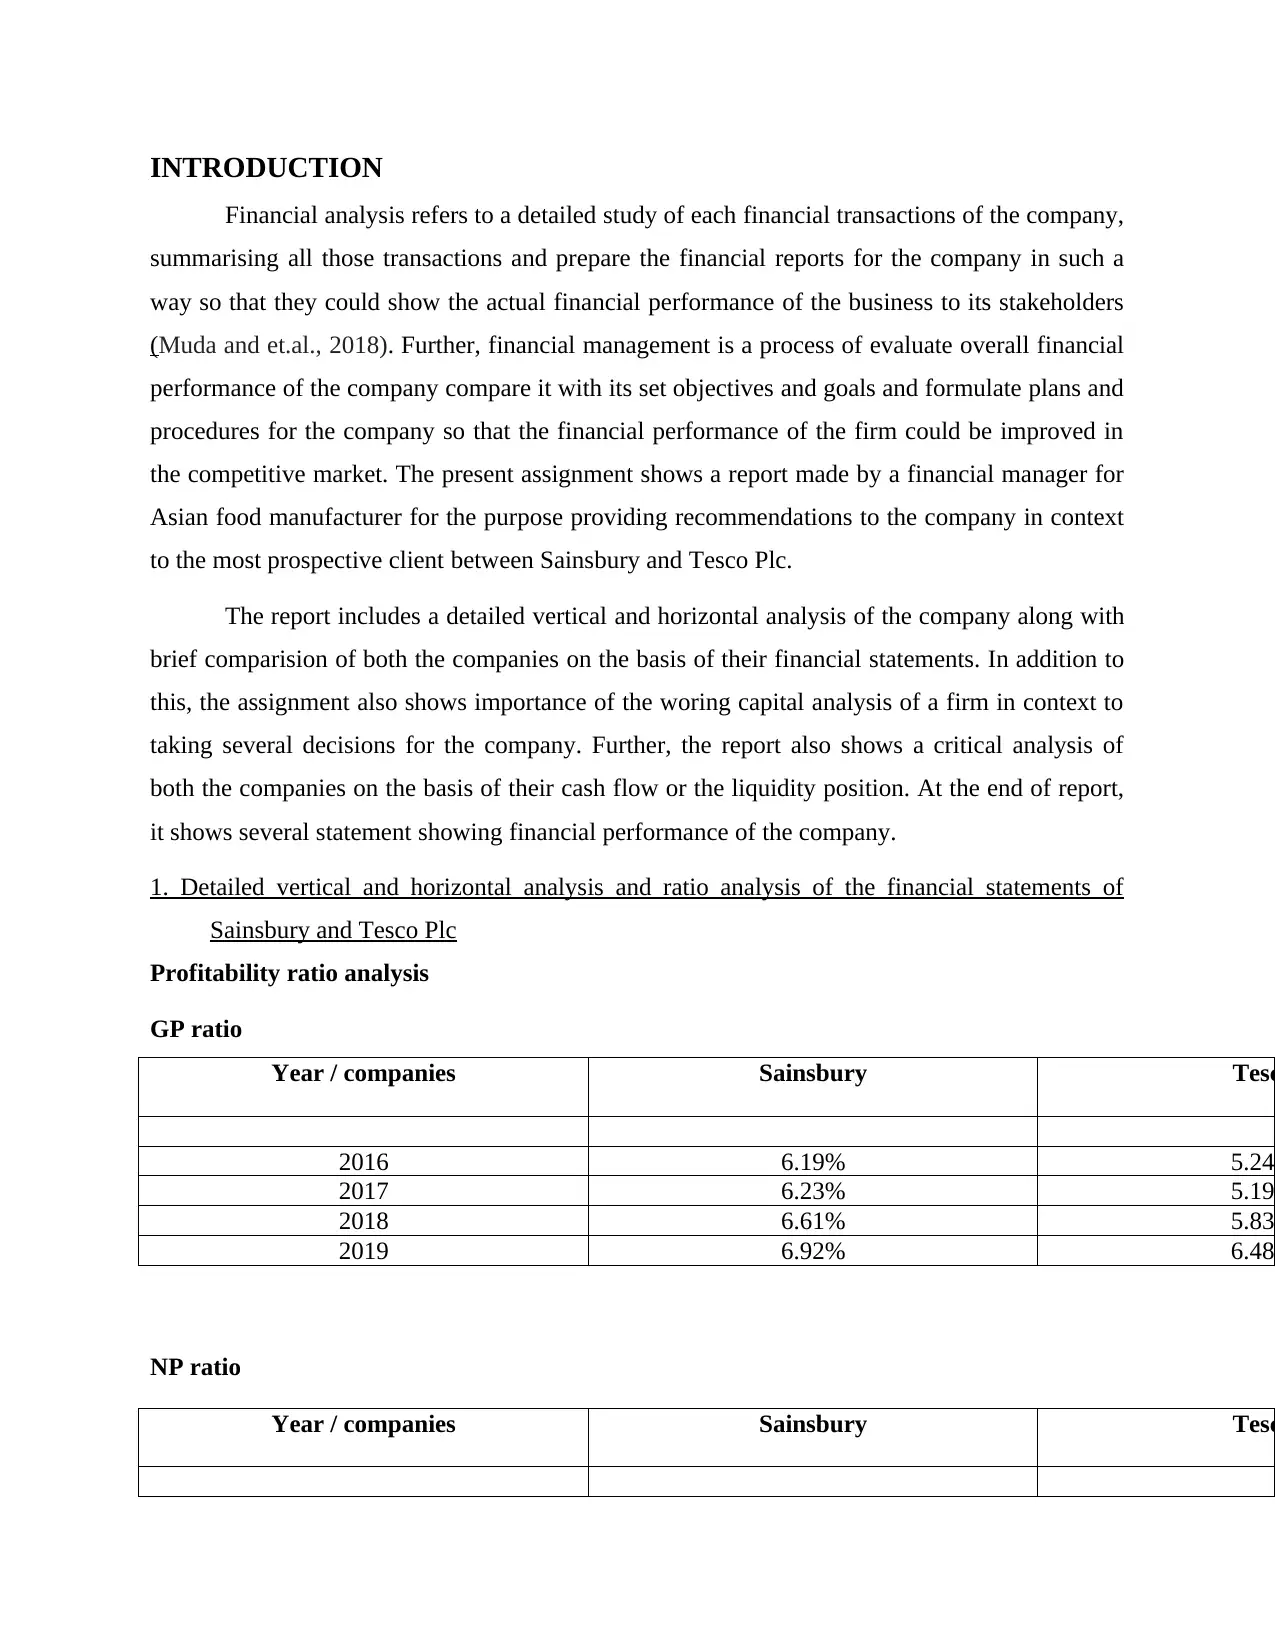
1. Detailed vertical and horizontal analysis and ratio analysis of the financial statements of
Sainsbury and Tesco Plc
Profitability ratio analysis
GP ratio
Year / companies Sainsbury Tesc
2016 6.19% 5.24%
2017 6.23% 5.19%
2018 6.61% 5.83%
2019 6.92% 6.48%
NP ratio
Year / companies Sainsbury Tesc
Financial analysis refers to a detailed study of each financial transactions of the company,
summarising all those transactions and prepare the financial reports for the company in such a
way so that they could show the actual financial performance of the business to its stakeholders
(Muda and et.al., 2018). Further, financial management is a process of evaluate overall financial
performance of the company compare it with its set objectives and goals and formulate plans and
procedures for the company so that the financial performance of the firm could be improved in
the competitive market. The present assignment shows a report made by a financial manager for
Asian food manufacturer for the purpose providing recommendations to the company in context
to the most prospective client between Sainsbury and Tesco Plc.
The report includes a detailed vertical and horizontal analysis of the company along with
brief comparision of both the companies on the basis of their financial statements. In addition to
this, the assignment also shows importance of the woring capital analysis of a firm in context to
taking several decisions for the company. Further, the report also shows a critical analysis of
both the companies on the basis of their cash flow or the liquidity position. At the end of report,
it shows several statement showing financial performance of the company.
1. Detailed vertical and horizontal analysis and ratio analysis of the financial statements of
Sainsbury and Tesco Plc
Profitability ratio analysis
GP ratio
Year / companies Sainsbury Tesc
2016 6.19% 5.24%
2017 6.23% 5.19%
2018 6.61% 5.83%
2019 6.92% 6.48%
NP ratio
Year / companies Sainsbury Tesc
⊘ This is a preview!⊘
Do you want full access?
Subscribe today to unlock all pages.
Trusted by 1+ million students worldwide
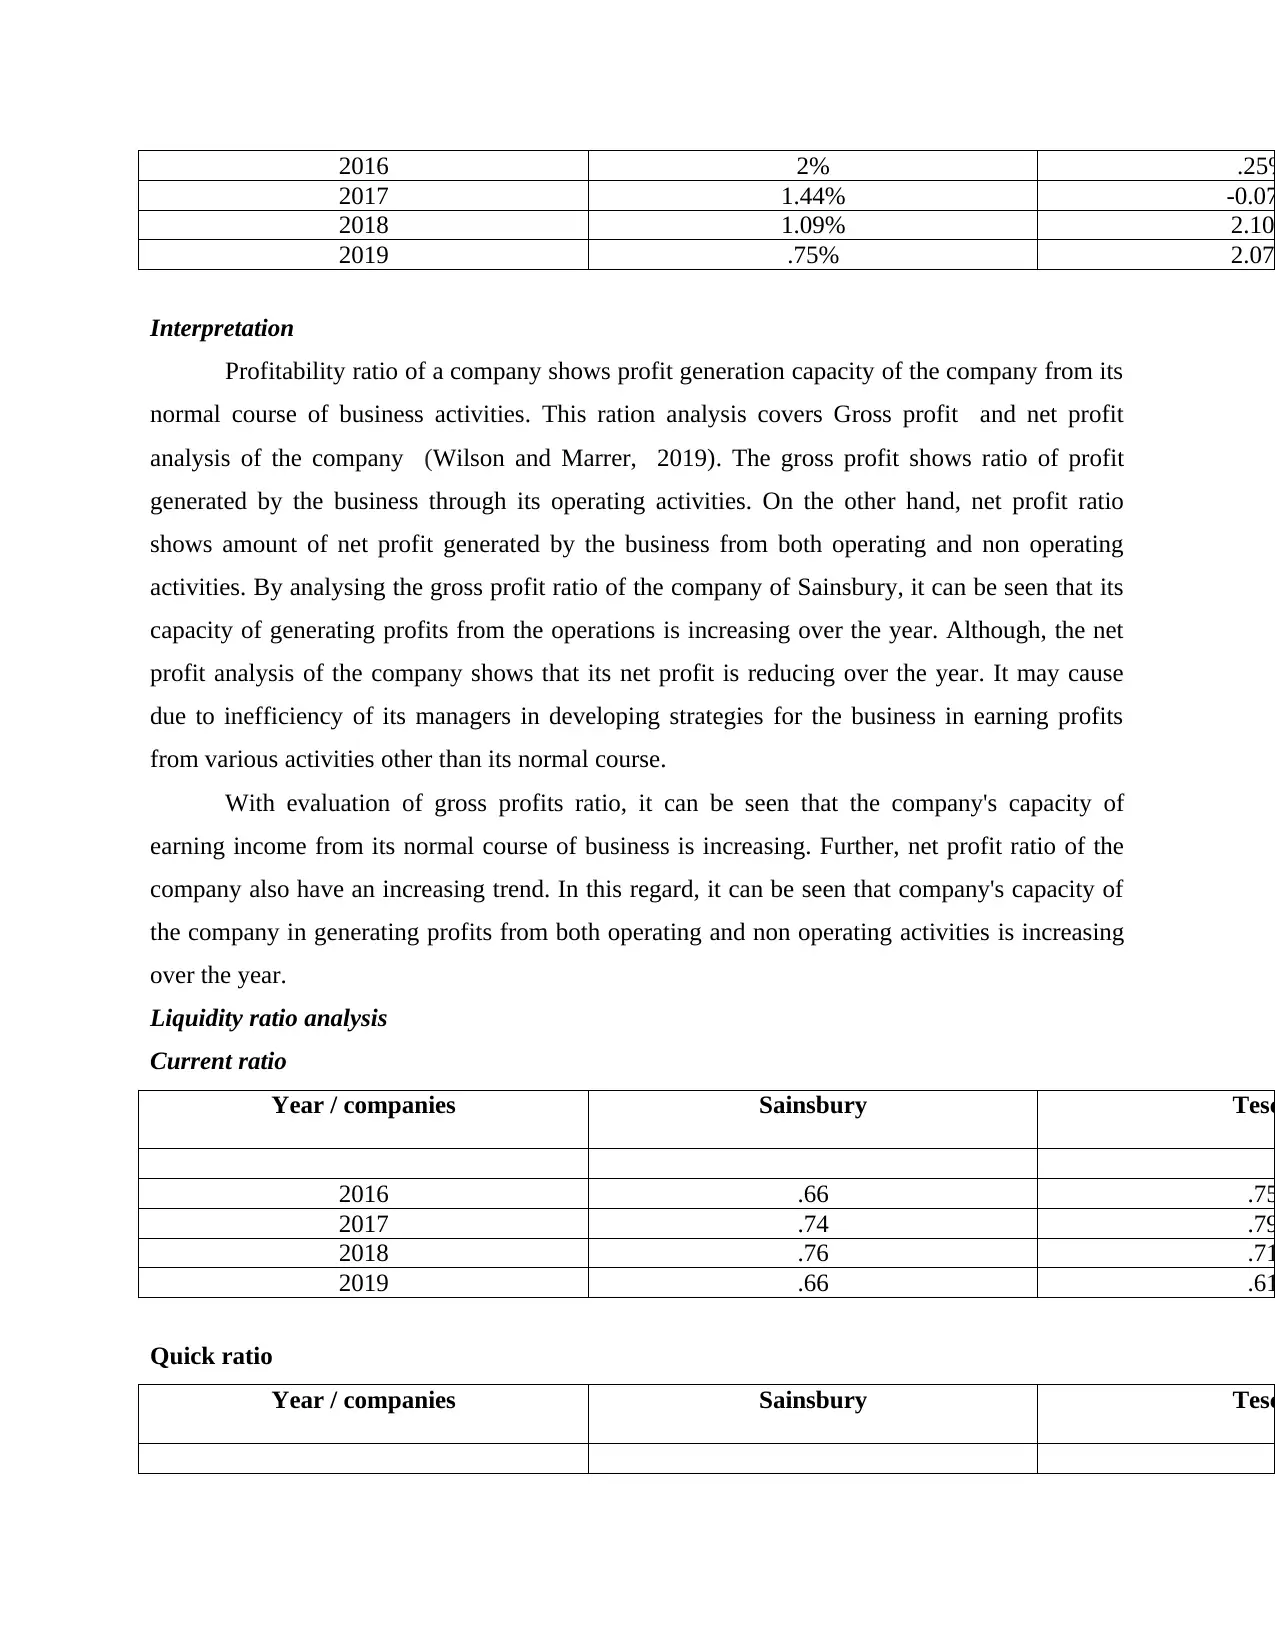
2016 2% .25%
2017 1.44% -0.07
2018 1.09% 2.10%
2019 .75% 2.07%
Interpretation
Profitability ratio of a company shows profit generation capacity of the company from its
normal course of business activities. This ration analysis covers Gross profit and net profit
analysis of the company (Wilson and Marrer, 2019). The gross profit shows ratio of profit
generated by the business through its operating activities. On the other hand, net profit ratio
shows amount of net profit generated by the business from both operating and non operating
activities. By analysing the gross profit ratio of the company of Sainsbury, it can be seen that its
capacity of generating profits from the operations is increasing over the year. Although, the net
profit analysis of the company shows that its net profit is reducing over the year. It may cause
due to inefficiency of its managers in developing strategies for the business in earning profits
from various activities other than its normal course.
With evaluation of gross profits ratio, it can be seen that the company's capacity of
earning income from its normal course of business is increasing. Further, net profit ratio of the
company also have an increasing trend. In this regard, it can be seen that company's capacity of
the company in generating profits from both operating and non operating activities is increasing
over the year.
Liquidity ratio analysis
Current ratio
Year / companies Sainsbury Tesc
2016 .66 .75
2017 .74 .79
2018 .76 .71
2019 .66 .61
Quick ratio
Year / companies Sainsbury Tesc
Paraphrase This Document
Need a fresh take? Get an instant paraphrase of this document with our AI Paraphraser
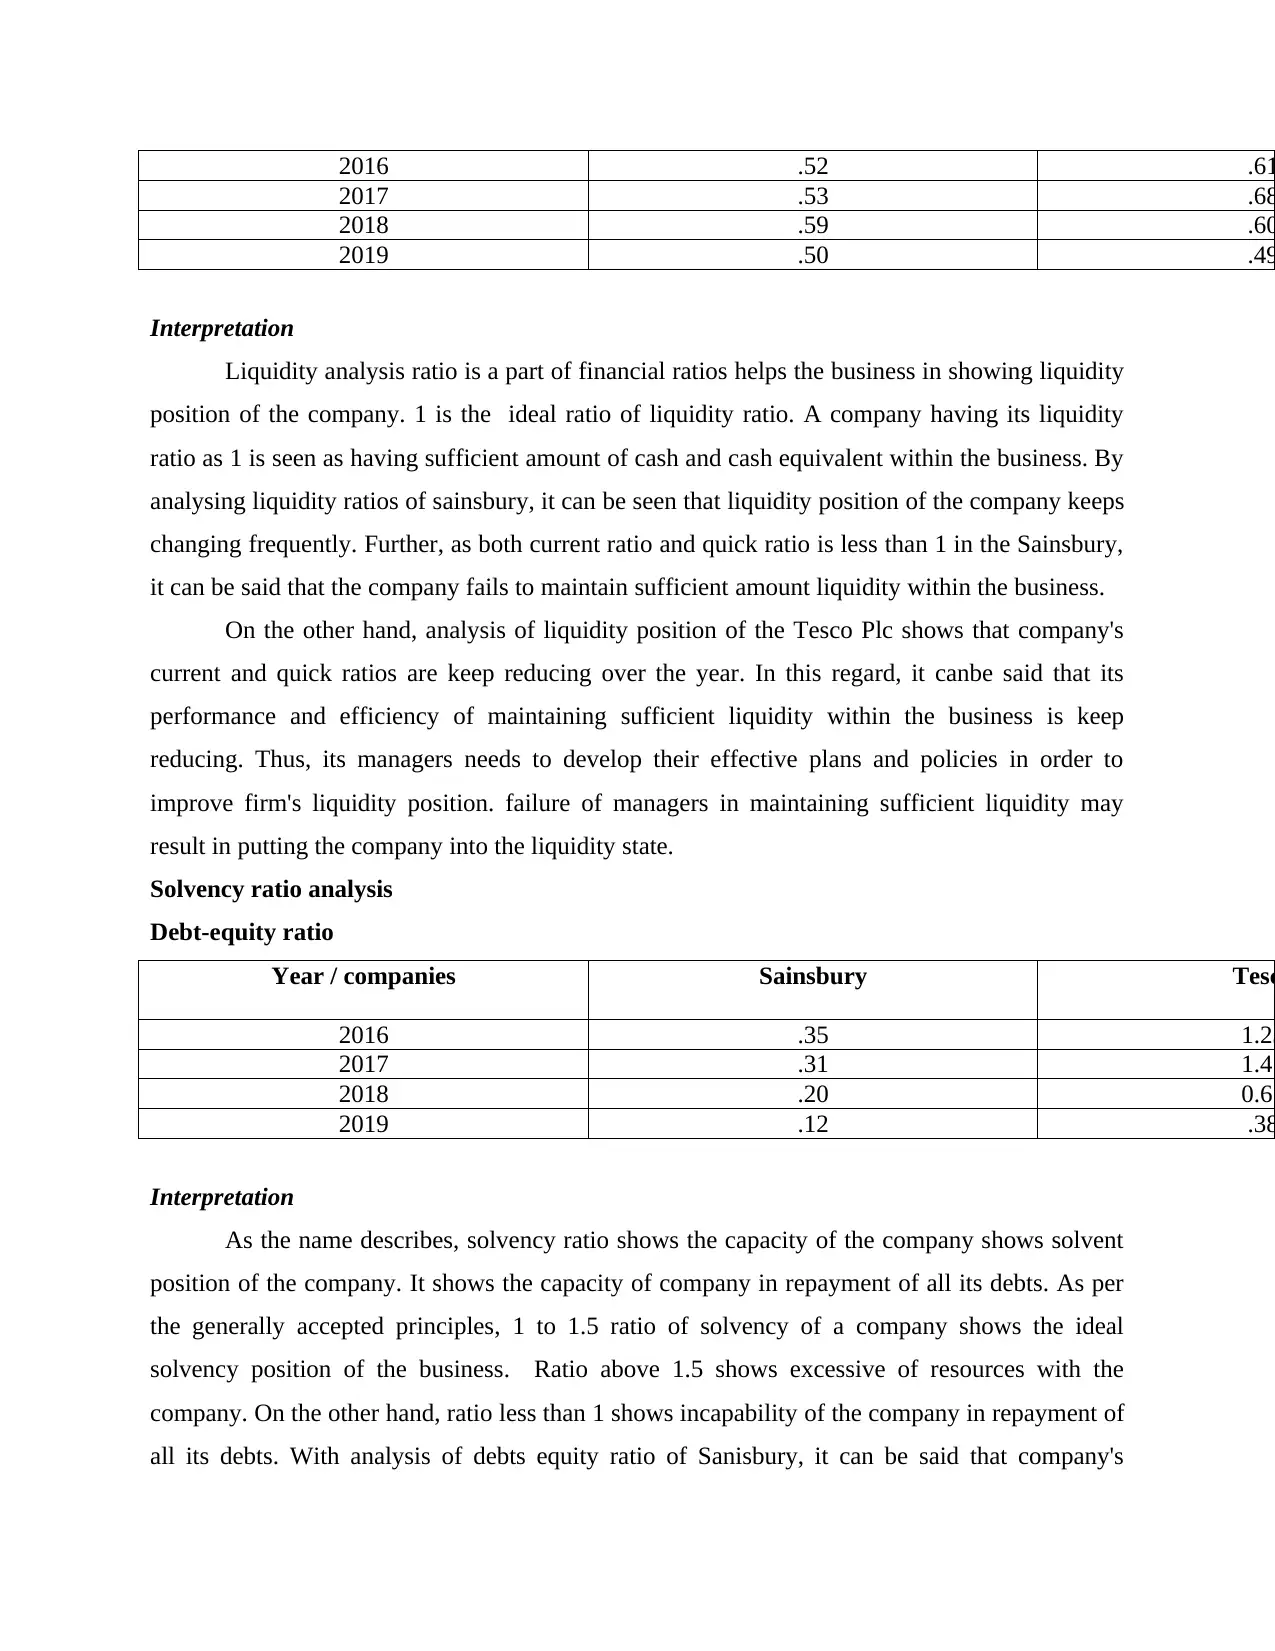
2016 .52 .61
2017 .53 .68
2018 .59 .60
2019 .50 .49
Interpretation
Liquidity analysis ratio is a part of financial ratios helps the business in showing liquidity
position of the company. 1 is the ideal ratio of liquidity ratio. A company having its liquidity
ratio as 1 is seen as having sufficient amount of cash and cash equivalent within the business. By
analysing liquidity ratios of sainsbury, it can be seen that liquidity position of the company keeps
changing frequently. Further, as both current ratio and quick ratio is less than 1 in the Sainsbury,
it can be said that the company fails to maintain sufficient amount liquidity within the business.
On the other hand, analysis of liquidity position of the Tesco Plc shows that company's
current and quick ratios are keep reducing over the year. In this regard, it canbe said that its
performance and efficiency of maintaining sufficient liquidity within the business is keep
reducing. Thus, its managers needs to develop their effective plans and policies in order to
improve firm's liquidity position. failure of managers in maintaining sufficient liquidity may
result in putting the company into the liquidity state.
Solvency ratio analysis
Debt-equity ratio
Year / companies Sainsbury Tesc
2016 .35 1.23
2017 .31 1.45
2018 .20 0.67
2019 .12 .38
Interpretation
As the name describes, solvency ratio shows the capacity of the company shows solvent
position of the company. It shows the capacity of company in repayment of all its debts. As per
the generally accepted principles, 1 to 1.5 ratio of solvency of a company shows the ideal
solvency position of the business. Ratio above 1.5 shows excessive of resources with the
company. On the other hand, ratio less than 1 shows incapability of the company in repayment of
all its debts. With analysis of debts equity ratio of Sanisbury, it can be said that company's
position of repayment is keep reducing over the year. Whereas, Tesco's capacity of repayment is
also reducing over the year. Thus managers of both companies need to maintain strategies for the
business in improving its capacity of maintaining resources within the firm in repayment of all
its debts.
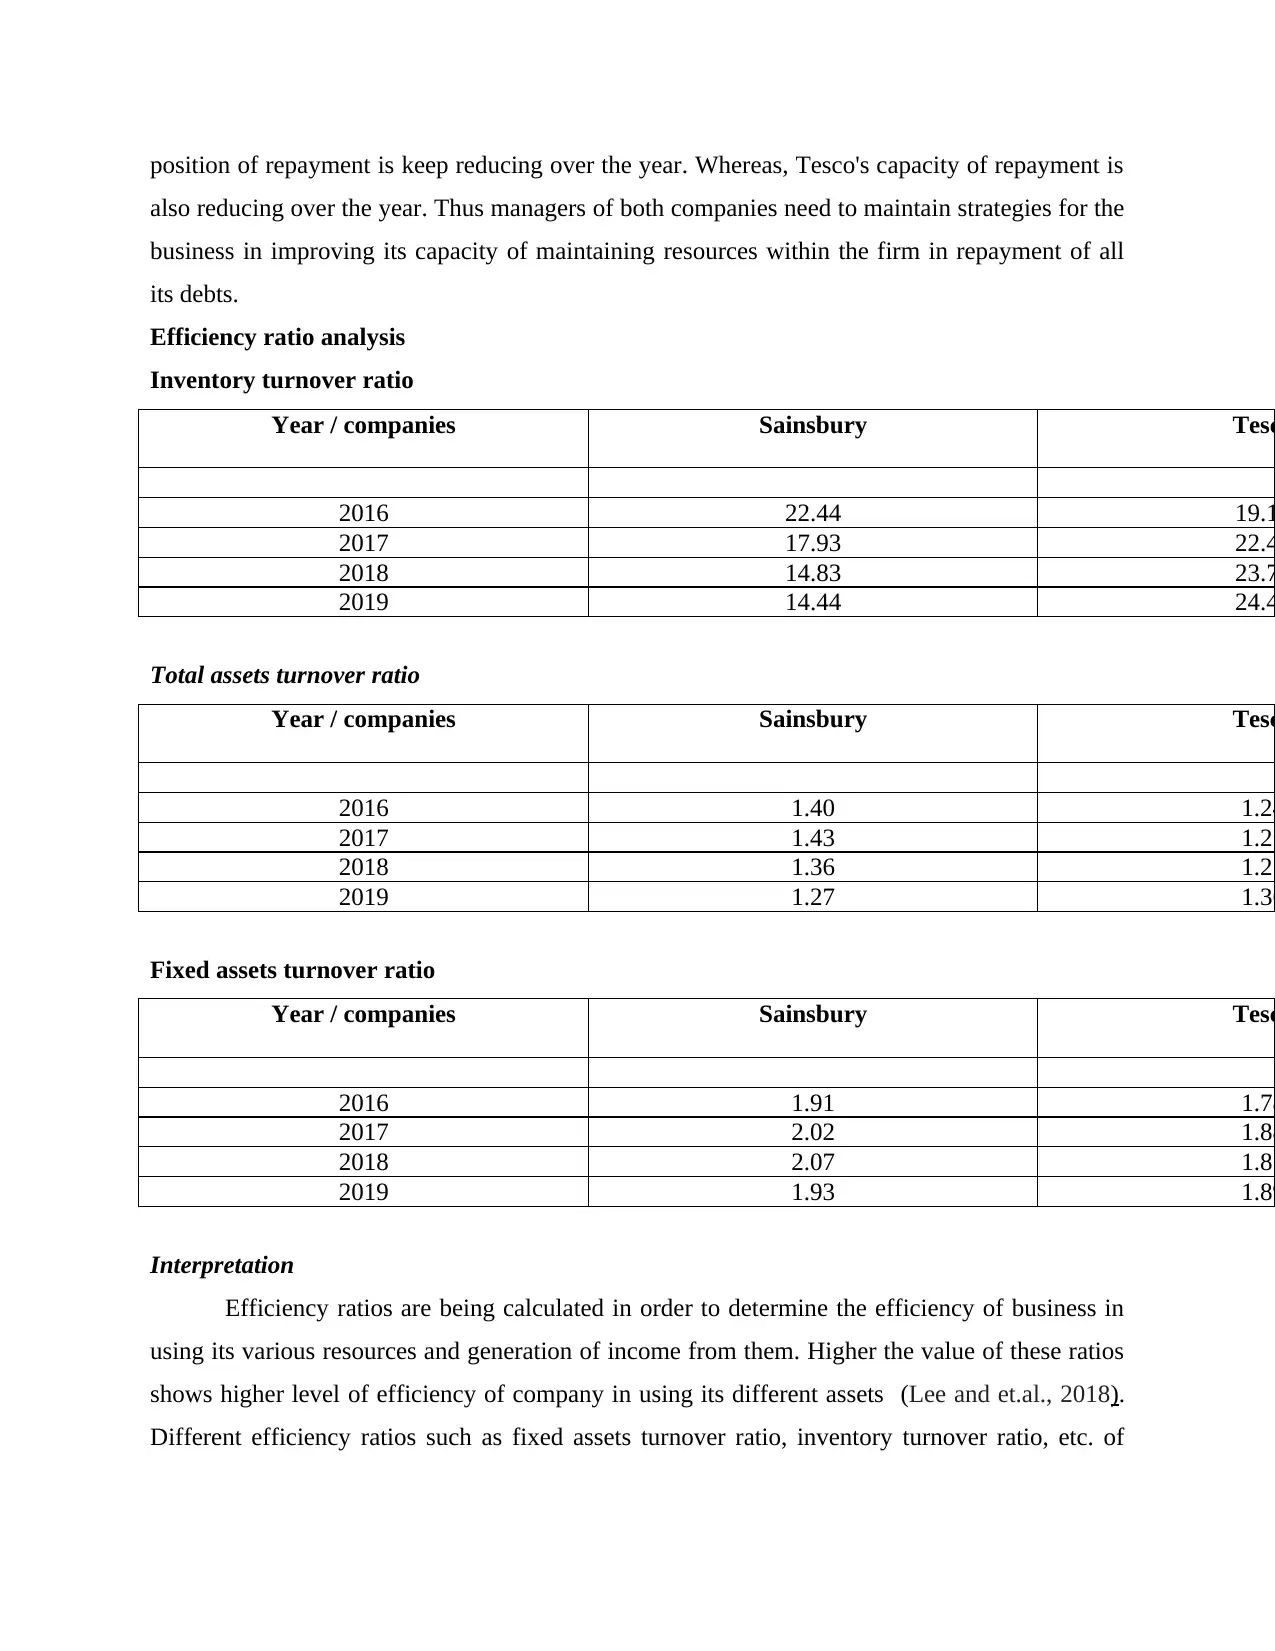
Efficiency ratio analysis
Inventory turnover ratio
Year / companies Sainsbury Tesc
2016 22.44 19.1
2017 17.93 22.4
2018 14.83 23.7
2019 14.44 24.4
Total assets turnover ratio
Year / companies Sainsbury Tesc
2016 1.40 1.24
2017 1.43 1.25
2018 1.36 1.27
2019 1.27 1.36
Fixed assets turnover ratio
Year / companies Sainsbury Tesc
2016 1.91 1.78
2017 2.02 1.88
2018 2.07 1.87
2019 1.93 1.89
Interpretation
Efficiency ratios are being calculated in order to determine the efficiency of business in
using its various resources and generation of income from them. Higher the value of these ratios
shows higher level of efficiency of company in using its different assets (Lee and et.al., 2018).
Different efficiency ratios such as fixed assets turnover ratio, inventory turnover ratio, etc. of
also reducing over the year. Thus managers of both companies need to maintain strategies for the
business in improving its capacity of maintaining resources within the firm in repayment of all
its debts.
Efficiency ratio analysis
Inventory turnover ratio
Year / companies Sainsbury Tesc
2016 22.44 19.1
2017 17.93 22.4
2018 14.83 23.7
2019 14.44 24.4
Total assets turnover ratio
Year / companies Sainsbury Tesc
2016 1.40 1.24
2017 1.43 1.25
2018 1.36 1.27
2019 1.27 1.36
Fixed assets turnover ratio
Year / companies Sainsbury Tesc
2016 1.91 1.78
2017 2.02 1.88
2018 2.07 1.87
2019 1.93 1.89
Interpretation
Efficiency ratios are being calculated in order to determine the efficiency of business in
using its various resources and generation of income from them. Higher the value of these ratios
shows higher level of efficiency of company in using its different assets (Lee and et.al., 2018).
Different efficiency ratios such as fixed assets turnover ratio, inventory turnover ratio, etc. of
⊘ This is a preview!⊘
Do you want full access?
Subscribe today to unlock all pages.
Trusted by 1+ million students worldwide
Sainsbury shows that efficiency of generting profits from different assets held by it is keep
increasing over the year.
Further, all the efficiency ratios of Tesco Plc also showing raoid increase in the
capabilities of business in generating profit through different assets held by it.
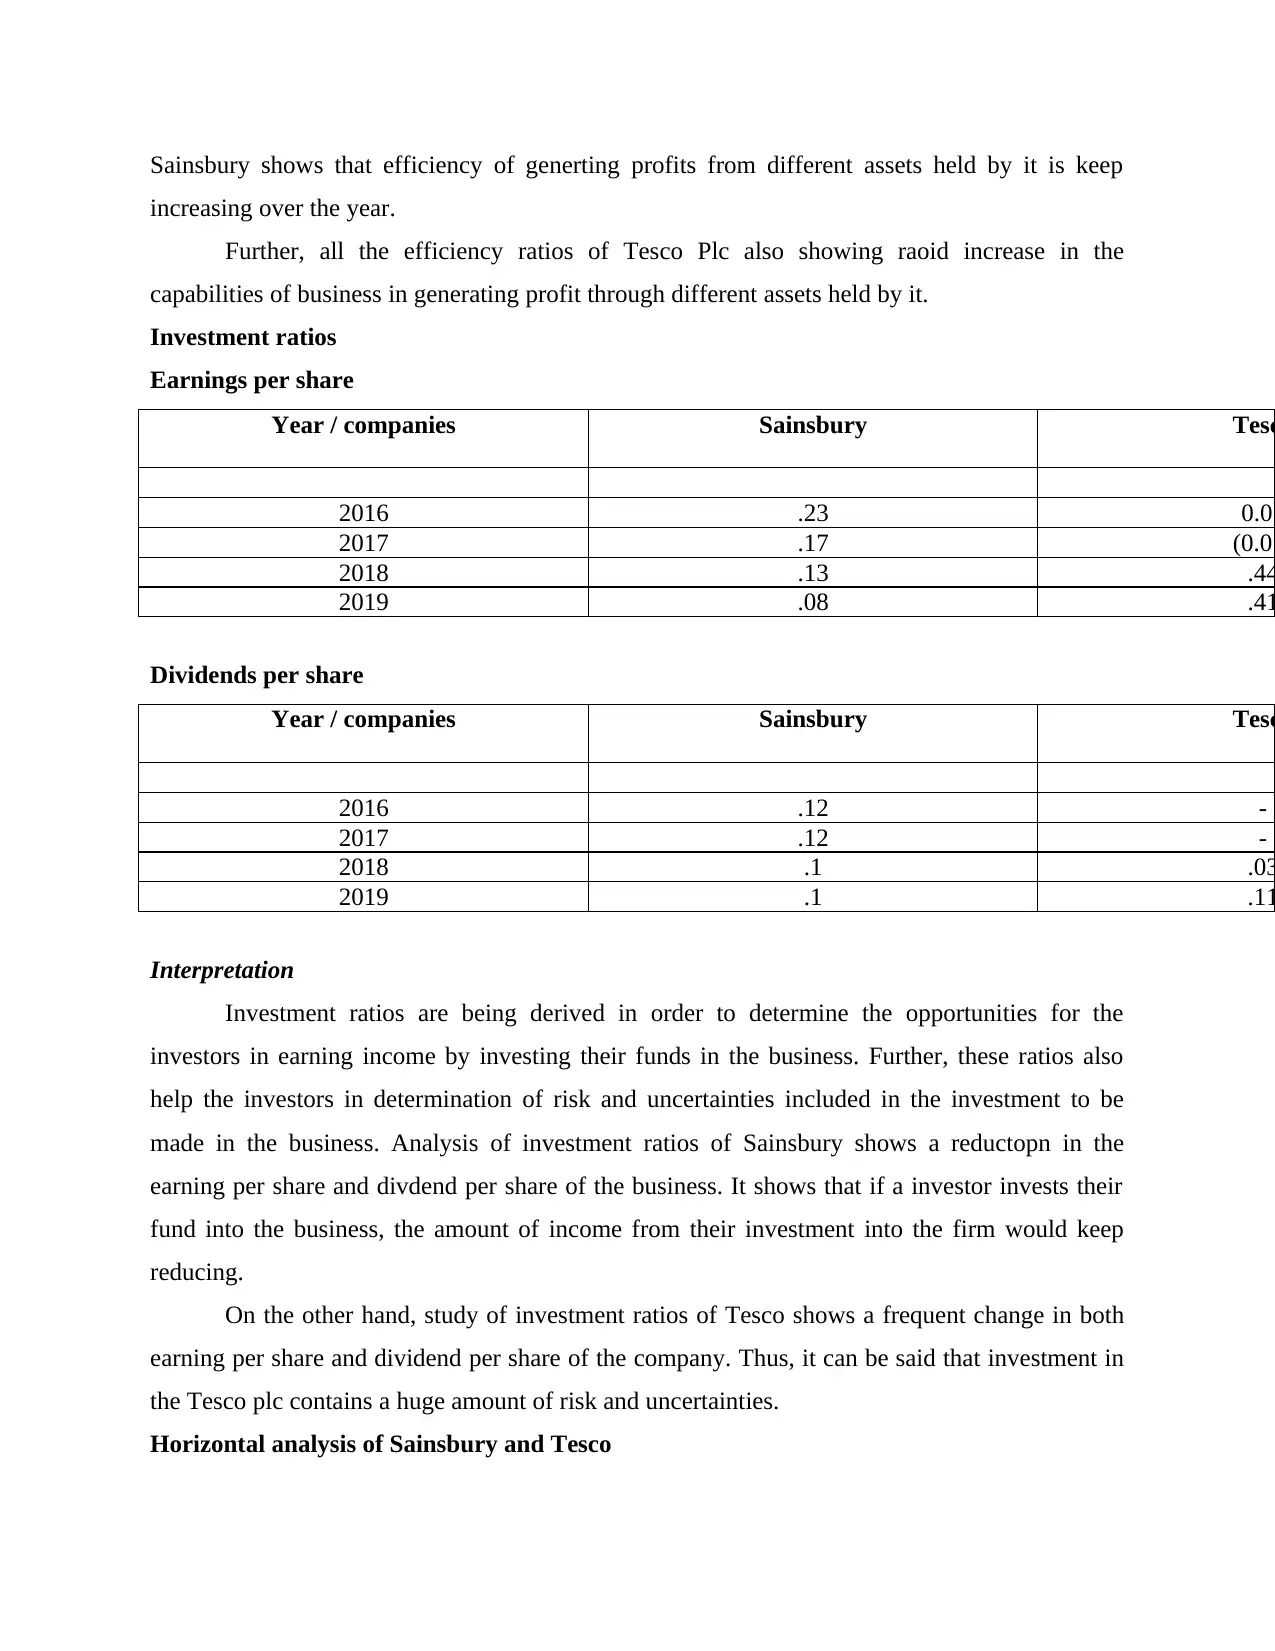
Investment ratios
Earnings per share
Year / companies Sainsbury Tesc
2016 .23 0.05
2017 .17 (0.01
2018 .13 .44
2019 .08 .41
Dividends per share
Year / companies Sainsbury Tesc
2016 .12 -
2017 .12 -
2018 .1 .03
2019 .1 .11
Interpretation
Investment ratios are being derived in order to determine the opportunities for the
investors in earning income by investing their funds in the business. Further, these ratios also
help the investors in determination of risk and uncertainties included in the investment to be
made in the business. Analysis of investment ratios of Sainsbury shows a reductopn in the
earning per share and divdend per share of the business. It shows that if a investor invests their
fund into the business, the amount of income from their investment into the firm would keep
reducing.
On the other hand, study of investment ratios of Tesco shows a frequent change in both
earning per share and dividend per share of the company. Thus, it can be said that investment in
the Tesco plc contains a huge amount of risk and uncertainties.
Horizontal analysis of Sainsbury and Tesco
increasing over the year.
Further, all the efficiency ratios of Tesco Plc also showing raoid increase in the
capabilities of business in generating profit through different assets held by it.
Investment ratios
Earnings per share
Year / companies Sainsbury Tesc
2016 .23 0.05
2017 .17 (0.01
2018 .13 .44
2019 .08 .41
Dividends per share
Year / companies Sainsbury Tesc
2016 .12 -
2017 .12 -
2018 .1 .03
2019 .1 .11
Interpretation
Investment ratios are being derived in order to determine the opportunities for the
investors in earning income by investing their funds in the business. Further, these ratios also
help the investors in determination of risk and uncertainties included in the investment to be
made in the business. Analysis of investment ratios of Sainsbury shows a reductopn in the
earning per share and divdend per share of the business. It shows that if a investor invests their
fund into the business, the amount of income from their investment into the firm would keep
reducing.
On the other hand, study of investment ratios of Tesco shows a frequent change in both
earning per share and dividend per share of the company. Thus, it can be said that investment in
the Tesco plc contains a huge amount of risk and uncertainties.
Horizontal analysis of Sainsbury and Tesco
Paraphrase This Document
Need a fresh take? Get an instant paraphrase of this document with our AI Paraphraser
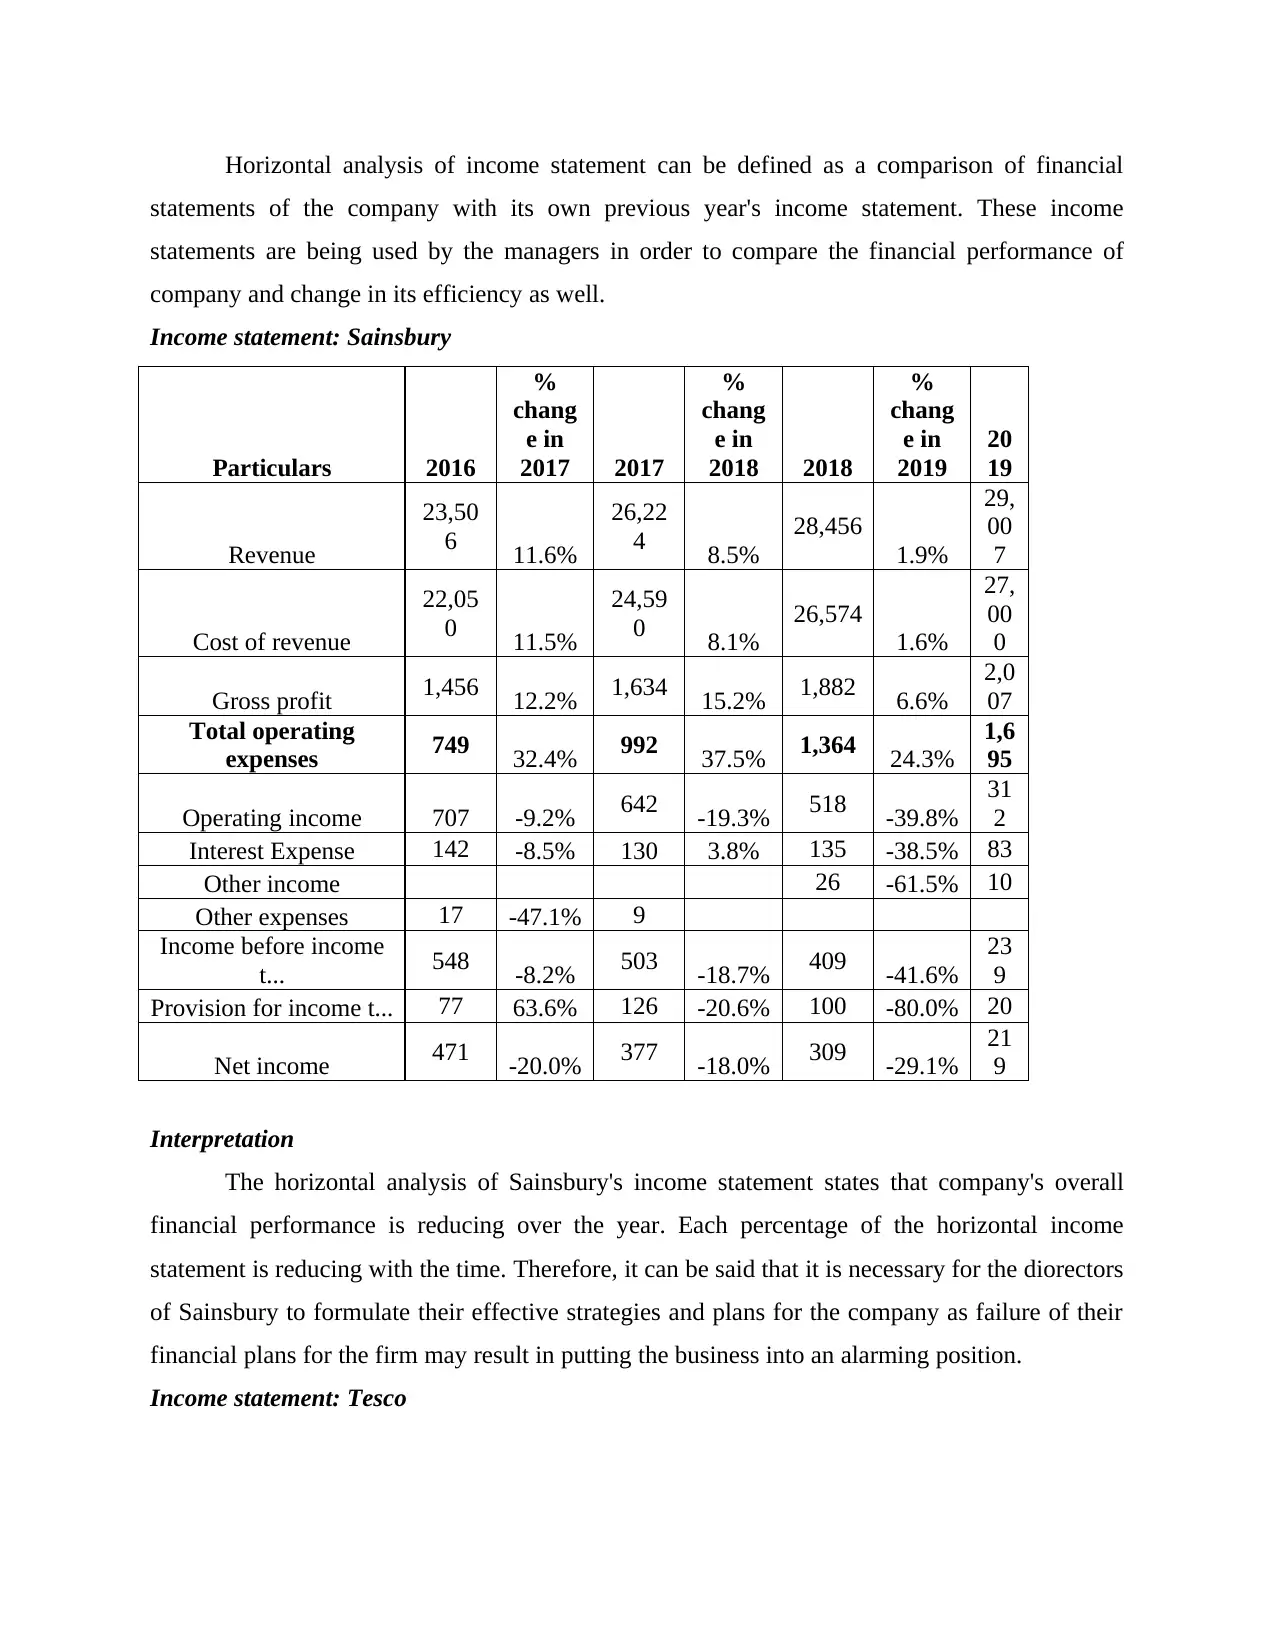
Horizontal analysis of income statement can be defined as a comparison of financial
statements of the company with its own previous year's income statement. These income
statements are being used by the managers in order to compare the financial performance of
company and change in its efficiency as well.
Income statement: Sainsbury
Particulars 2016
%
chang
e in
2017 2017
%
chang
e in
2018 2018
%
chang
e in
2019
20
19
Revenue
23,50
6 11.6%
26,22
4 8.5%
28,456
1.9%
29,
00
7
Cost of revenue
22,05
0 11.5%
24,59
0 8.1%
26,574
1.6%
27,
00
0
Gross profit 1,456 12.2% 1,634 15.2% 1,882 6.6%
2,0
07
Total operating
expenses 749 32.4% 992 37.5% 1,364 24.3%
1,6
95
Operating income 707 -9.2% 642 -19.3% 518 -39.8%
31
2
Interest Expense 142 -8.5% 130 3.8% 135 -38.5% 83
Other income 26 -61.5% 10
Other expenses 17 -47.1% 9
Income before income
t... 548 -8.2% 503 -18.7% 409 -41.6%
23
9
Provision for income t... 77 63.6% 126 -20.6% 100 -80.0% 20
Net income 471 -20.0% 377 -18.0% 309 -29.1%
21
9
Interpretation
The horizontal analysis of Sainsbury's income statement states that company's overall
financial performance is reducing over the year. Each percentage of the horizontal income
statement is reducing with the time. Therefore, it can be said that it is necessary for the diorectors
of Sainsbury to formulate their effective strategies and plans for the company as failure of their
financial plans for the firm may result in putting the business into an alarming position.
Income statement: Tesco
Particulars 2016
%
change
in 2017 2017
% change
in 2018 2018
%
change
in 2019 2019
Revenue 54,433 2.73% 55,917 2.81% 57,491 11.17% 63,911
Cost of revenue 51,579 2.78% 53,015 2.12% 54,141 10.39% 59,767
Gross profit 2,854 1.68% 2,902 15.44% 3,350 23.70% 4,144
Total operating expenses 1,874 -7.47% 1,734 3.00% 1,786 15.73% 2,067
Operating income 980 19.18% 1,168 33.90% 1,564 32.80% 2,077
Interest Expense 498 3.82% 517 -16.63% 431 -31.79% 294
Other income 165
-
100.00%
Other expenses 320 58.13% 506 -100.00% 0 #DIV/0! 109
Income before income t... 162 -10.49% 145 795.17% 1,298 28.97% 1,674
Provision for income t... -54 -
261.11% 87 251.72% 306 15.69% 354
Net income 138 -
128.99% -40 2915% 1,206 9.62% 1,322
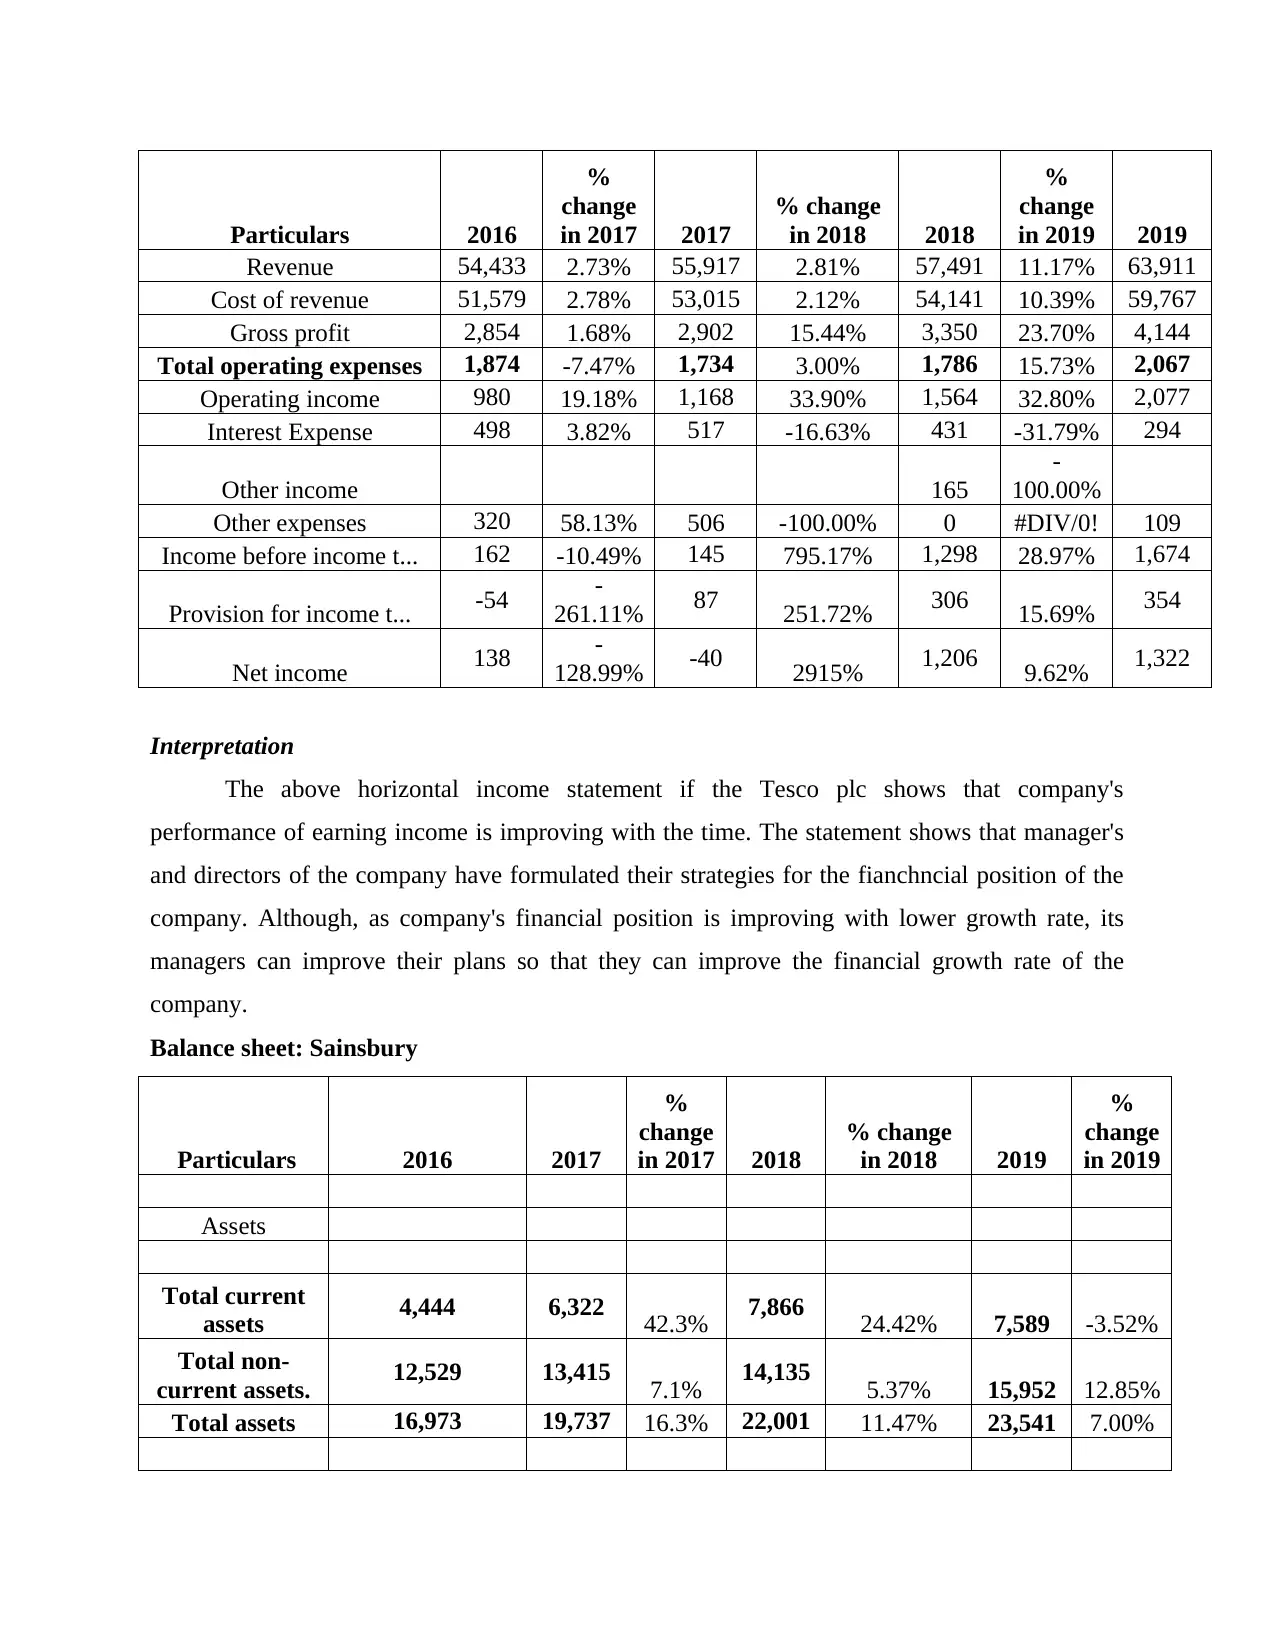
Interpretation
The above horizontal income statement if the Tesco plc shows that company's
performance of earning income is improving with the time. The statement shows that manager's
and directors of the company have formulated their strategies for the fianchncial position of the
company. Although, as company's financial position is improving with lower growth rate, its
managers can improve their plans so that they can improve the financial growth rate of the
company.
Balance sheet: Sainsbury
Particulars 2016 2017
%
change
in 2017 2018
% change
in 2018 2019
%
change
in 2019
Assets
Total current
assets 4,444 6,322 42.3% 7,866 24.42% 7,589 -3.52%
Total non-
current assets. 12,529 13,415 7.1% 14,135 5.37% 15,952 12.85%
Total assets 16,973 19,737 16.3% 22,001 11.47% 23,541 7.00%
%
change
in 2017 2017
% change
in 2018 2018
%
change
in 2019 2019
Revenue 54,433 2.73% 55,917 2.81% 57,491 11.17% 63,911
Cost of revenue 51,579 2.78% 53,015 2.12% 54,141 10.39% 59,767
Gross profit 2,854 1.68% 2,902 15.44% 3,350 23.70% 4,144
Total operating expenses 1,874 -7.47% 1,734 3.00% 1,786 15.73% 2,067
Operating income 980 19.18% 1,168 33.90% 1,564 32.80% 2,077
Interest Expense 498 3.82% 517 -16.63% 431 -31.79% 294
Other income 165
-
100.00%
Other expenses 320 58.13% 506 -100.00% 0 #DIV/0! 109
Income before income t... 162 -10.49% 145 795.17% 1,298 28.97% 1,674
Provision for income t... -54 -
261.11% 87 251.72% 306 15.69% 354
Net income 138 -
128.99% -40 2915% 1,206 9.62% 1,322
Interpretation
The above horizontal income statement if the Tesco plc shows that company's
performance of earning income is improving with the time. The statement shows that manager's
and directors of the company have formulated their strategies for the fianchncial position of the
company. Although, as company's financial position is improving with lower growth rate, its
managers can improve their plans so that they can improve the financial growth rate of the
company.
Balance sheet: Sainsbury
Particulars 2016 2017
%
change
in 2017 2018
% change
in 2018 2019
%
change
in 2019
Assets
Total current
assets 4,444 6,322 42.3% 7,866 24.42% 7,589 -3.52%
Total non-
current assets. 12,529 13,415 7.1% 14,135 5.37% 15,952 12.85%
Total assets 16,973 19,737 16.3% 22,001 11.47% 23,541 7.00%
⊘ This is a preview!⊘
Do you want full access?
Subscribe today to unlock all pages.
Trusted by 1+ million students worldwide
Liabilities and
stockholders
equity
Total current
liabilities 6,724 8,573 27.5% 10,302 20.2% 11,417 10.82%
Total non-
current
liabilities
3,884 4,292
10.5%
4,288
-0.09% 3,668
-
14.46%
Total liabilities 10,608 12,865 21.3% 14,590 13.41% 15,085 3.39%
Total
stockholders'
equity
6,365 6,872
8.0%
7,411
7.84% 8,456 14.10%
Total liabilities
and
stakeholders
equity
16,973 19,737
16.3%
22,001
11.47%
23,541
7.00%
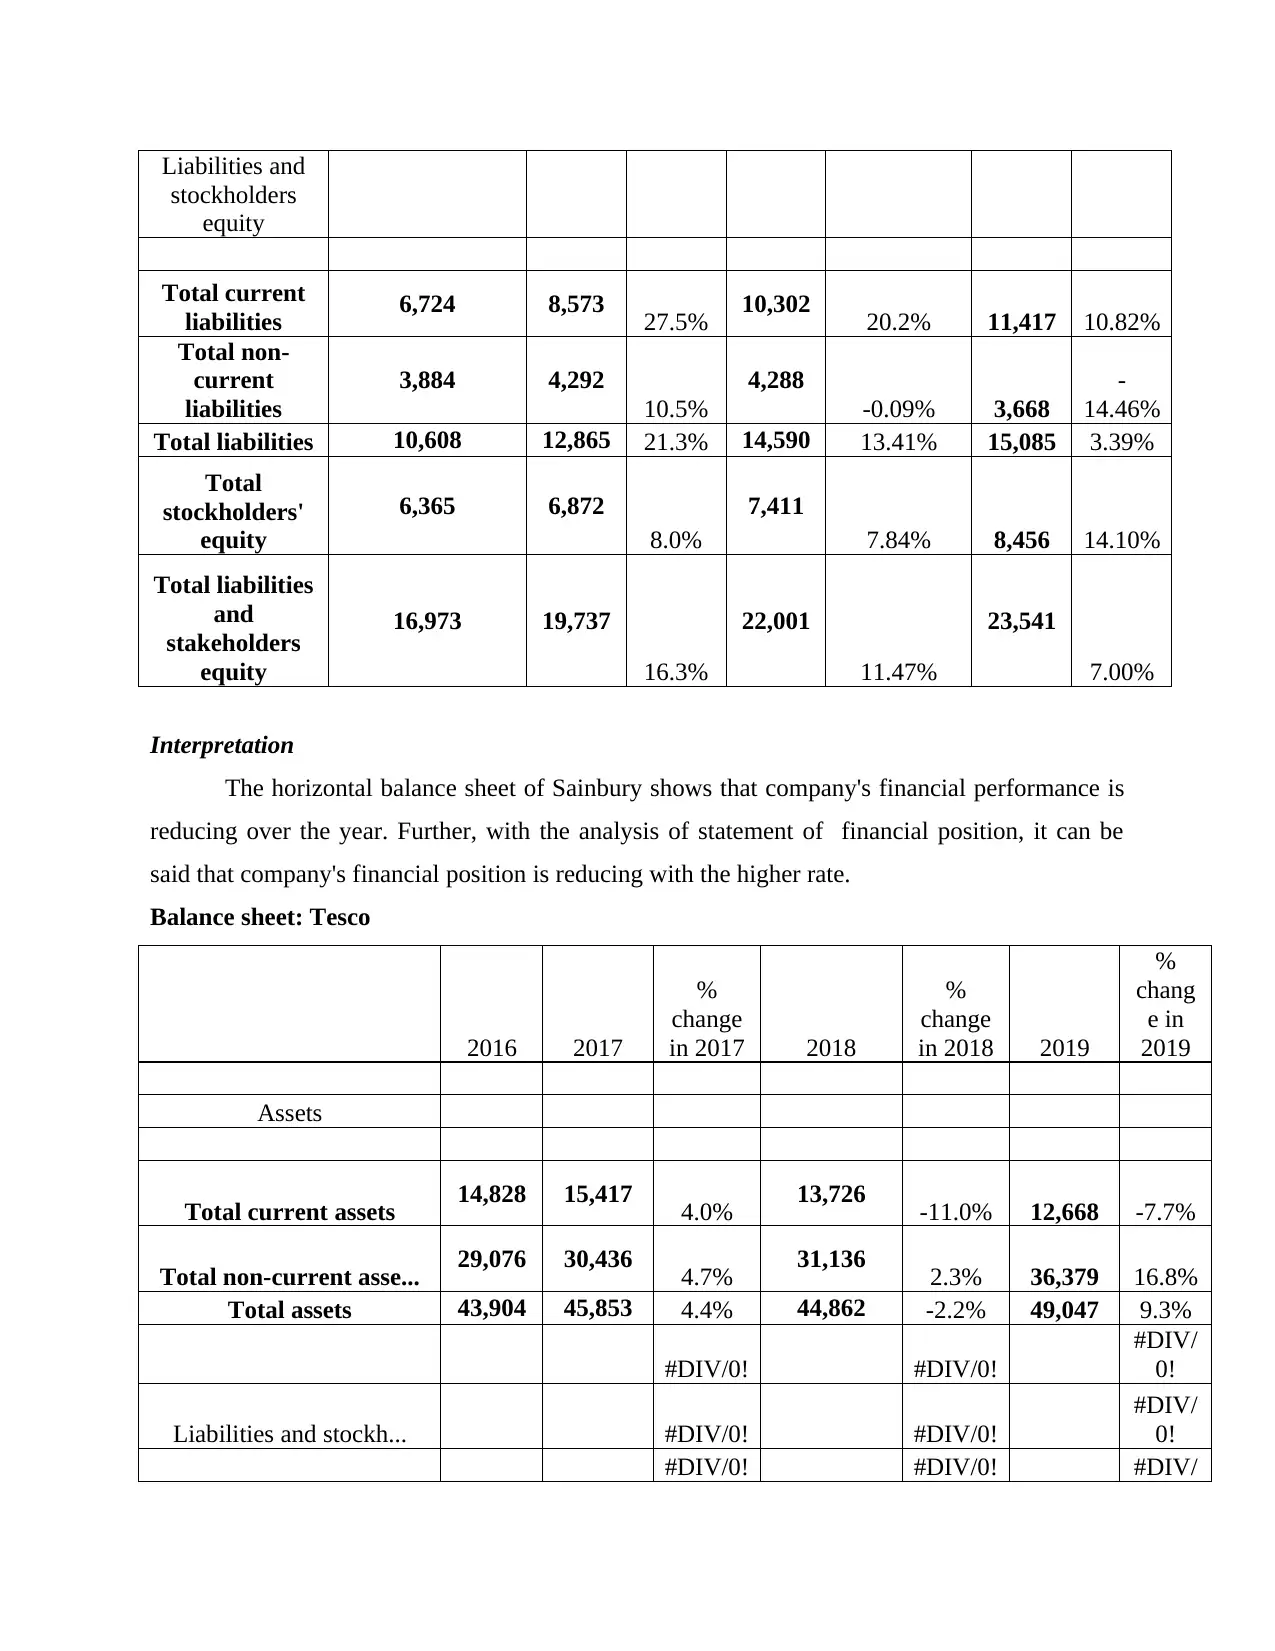
Interpretation
The horizontal balance sheet of Sainbury shows that company's financial performance is
reducing over the year. Further, with the analysis of statement of financial position, it can be
said that company's financial position is reducing with the higher rate.
Balance sheet: Tesco
2016 2017
%
change
in 2017 2018
%
change
in 2018 2019
%
chang
e in
2019
Assets
Total current assets 14,828 15,417 4.0% 13,726 -11.0% 12,668 -7.7%
Total non-current asse... 29,076 30,436 4.7% 31,136 2.3% 36,379 16.8%
Total assets 43,904 45,853 4.4% 44,862 -2.2% 49,047 9.3%
#DIV/0! #DIV/0!
#DIV/
0!
Liabilities and stockh... #DIV/0! #DIV/0!
#DIV/
0!
#DIV/0! #DIV/0! #DIV/
stockholders
equity
Total current
liabilities 6,724 8,573 27.5% 10,302 20.2% 11,417 10.82%
Total non-
current
liabilities
3,884 4,292
10.5%
4,288
-0.09% 3,668
-
14.46%
Total liabilities 10,608 12,865 21.3% 14,590 13.41% 15,085 3.39%
Total
stockholders'
equity
6,365 6,872
8.0%
7,411
7.84% 8,456 14.10%
Total liabilities
and
stakeholders
equity
16,973 19,737
16.3%
22,001
11.47%
23,541
7.00%
Interpretation
The horizontal balance sheet of Sainbury shows that company's financial performance is
reducing over the year. Further, with the analysis of statement of financial position, it can be
said that company's financial position is reducing with the higher rate.
Balance sheet: Tesco
2016 2017
%
change
in 2017 2018
%
change
in 2018 2019
%
chang
e in
2019
Assets
Total current assets 14,828 15,417 4.0% 13,726 -11.0% 12,668 -7.7%
Total non-current asse... 29,076 30,436 4.7% 31,136 2.3% 36,379 16.8%
Total assets 43,904 45,853 4.4% 44,862 -2.2% 49,047 9.3%
#DIV/0! #DIV/0!
#DIV/
0!
Liabilities and stockh... #DIV/0! #DIV/0!
#DIV/
0!
#DIV/0! #DIV/0! #DIV/
Paraphrase This Document
Need a fresh take? Get an instant paraphrase of this document with our AI Paraphraser
0!
Total current liabilit... 19,714 19,405 -1.6% 19,238 -0.9% 20,680 7.5%
Total non-current liab... 15,564 20,010 28.6% 15,144 -24.3% 13,509
-
10.8%
Total liabilities 35,278 39,415 11.7% 34,382 -12.8% 34,189 -0.6%
Total stockholders' equity
8,626 6,438
-25.4%
10,480
62.8% 14,858 41.8%
Total liabilities and
stakeholders equity 43,904 45,853 4.4%
44,862
-2.2% 49,047 9.3%
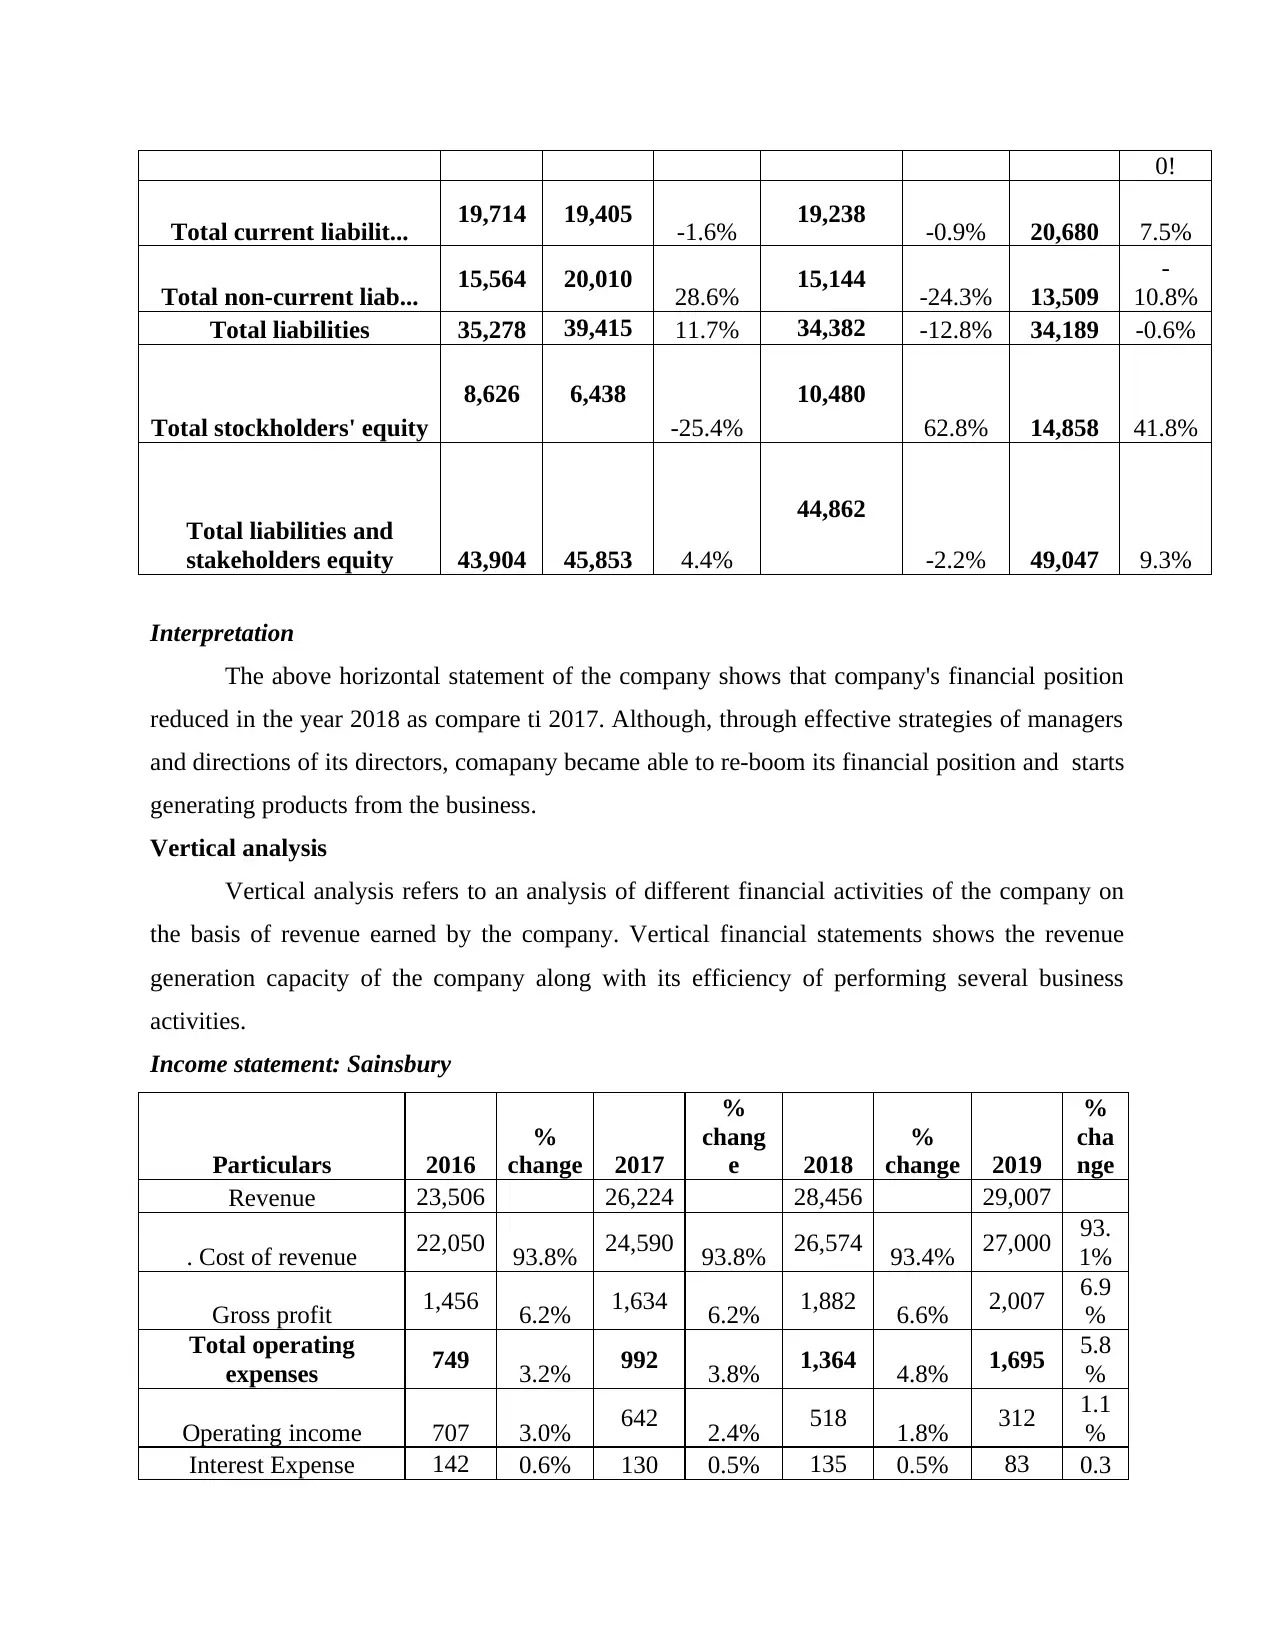
Interpretation
The above horizontal statement of the company shows that company's financial position
reduced in the year 2018 as compare ti 2017. Although, through effective strategies of managers
and directions of its directors, comapany became able to re-boom its financial position and starts
generating products from the business.
Vertical analysis
Vertical analysis refers to an analysis of different financial activities of the company on
the basis of revenue earned by the company. Vertical financial statements shows the revenue
generation capacity of the company along with its efficiency of performing several business
activities.
Income statement: Sainsbury
Particulars 2016
%
change 2017
%
chang
e 2018
%
change 2019
%
cha
nge
Revenue 23,506 26,224 28,456 29,007
. Cost of revenue 22,050 93.8% 24,590 93.8% 26,574 93.4% 27,000 93.
1%
Gross profit 1,456 6.2% 1,634 6.2% 1,882 6.6% 2,007 6.9
%
Total operating
expenses 749 3.2% 992 3.8% 1,364 4.8% 1,695 5.8
%
Operating income 707 3.0% 642 2.4% 518 1.8% 312 1.1
%
Interest Expense 142 0.6% 130 0.5% 135 0.5% 83 0.3
Total current liabilit... 19,714 19,405 -1.6% 19,238 -0.9% 20,680 7.5%
Total non-current liab... 15,564 20,010 28.6% 15,144 -24.3% 13,509
-
10.8%
Total liabilities 35,278 39,415 11.7% 34,382 -12.8% 34,189 -0.6%
Total stockholders' equity
8,626 6,438
-25.4%
10,480
62.8% 14,858 41.8%
Total liabilities and
stakeholders equity 43,904 45,853 4.4%
44,862
-2.2% 49,047 9.3%
Interpretation
The above horizontal statement of the company shows that company's financial position
reduced in the year 2018 as compare ti 2017. Although, through effective strategies of managers
and directions of its directors, comapany became able to re-boom its financial position and starts
generating products from the business.
Vertical analysis
Vertical analysis refers to an analysis of different financial activities of the company on
the basis of revenue earned by the company. Vertical financial statements shows the revenue
generation capacity of the company along with its efficiency of performing several business
activities.
Income statement: Sainsbury
Particulars 2016
%
change 2017
%
chang
e 2018
%
change 2019
%
cha
nge
Revenue 23,506 26,224 28,456 29,007
. Cost of revenue 22,050 93.8% 24,590 93.8% 26,574 93.4% 27,000 93.
1%
Gross profit 1,456 6.2% 1,634 6.2% 1,882 6.6% 2,007 6.9
%
Total operating
expenses 749 3.2% 992 3.8% 1,364 4.8% 1,695 5.8
%
Operating income 707 3.0% 642 2.4% 518 1.8% 312 1.1
%
Interest Expense 142 0.6% 130 0.5% 135 0.5% 83 0.3
%
Other income 0.0% 0.0% 26 0.1% 10 0.0
%
Other expenses 17 0.1% 9 0.0% 0.0%
0.0
%
Income before income
t... 548 2.3% 503 1.9% 409 1.4% 239 0.8
%
Provision for income t... 77 0.3% 126 0.5% 100 0.4% 20 0.1
%
Net income 471 2.0% 377 1.4% 309 1.1% 219
0.8
%
Income statement: Tesco
Particulars 2016
%
change 2017 % change 2018
%
change 2019
%
chan
e
Revenue 54,433 100.00
% 55,917 100.00% 57,491 100.00% 63,911 100.0
%
Cost of revenue 51,579 94.76% 53,015 94.81% 54,141 94.17% 59,767 93.5
%
Gross profit 2,854 5.24% 2,902 5.19% 3,350 5.83% 4,144 6.48%
Total operating expenses 1,874 3.44% 1,734 3.10% 1,786 3.11% 2,067 3.23%
Operating income 980 1.80% 1,168 2.09% 1,564 2.72% 2,077 3.25%
Interest Expense 498 0.91% 517 0.92% 431 0.75% 294 0.46%
Other income 0.00% 0.00% 165 0.29% 0.00%
Other expenses 320 0.59% 506 0.90% 0 0.00% 109 0.17%
Income before income t... 162 0.30% 145 0.26% 1,298 2.26% 1,674 2.62%
Provision for income t... -54 -0.10% 87 0.16% 306 0.53% 354 0.55%
Net income 138 0.25% -40 -0.07% 1,206 2.10% 1,322 2.07%
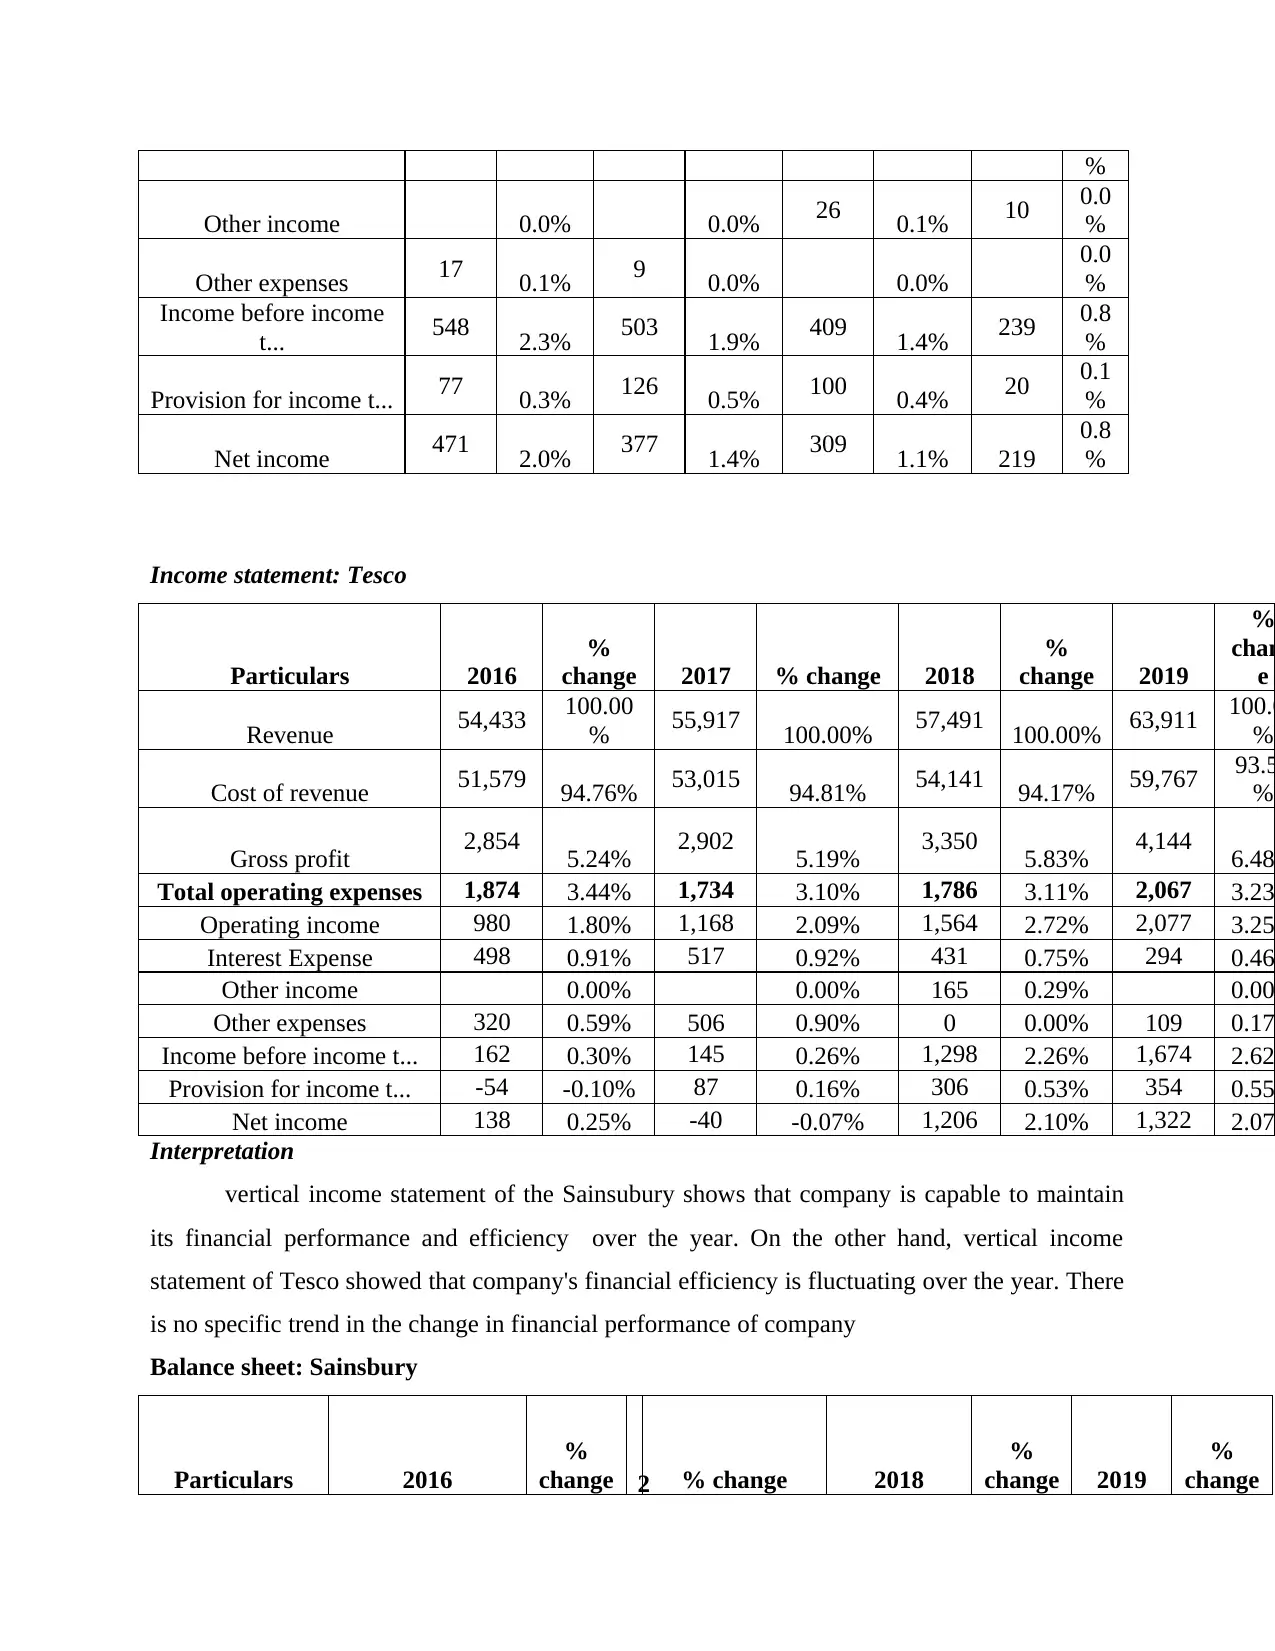
Interpretation
vertical income statement of the Sainsubury shows that company is capable to maintain
its financial performance and efficiency over the year. On the other hand, vertical income
statement of Tesco showed that company's financial efficiency is fluctuating over the year. There
is no specific trend in the change in financial performance of company
Balance sheet: Sainsbury
Particulars 2016
%
change 2 % change 2018
%
change 2019
%
change
Other income 0.0% 0.0% 26 0.1% 10 0.0
%
Other expenses 17 0.1% 9 0.0% 0.0%
0.0
%
Income before income
t... 548 2.3% 503 1.9% 409 1.4% 239 0.8
%
Provision for income t... 77 0.3% 126 0.5% 100 0.4% 20 0.1
%
Net income 471 2.0% 377 1.4% 309 1.1% 219
0.8
%
Income statement: Tesco
Particulars 2016
%
change 2017 % change 2018
%
change 2019
%
chan
e
Revenue 54,433 100.00
% 55,917 100.00% 57,491 100.00% 63,911 100.0
%
Cost of revenue 51,579 94.76% 53,015 94.81% 54,141 94.17% 59,767 93.5
%
Gross profit 2,854 5.24% 2,902 5.19% 3,350 5.83% 4,144 6.48%
Total operating expenses 1,874 3.44% 1,734 3.10% 1,786 3.11% 2,067 3.23%
Operating income 980 1.80% 1,168 2.09% 1,564 2.72% 2,077 3.25%
Interest Expense 498 0.91% 517 0.92% 431 0.75% 294 0.46%
Other income 0.00% 0.00% 165 0.29% 0.00%
Other expenses 320 0.59% 506 0.90% 0 0.00% 109 0.17%
Income before income t... 162 0.30% 145 0.26% 1,298 2.26% 1,674 2.62%
Provision for income t... -54 -0.10% 87 0.16% 306 0.53% 354 0.55%
Net income 138 0.25% -40 -0.07% 1,206 2.10% 1,322 2.07%
Interpretation
vertical income statement of the Sainsubury shows that company is capable to maintain
its financial performance and efficiency over the year. On the other hand, vertical income
statement of Tesco showed that company's financial efficiency is fluctuating over the year. There
is no specific trend in the change in financial performance of company
Balance sheet: Sainsbury
Particulars 2016
%
change 2 % change 2018
%
change 2019
%
change
⊘ This is a preview!⊘
Do you want full access?
Subscribe today to unlock all pages.
Trusted by 1+ million students worldwide
1 out of 31
Related Documents


Your All-in-One AI-Powered Toolkit for Academic Success.
+13062052269
info@desklib.com
Available 24*7 on WhatsApp / Email
![[object Object]](/_next/static/media/star-bottom.7253800d.svg)
Unlock your academic potential
Copyright © 2020–2026 A2Z Services. All Rights Reserved. Developed and managed by ZUCOL.