Financial Ratio Analysis and Capital Investment Appraisal Report

Verified

Added on  2020/06/04

|23
|4245
|82
Report
AI Summary
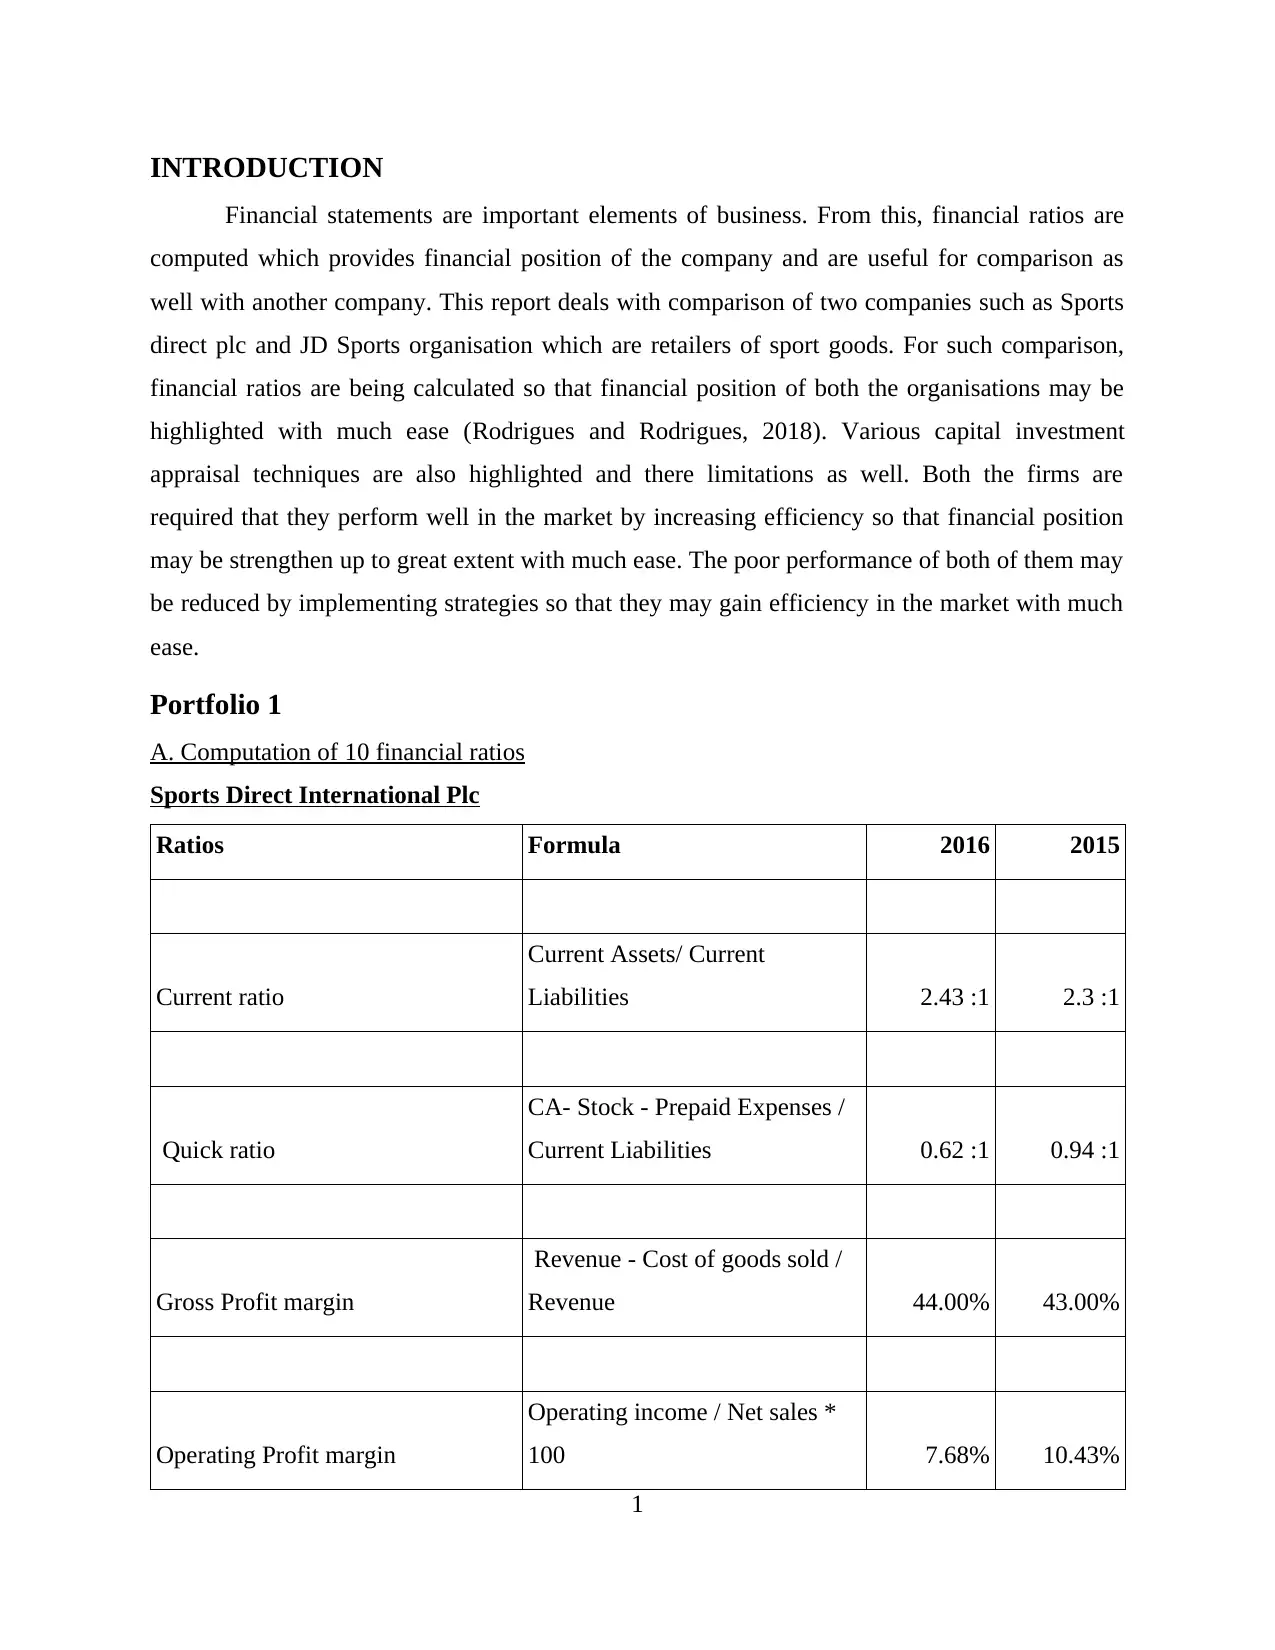
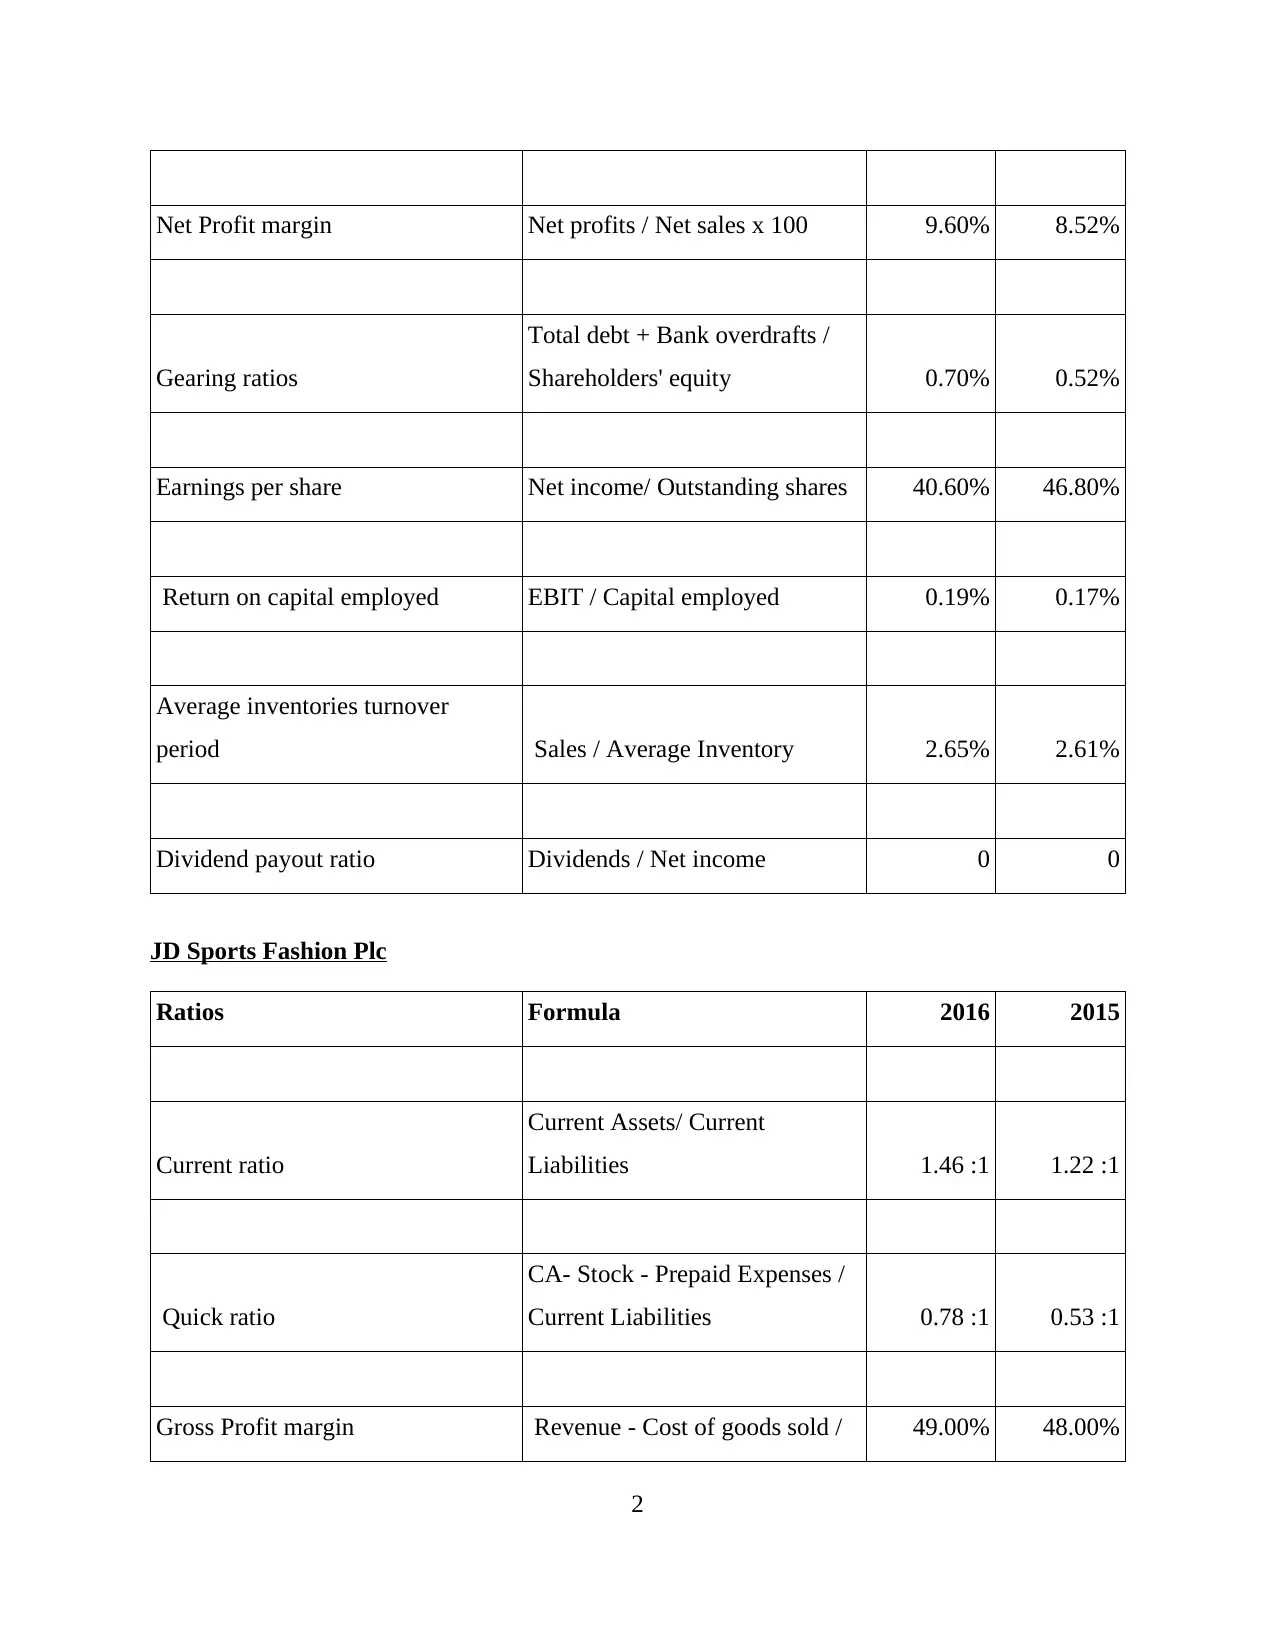
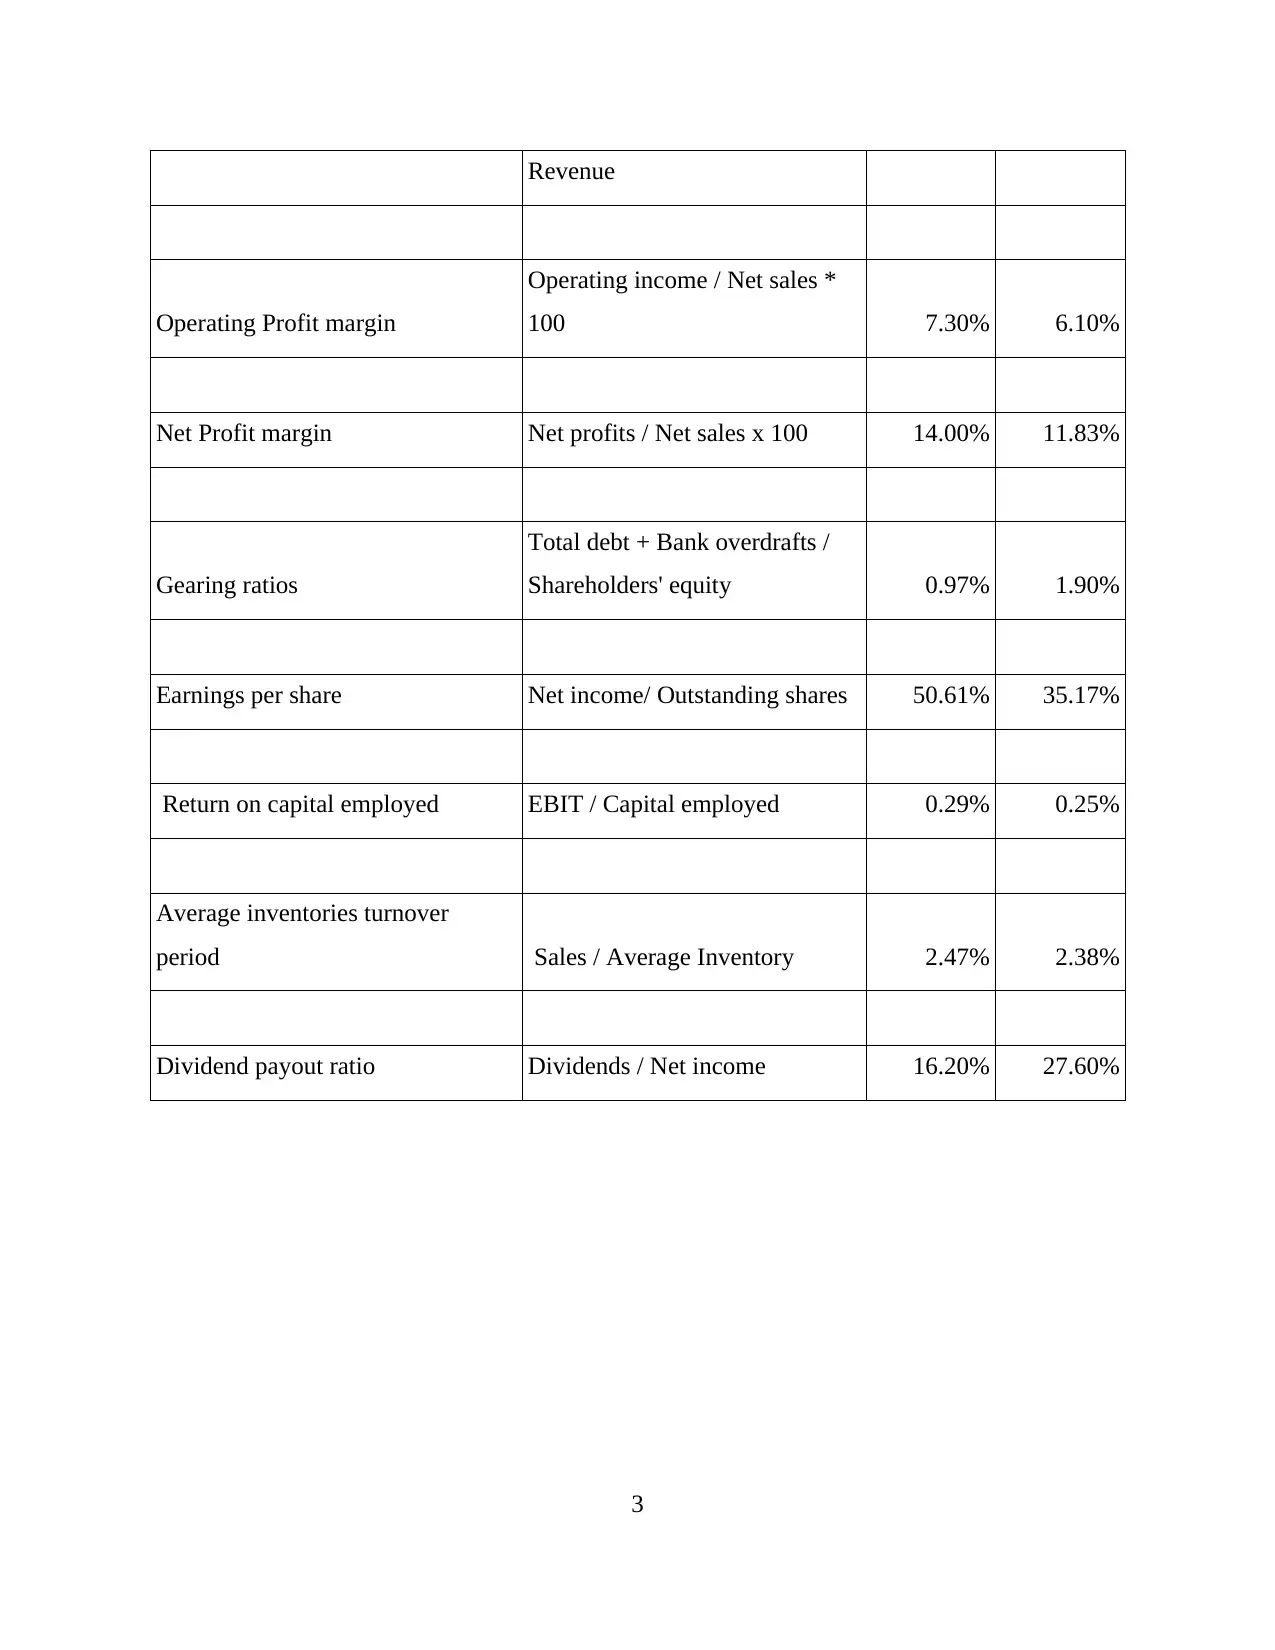
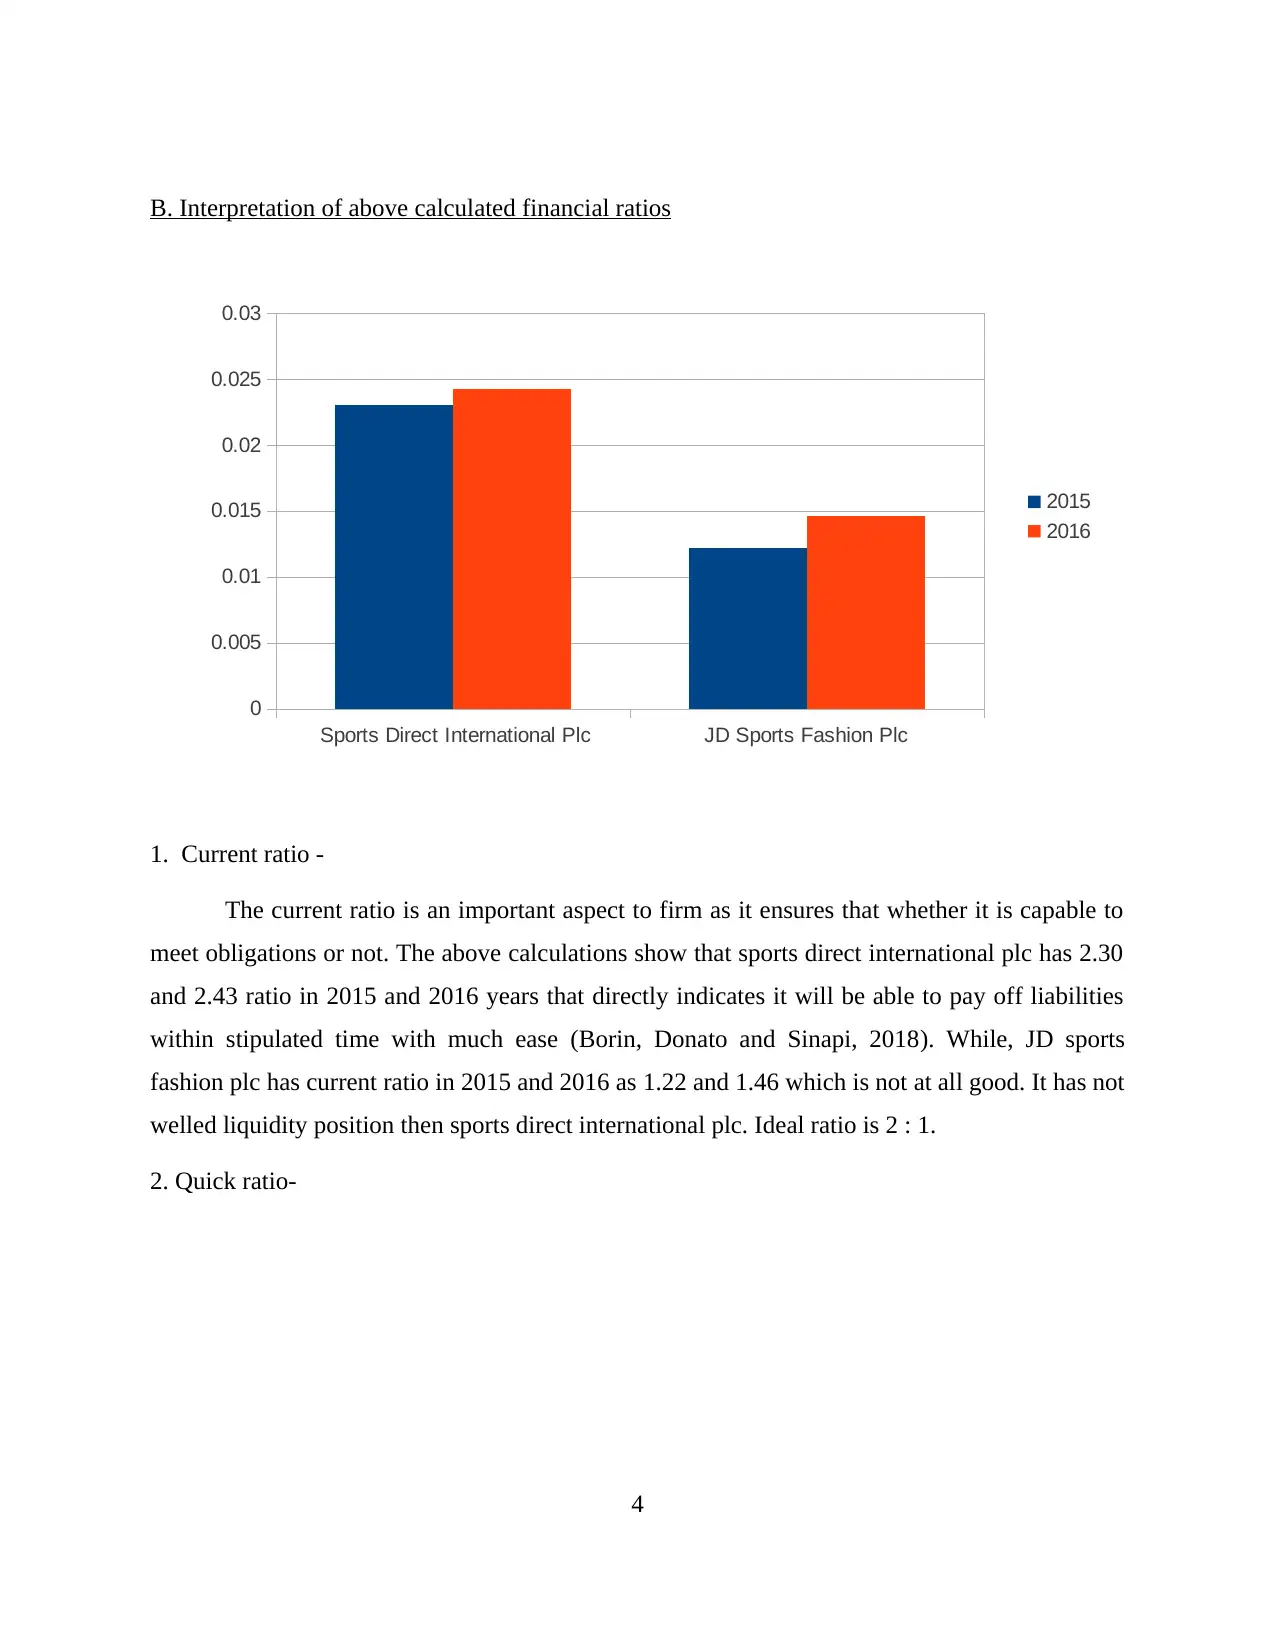
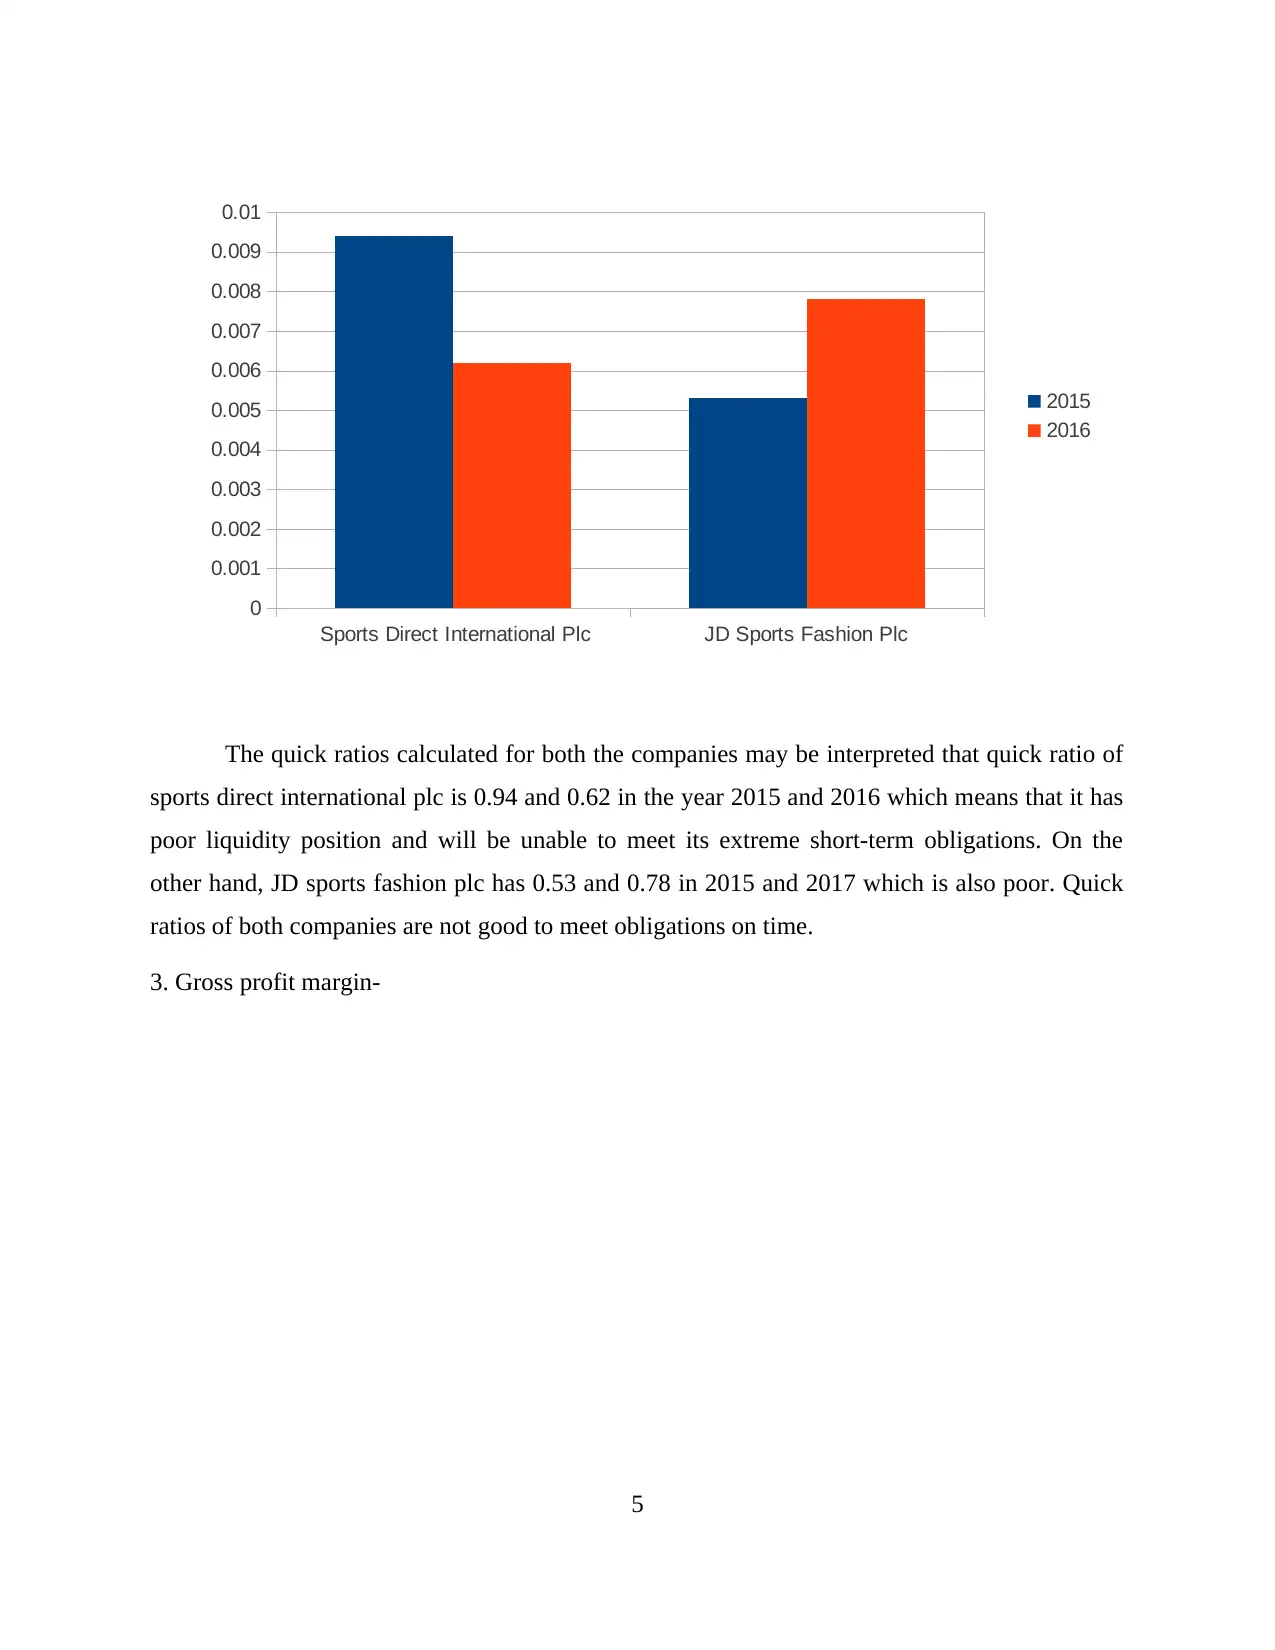
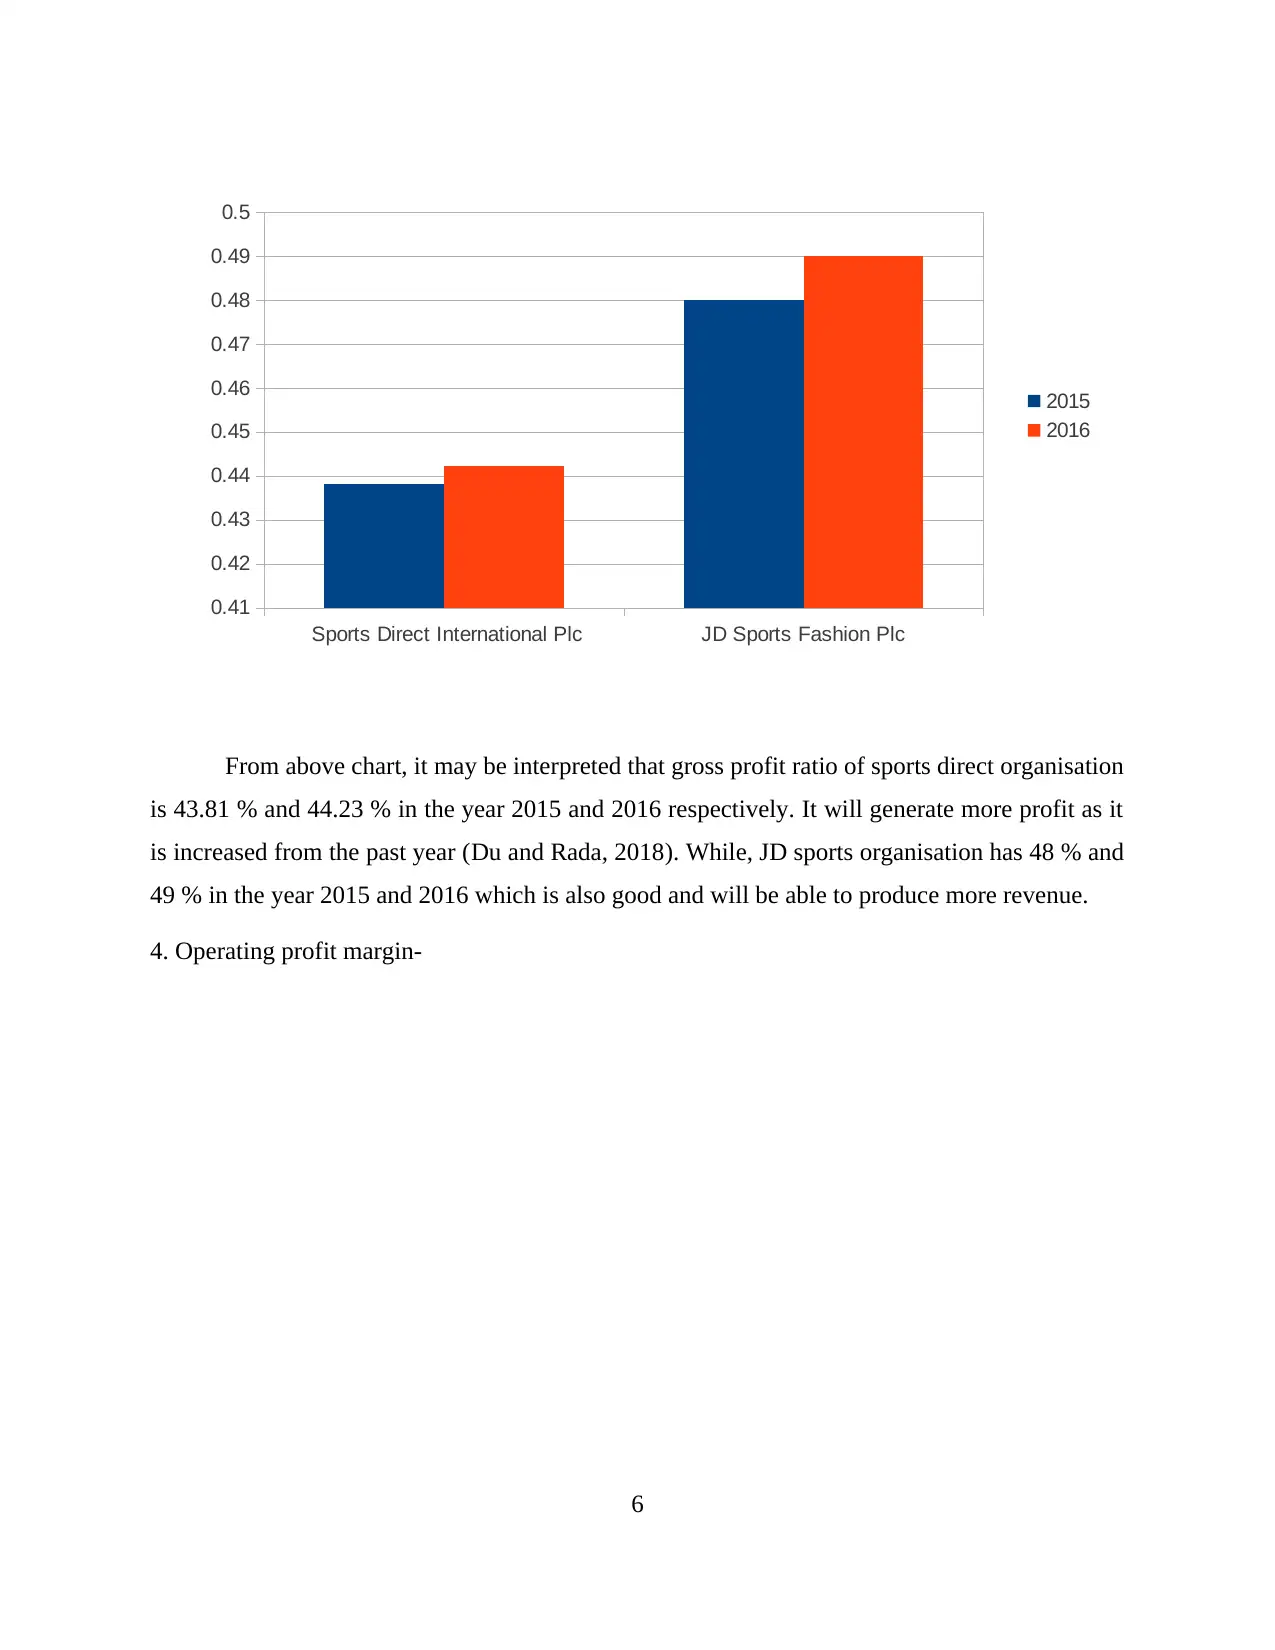
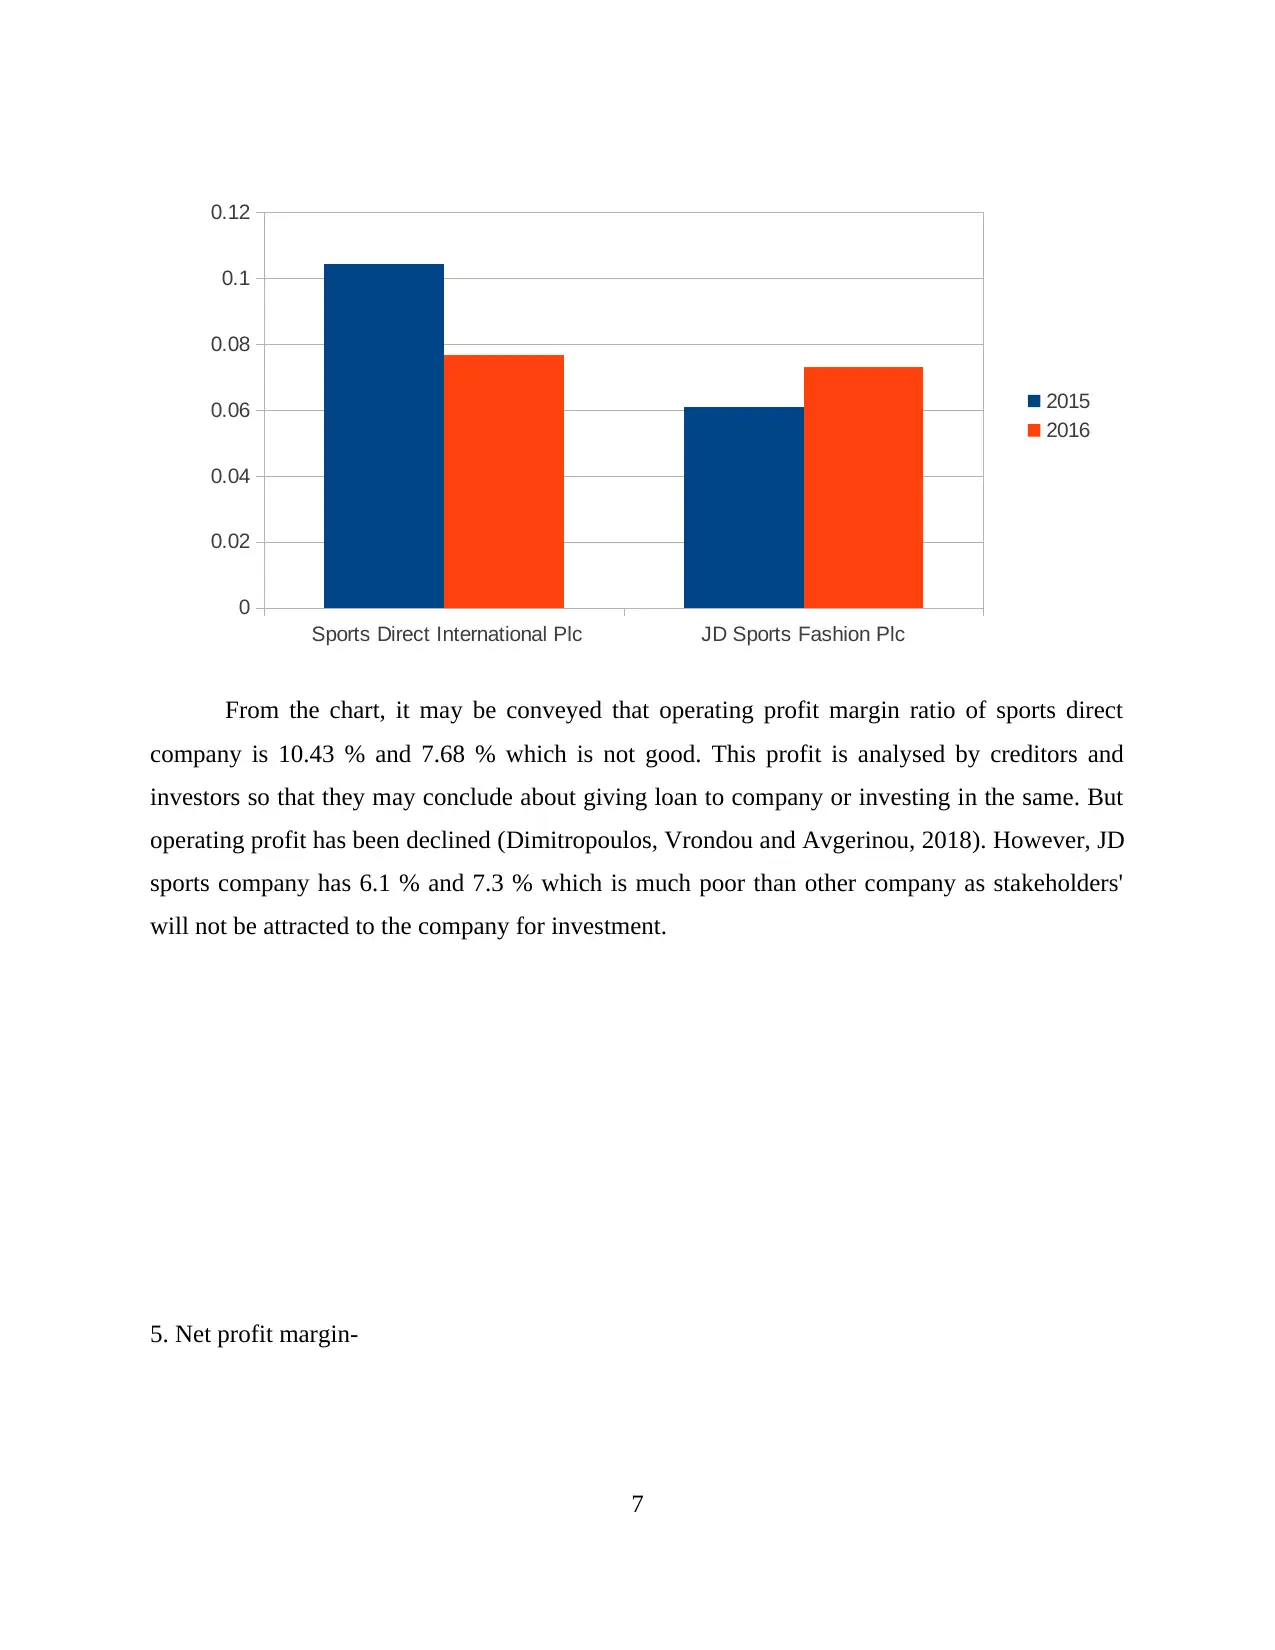
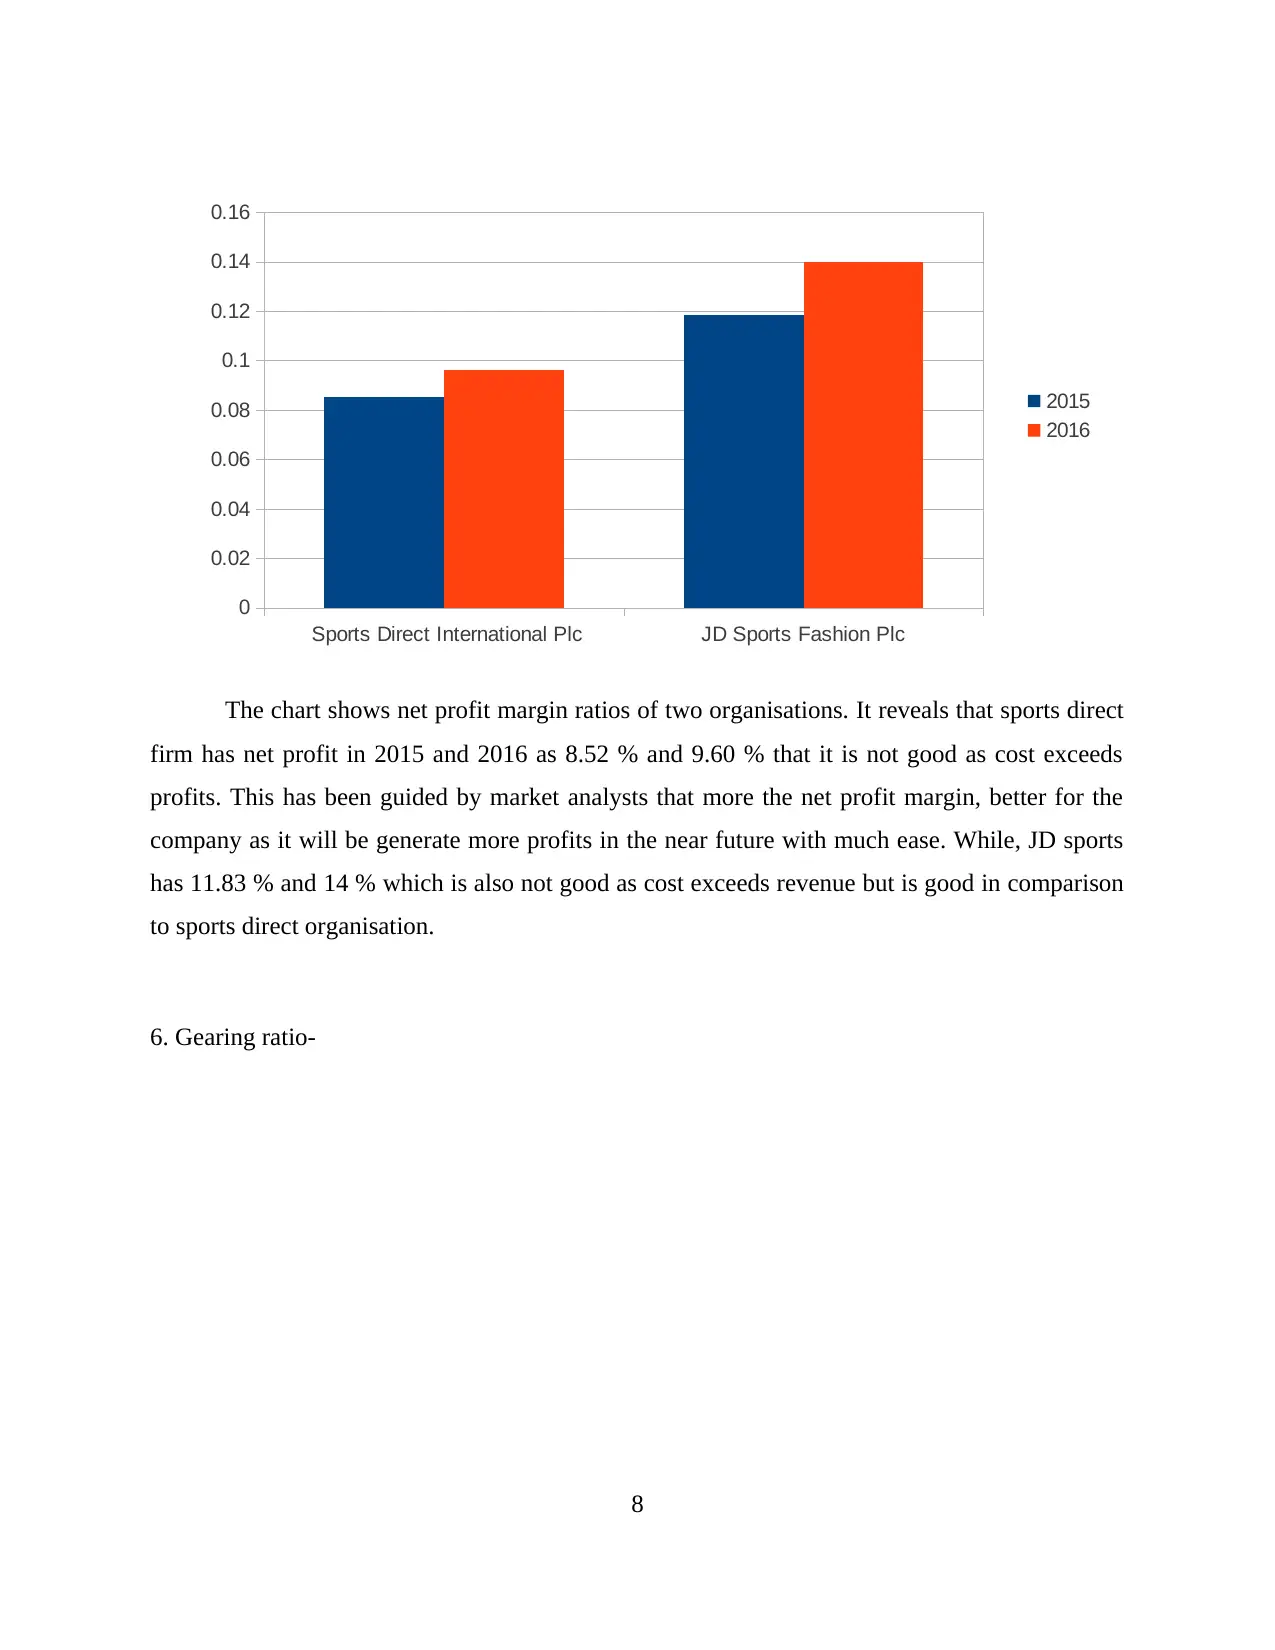
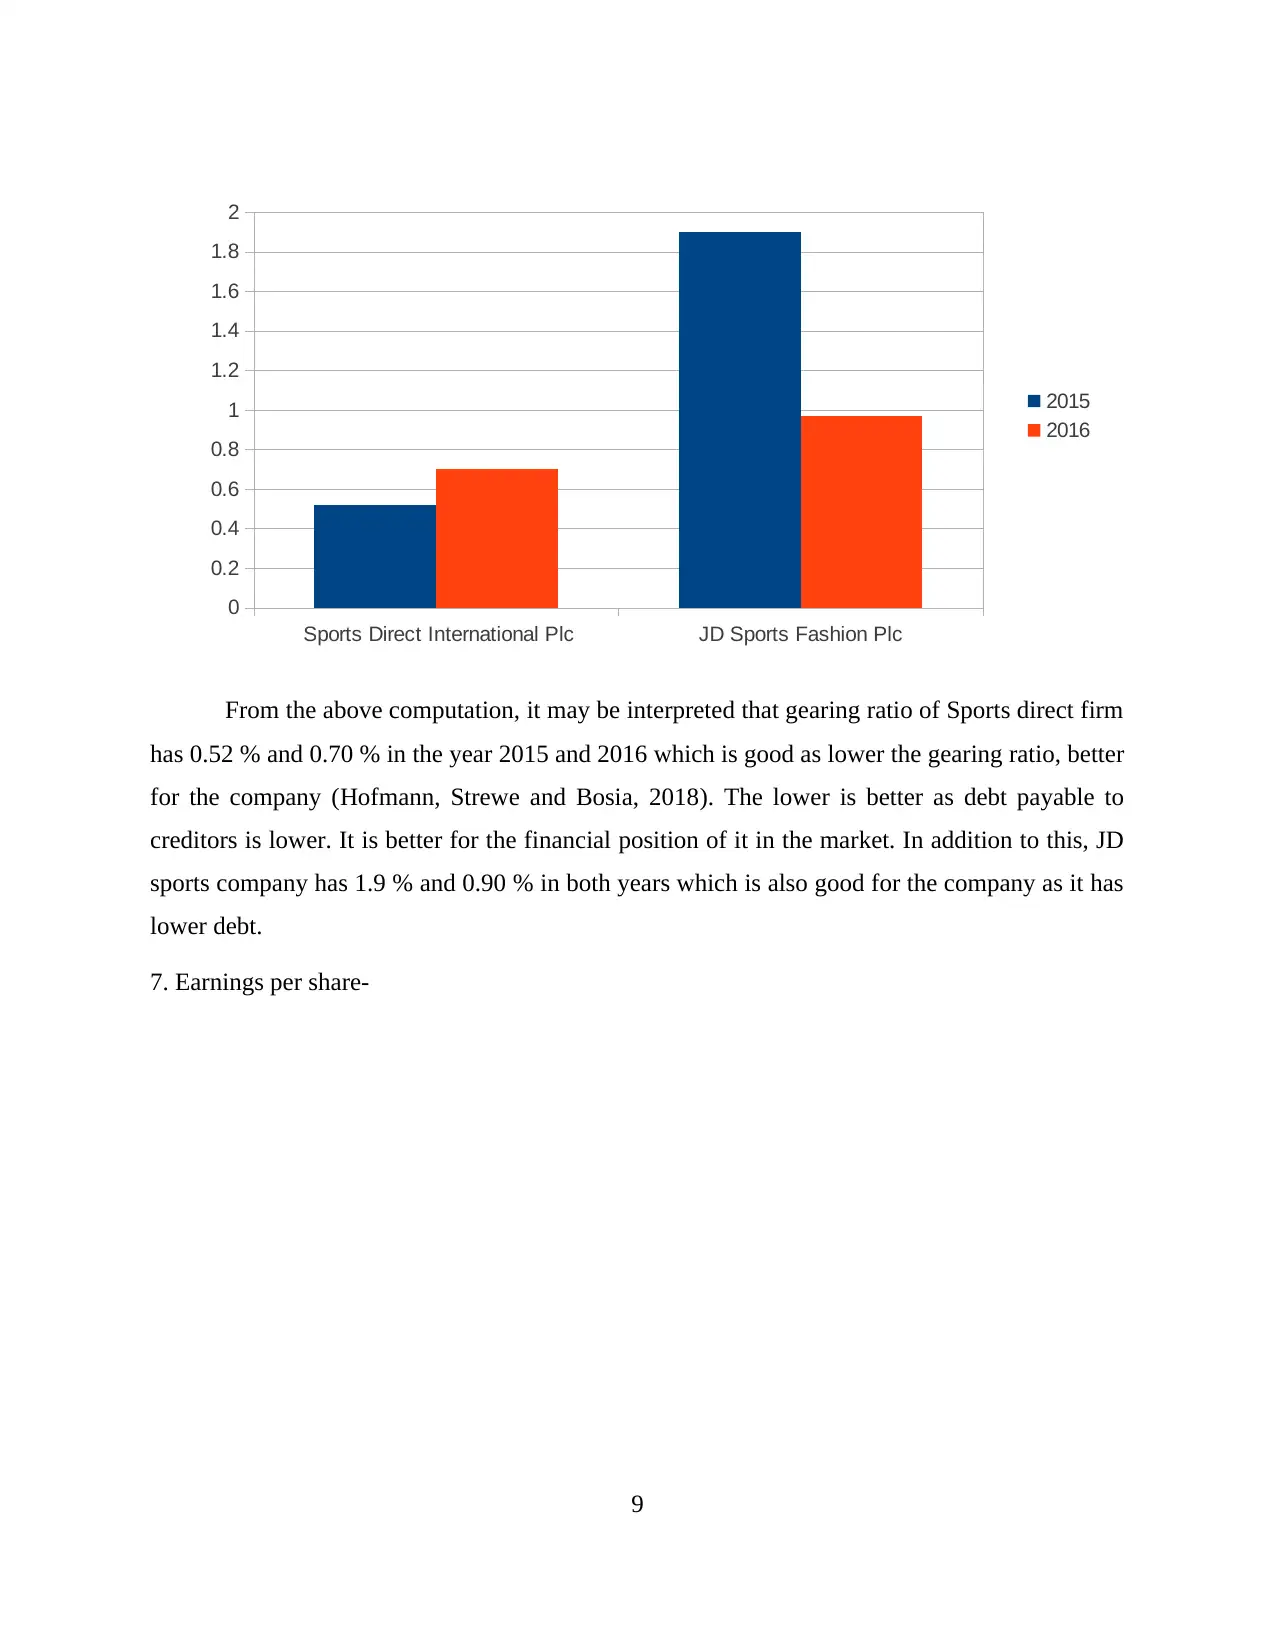
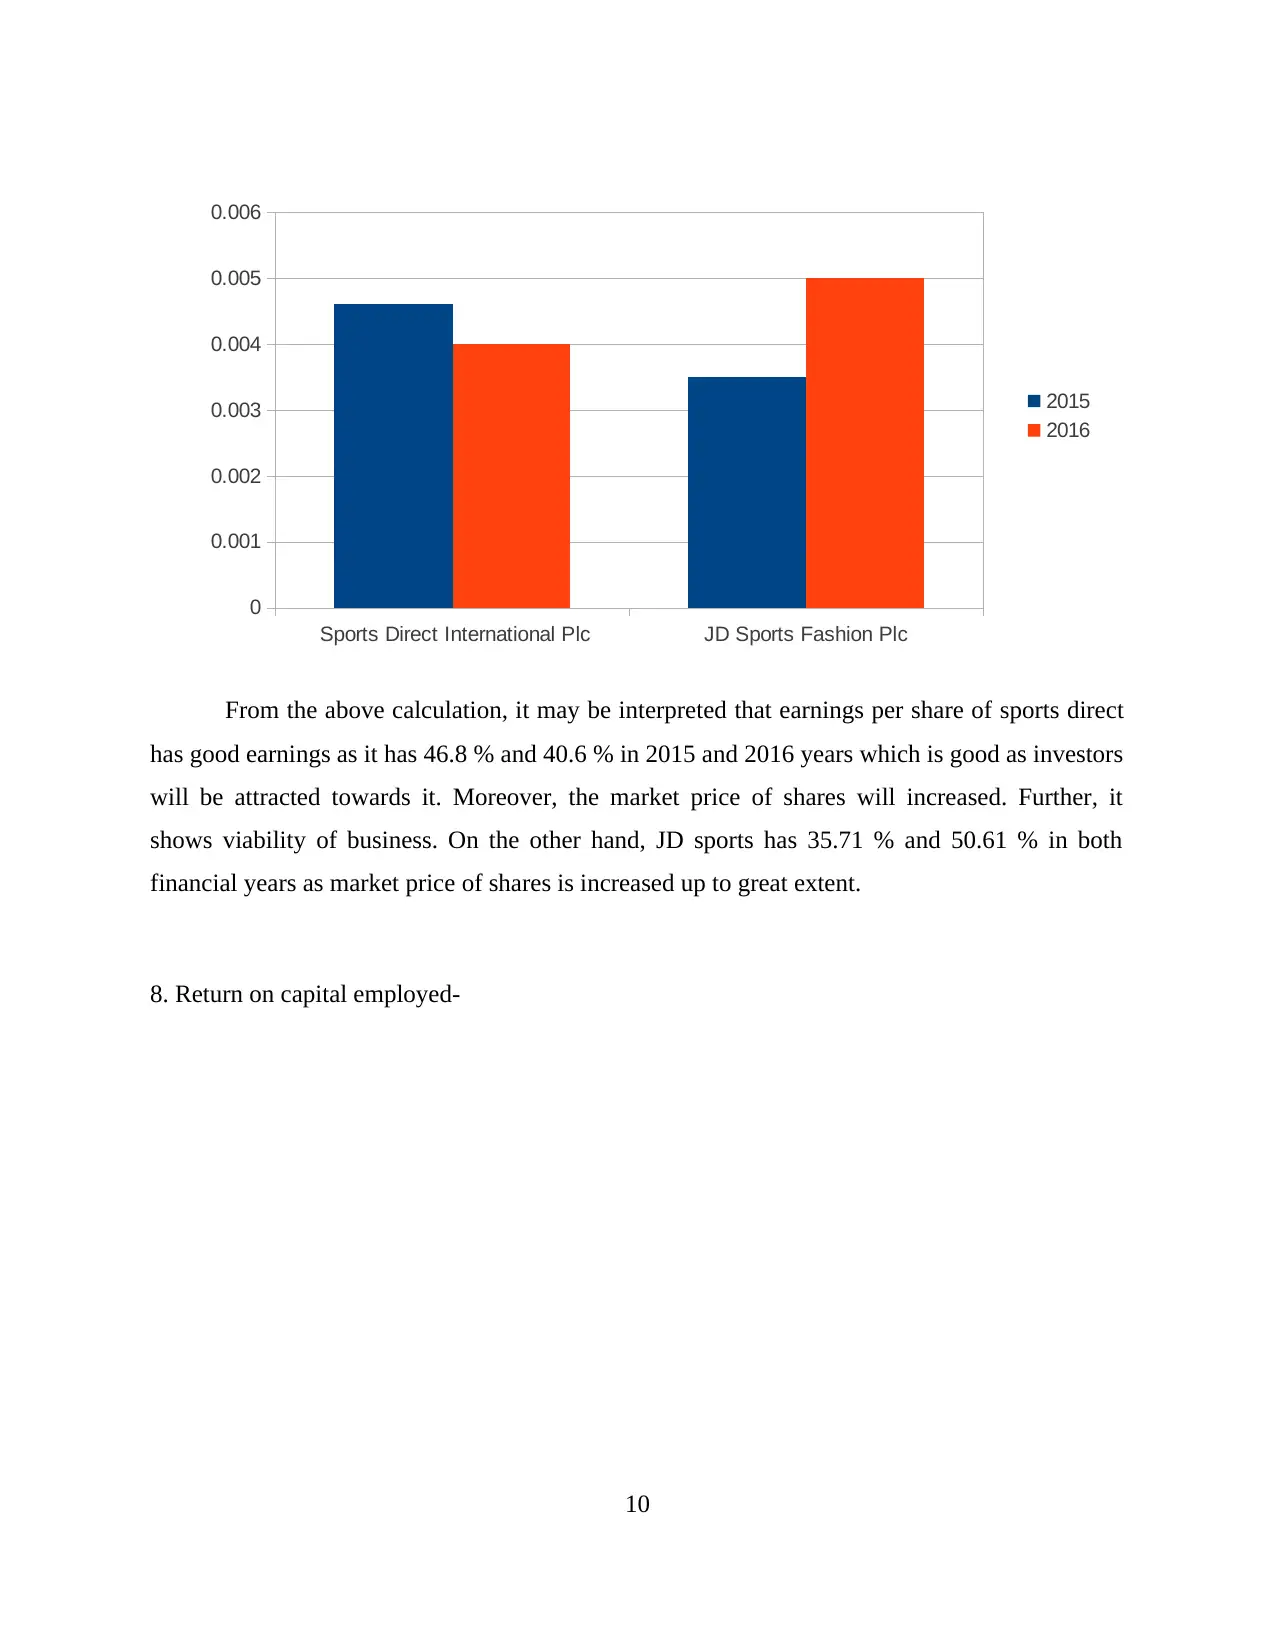
This report presents a comprehensive financial analysis of Sports Direct and JD Sports, two prominent retailers. It begins with a detailed computation of ten key financial ratios for both companies, including current ratio, quick ratio, gross profit margin, operating profit margin, net profit margin, gearing ratio, earnings per share, return on capital employed, average inventory turnover period, and dividend payout ratio. The analysis extends to an in-depth interpretation of these ratios, highlighting the financial strengths and weaknesses of each company. Furthermore, the report offers strategic recommendations to enhance the performance of both organizations, addressing areas such as current and quick ratios, gross profit margin, operating profit margin, earnings per share, stock turnover ratio, gearing ratios, and dividend payout ratio. The report also discusses the limitations inherent in using financial ratios. Finally, the report includes capital investment appraisal techniques such as NPV, ARR, and payback period calculations, along with their limitations. The report concludes by summarizing the key findings and recommendations, supported by a complete list of references.
Document Page
Portfolio-Case Study
tabler-icon-diamond-filled.svg

Paraphrase This Document

Need a fresh take? Get an instant paraphrase of this document with our AI Paraphraser
Document Page
TABLE OF CONTENTS
INTRODUCTION...........................................................................................................................1
Portfolio 1........................................................................................................................................1
A. Computation of 10 financial ratios....................................................................................1
B. Interpretation of above calculated financial ratios.............................................................3
C. Recommendations to increase performance of companies..............................................13
D. Discuss limitations of ratios............................................................................................14
Portfolio 2......................................................................................................................................15
Capital Investment Appraisal ........................................................................................................15
A. NPV, ARR and Payback period calculations..................................................................15
B. Limitations of the investment appraisal...........................................................................18
CONCLUSION..............................................................................................................................19
REFERENCES..............................................................................................................................20
Document Page
INTRODUCTION
Financial statements are important elements of business. From this, financial ratios are
computed which provides financial position of the company and are useful for comparison as
well with another company. This report deals with comparison of two companies such as Sports
direct plc and JD Sports organisation which are retailers of sport goods. For such comparison,
financial ratios are being calculated so that financial position of both the organisations may be
highlighted with much ease (Rodrigues and Rodrigues, 2018). Various capital investment
appraisal techniques are also highlighted and there limitations as well. Both the firms are
required that they perform well in the market by increasing efficiency so that financial position
may be strengthen up to great extent with much ease. The poor performance of both of them may
be reduced by implementing strategies so that they may gain efficiency in the market with much
ease.
Portfolio 1
A. Computation of 10 financial ratios
Sports Direct International Plc
Ratios Formula 2016 2015
Current ratio
Current Assets/ Current
Liabilities 2.43 :1 2.3 :1
Quick ratio
CA- Stock - Prepaid Expenses /
Current Liabilities 0.62 :1 0.94 :1
Gross Profit margin
Revenue - Cost of goods sold /
Revenue 44.00% 43.00%
Operating Profit margin
Operating income / Net sales *
100 7.68% 10.43%
1
Document Page
Net Profit margin Net profits / Net sales x 100 9.60% 8.52%
Gearing ratios
Total debt + Bank overdrafts /
Shareholders' equity 0.70% 0.52%
Earnings per share Net income/ Outstanding shares 40.60% 46.80%
Return on capital employed EBIT / Capital employed 0.19% 0.17%
Average inventories turnover
period Sales / Average Inventory 2.65% 2.61%
Dividend payout ratio Dividends / Net income 0 0
JD Sports Fashion Plc
Ratios Formula 2016 2015
Current ratio
Current Assets/ Current
Liabilities 1.46 :1 1.22 :1
Quick ratio
CA- Stock - Prepaid Expenses /
Current Liabilities 0.78 :1 0.53 :1
Gross Profit margin Revenue - Cost of goods sold / 49.00% 48.00%
2
tabler-icon-diamond-filled.svg

Paraphrase This Document

Need a fresh take? Get an instant paraphrase of this document with our AI Paraphraser
Document Page
Revenue
Operating Profit margin
Operating income / Net sales *
100 7.30% 6.10%
Net Profit margin Net profits / Net sales x 100 14.00% 11.83%
Gearing ratios
Total debt + Bank overdrafts /
Shareholders' equity 0.97% 1.90%
Earnings per share Net income/ Outstanding shares 50.61% 35.17%
Return on capital employed EBIT / Capital employed 0.29% 0.25%
Average inventories turnover
period Sales / Average Inventory 2.47% 2.38%
Dividend payout ratio Dividends / Net income 16.20% 27.60%
3
Document Page
B. Interpretation of above calculated financial ratios
1. Current ratio -
The current ratio is an important aspect to firm as it ensures that whether it is capable to
meet obligations or not. The above calculations show that sports direct international plc has 2.30
and 2.43 ratio in 2015 and 2016 years that directly indicates it will be able to pay off liabilities
within stipulated time with much ease (Borin, Donato and Sinapi, 2018). While, JD sports
fashion plc has current ratio in 2015 and 2016 as 1.22 and 1.46 which is not at all good. It has not
welled liquidity position then sports direct international plc. Ideal ratio is 2 : 1.
2. Quick ratio-
4
Sports Direct International Plc JD Sports Fashion Plc
0
0.005
0.01
0.015
0.02
0.025
0.03
2015
2016
Document Page
The quick ratios calculated for both the companies may be interpreted that quick ratio of
sports direct international plc is 0.94 and 0.62 in the year 2015 and 2016 which means that it has
poor liquidity position and will be unable to meet its extreme short-term obligations. On the
other hand, JD sports fashion plc has 0.53 and 0.78 in 2015 and 2017 which is also poor. Quick
ratios of both companies are not good to meet obligations on time.
3. Gross profit margin-
5
Sports Direct International Plc JD Sports Fashion Plc
0
0.001
0.002
0.003
0.004
0.005
0.006
0.007
0.008
0.009
0.01
2015
2016
tabler-icon-diamond-filled.svg

Paraphrase This Document

Need a fresh take? Get an instant paraphrase of this document with our AI Paraphraser
Document Page
From above chart, it may be interpreted that gross profit ratio of sports direct organisation
is 43.81 % and 44.23 % in the year 2015 and 2016 respectively. It will generate more profit as it
is increased from the past year (Du and Rada, 2018). While, JD sports organisation has 48 % and
49 % in the year 2015 and 2016 which is also good and will be able to produce more revenue.
4. Operating profit margin-
6
Sports Direct International Plc JD Sports Fashion Plc
0.41
0.42
0.43
0.44
0.45
0.46
0.47
0.48
0.49
0.5
2015
2016
Document Page
From the chart, it may be conveyed that operating profit margin ratio of sports direct
company is 10.43 % and 7.68 % which is not good. This profit is analysed by creditors and
investors so that they may conclude about giving loan to company or investing in the same. But
operating profit has been declined (Dimitropoulos, Vrondou and Avgerinou, 2018). However, JD
sports company has 6.1 % and 7.3 % which is much poor than other company as stakeholders'
will not be attracted to the company for investment.
5. Net profit margin-
7
Sports Direct International Plc JD Sports Fashion Plc
0
0.02
0.04
0.06
0.08
0.1
0.12
2015
2016
Document Page
The chart shows net profit margin ratios of two organisations. It reveals that sports direct
firm has net profit in 2015 and 2016 as 8.52 % and 9.60 % that it is not good as cost exceeds
profits. This has been guided by market analysts that more the net profit margin, better for the
company as it will be generate more profits in the near future with much ease. While, JD sports
has 11.83 % and 14 % which is also not good as cost exceeds revenue but is good in comparison
to sports direct organisation.
6. Gearing ratio-
8
Sports Direct International Plc JD Sports Fashion Plc
0
0.02
0.04
0.06
0.08
0.1
0.12
0.14
0.16
2015
2016
tabler-icon-diamond-filled.svg

Paraphrase This Document

Need a fresh take? Get an instant paraphrase of this document with our AI Paraphraser
Document Page
From the above computation, it may be interpreted that gearing ratio of Sports direct firm
has 0.52 % and 0.70 % in the year 2015 and 2016 which is good as lower the gearing ratio, better
for the company (Hofmann, Strewe and Bosia, 2018). The lower is better as debt payable to
creditors is lower. It is better for the financial position of it in the market. In addition to this, JD
sports company has 1.9 % and 0.90 % in both years which is also good for the company as it has
lower debt.
7. Earnings per share-
9
Sports Direct International Plc JD Sports Fashion Plc
0
0.2
0.4
0.6
0.8
1
1.2
1.4
1.6
1.8
2
2015
2016
Document Page
From the above calculation, it may be interpreted that earnings per share of sports direct
has good earnings as it has 46.8 % and 40.6 % in 2015 and 2016 years which is good as investors
will be attracted towards it. Moreover, the market price of shares will increased. Further, it
shows viability of business. On the other hand, JD sports has 35.71 % and 50.61 % in both
financial years as market price of shares is increased up to great extent.
8. Return on capital employed-
10
Sports Direct International Plc JD Sports Fashion Plc
0
0.001
0.002
0.003
0.004
0.005
0.006
2015
2016
chevron_up_icon
1 out of 23
circle_padding
hide_on_mobile
zoom_out_icon
[object Object]