Financial Accounting Report: Unilever vs. Nestle Performance Analysis
VerifiedAdded on 2021/01/02
|10
|2594
|90
Report
AI Summary
This report provides a detailed analysis of financial accounting principles, focusing on management performance evaluation through the comparison of Unilever and Nestle, two major consumer goods companies. The executive summary highlights key concepts and findings, including the use of financial ratios to assess profitability and asset utilization. The report examines operational profitability and return on capital employed for both companies, revealing that Unilever demonstrates stronger performance, particularly in operating margins and asset efficiency, compared to Nestle. The analysis considers factors such as revenue, operating profit, and capital employed to provide a comprehensive understanding of each company's financial health and management effectiveness. The report concludes that financial reporting is crucial in evaluating management performance and that Unilever outperforms Nestle in the consumer goods sector based on the analyzed metrics. Supporting data, including ratio calculations, is presented in the appendices.

FINANCIAL ACCOUNTING
Management Accounting
Management Accounting
Paraphrase This Document
Need a fresh take? Get an instant paraphrase of this document with our AI Paraphraser
EXECUTIVE SUMMARY
This report summarizes the key concepts related to financial accounting such as
Management Performance. In addition to this, two consumer goods sector companies, Unilever
and Nestlé, have been compared to understand how they operate and perform on the criteria.
This report analyses two companies and infers that Unilever is much stronger performer as
compared to Nestlé as it has been experiencing a positive trend in most of its financial variables
such as operating margin and use of assets. Internal analysis shows that this company has been
showing stronger stance even in the areas where Nestlé has proven to be having a positive trend.
Table of Contents
EXECUTIVE SUMMARY.............................................................................................................1
INTRODUCTION...........................................................................................................................2
MANAGEMENT PERFORMANCE..............................................................................................3
CONCLUSION................................................................................................................................4
REFERENCES................................................................................................................................5
APPENDICES.................................................................................................................................6
⊘ This is a preview!⊘
Do you want full access?
Subscribe today to unlock all pages.
Trusted by 1+ million students worldwide
INTRODUCTION
Financial Accounting refers to an accounting discipline that focuses on identifying,
recording, summarizing and presenting monetary transactions in a systematic manner usually in
the form of Income, Cash Flow Statement and Balance Sheet (Lutz, 2012). The main aim of this
report is to compare two consumers’ goods-based companies, Unilever and Nestlé based on their
financial ratios to measure performance in both companies.
In this report, ratio analysis as a quantitative study of data has done by considering
organisation's financial statements. Ratios for managing performance such as return on capital
employed and operational profit are analysed and described in this report.
MANAGEMENT PERFORMANCE
Management performance can be defined as a yardstick to measure monetary as well as
non-monetary activities and tasks carried out by the management of the company in a given
accounting period to help analyse the extent to which the company was able to contribute in
achieving its goals (Oikonomou, Brooks and Pavelin, 2012). Investors and lenders are mainly
concerned with how well the business performs to ascertain business' success. This helps the
investors to categorize their investments accordingly. In order to measure the performance of
Unilever and Nestlé, a careful analysis has been carried out based on two critical units:
1. Profitability:
In layman's terms, profit refers to the amount of extra revenue generated by business by
selling their products or services to prospective customers. On the other hand, profitability refers
to the relative measure of company's ability to generate profits in relation to the size and scale of
the business (Ray, 2012). The two concepts should not be confused with each other.
To ascertain the profitability of two chosen businesses, operational profitability has been
calculated to analyse how profitable the two companies are in comparison to each other.
Operational Profitability:
[(Operating Profit/Sales) * 100 = Operating Profit Ratio]
Unilever Nestlé
Particulars 2017 2016 Particulars 2017 2016
1

Paraphrase This Document
Need a fresh take? Get an instant paraphrase of this document with our AI Paraphraser
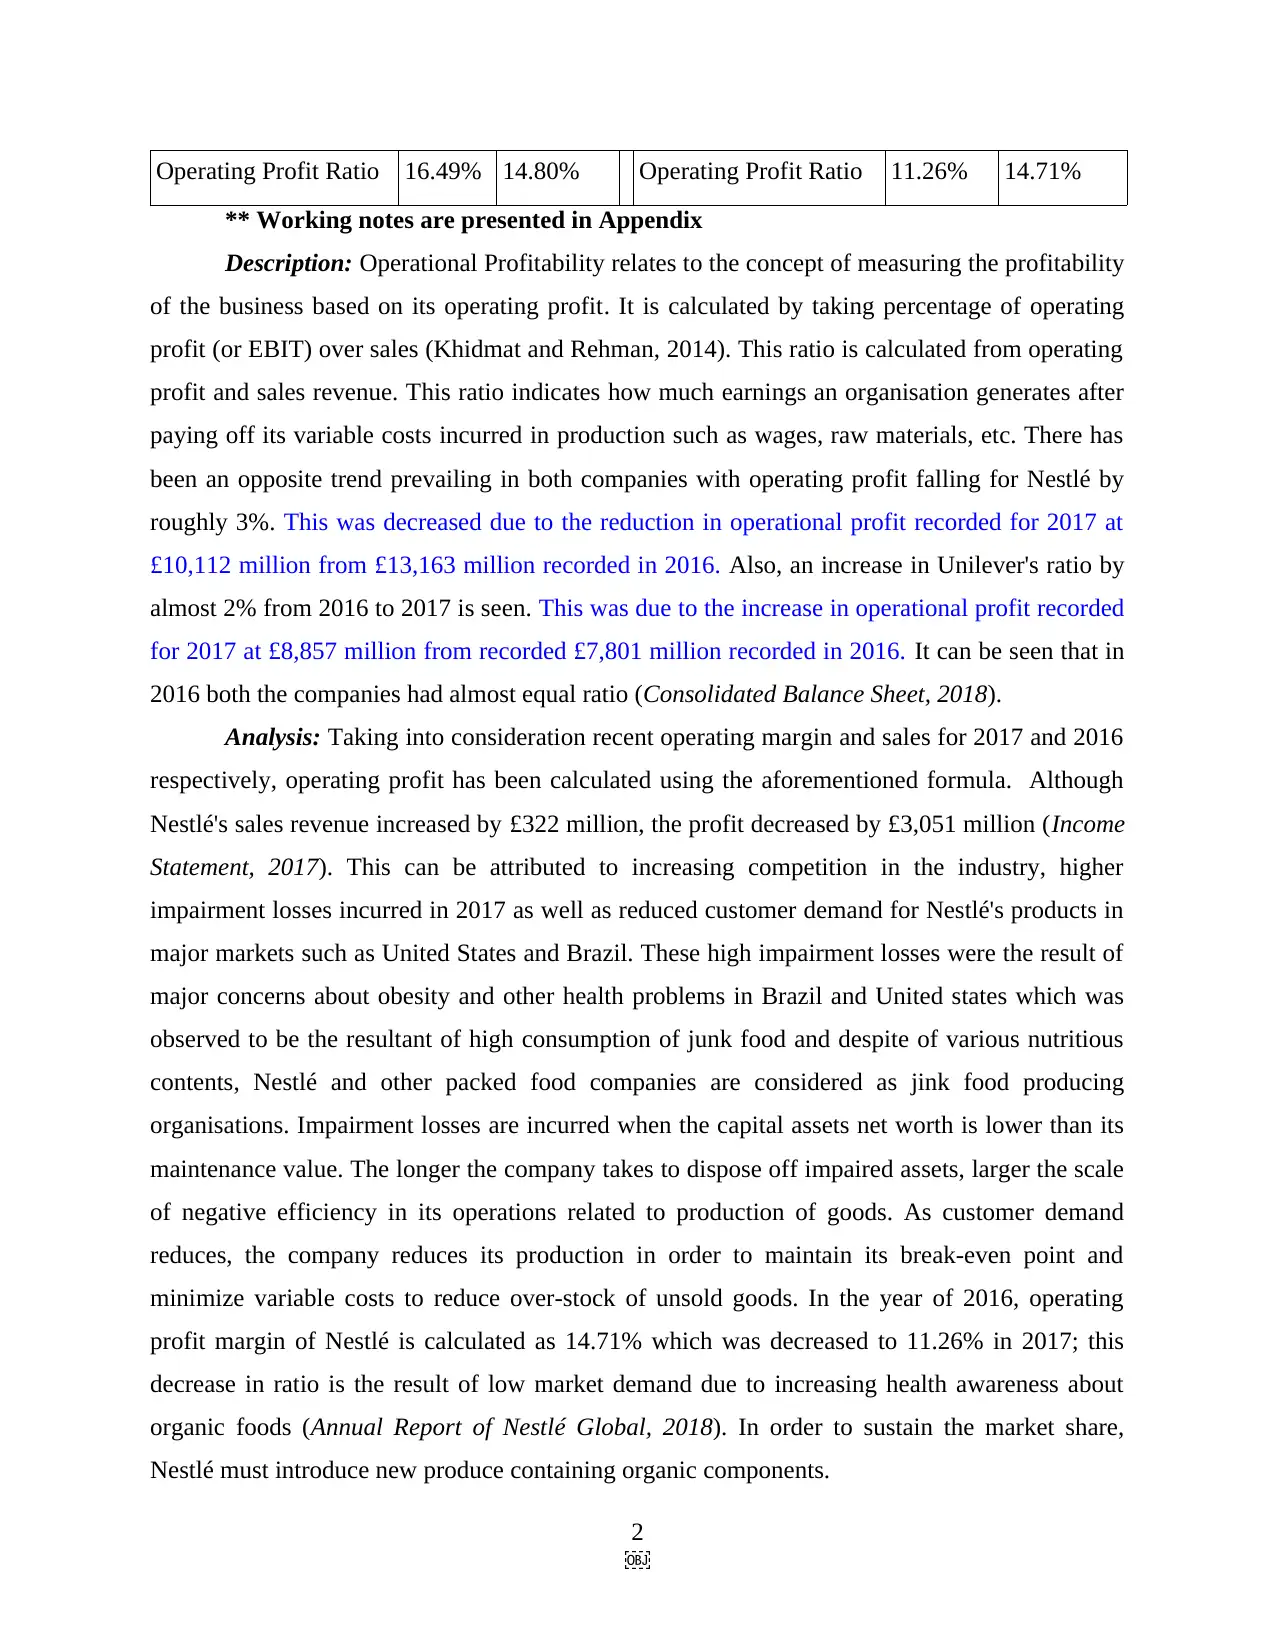
Operating Profit Ratio 16.49% 14.80% Operating Profit Ratio 11.26% 14.71%
** Working notes are presented in Appendix
Description: Operational Profitability relates to the concept of measuring the profitability
of the business based on its operating profit. It is calculated by taking percentage of operating
profit (or EBIT) over sales (Khidmat and Rehman, 2014). This ratio is calculated from operating
profit and sales revenue. This ratio indicates how much earnings an organisation generates after
paying off its variable costs incurred in production such as wages, raw materials, etc. There has
been an opposite trend prevailing in both companies with operating profit falling for Nestlé by
roughly 3%. This was decreased due to the reduction in operational profit recorded for 2017 at
£10,112 million from £13,163 million recorded in 2016. Also, an increase in Unilever's ratio by
almost 2% from 2016 to 2017 is seen. This was due to the increase in operational profit recorded
for 2017 at £8,857 million from recorded £7,801 million recorded in 2016. It can be seen that in
2016 both the companies had almost equal ratio (Consolidated Balance Sheet, 2018).
Analysis: Taking into consideration recent operating margin and sales for 2017 and 2016
respectively, operating profit has been calculated using the aforementioned formula. Although
Nestlé's sales revenue increased by £322 million, the profit decreased by £3,051 million (Income
Statement, 2017). This can be attributed to increasing competition in the industry, higher
impairment losses incurred in 2017 as well as reduced customer demand for Nestlé's products in
major markets such as United States and Brazil. These high impairment losses were the result of
major concerns about obesity and other health problems in Brazil and United states which was
observed to be the resultant of high consumption of junk food and despite of various nutritious
contents, Nestlé and other packed food companies are considered as jink food producing
organisations. Impairment losses are incurred when the capital assets net worth is lower than its
maintenance value. The longer the company takes to dispose off impaired assets, larger the scale
of negative efficiency in its operations related to production of goods. As customer demand
reduces, the company reduces its production in order to maintain its break-even point and
minimize variable costs to reduce over-stock of unsold goods. In the year of 2016, operating
profit margin of Nestlé is calculated as 14.71% which was decreased to 11.26% in 2017; this
decrease in ratio is the result of low market demand due to increasing health awareness about
organic foods (Annual Report of Nestlé Global, 2018). In order to sustain the market share,
Nestlé must introduce new produce containing organic components.
2

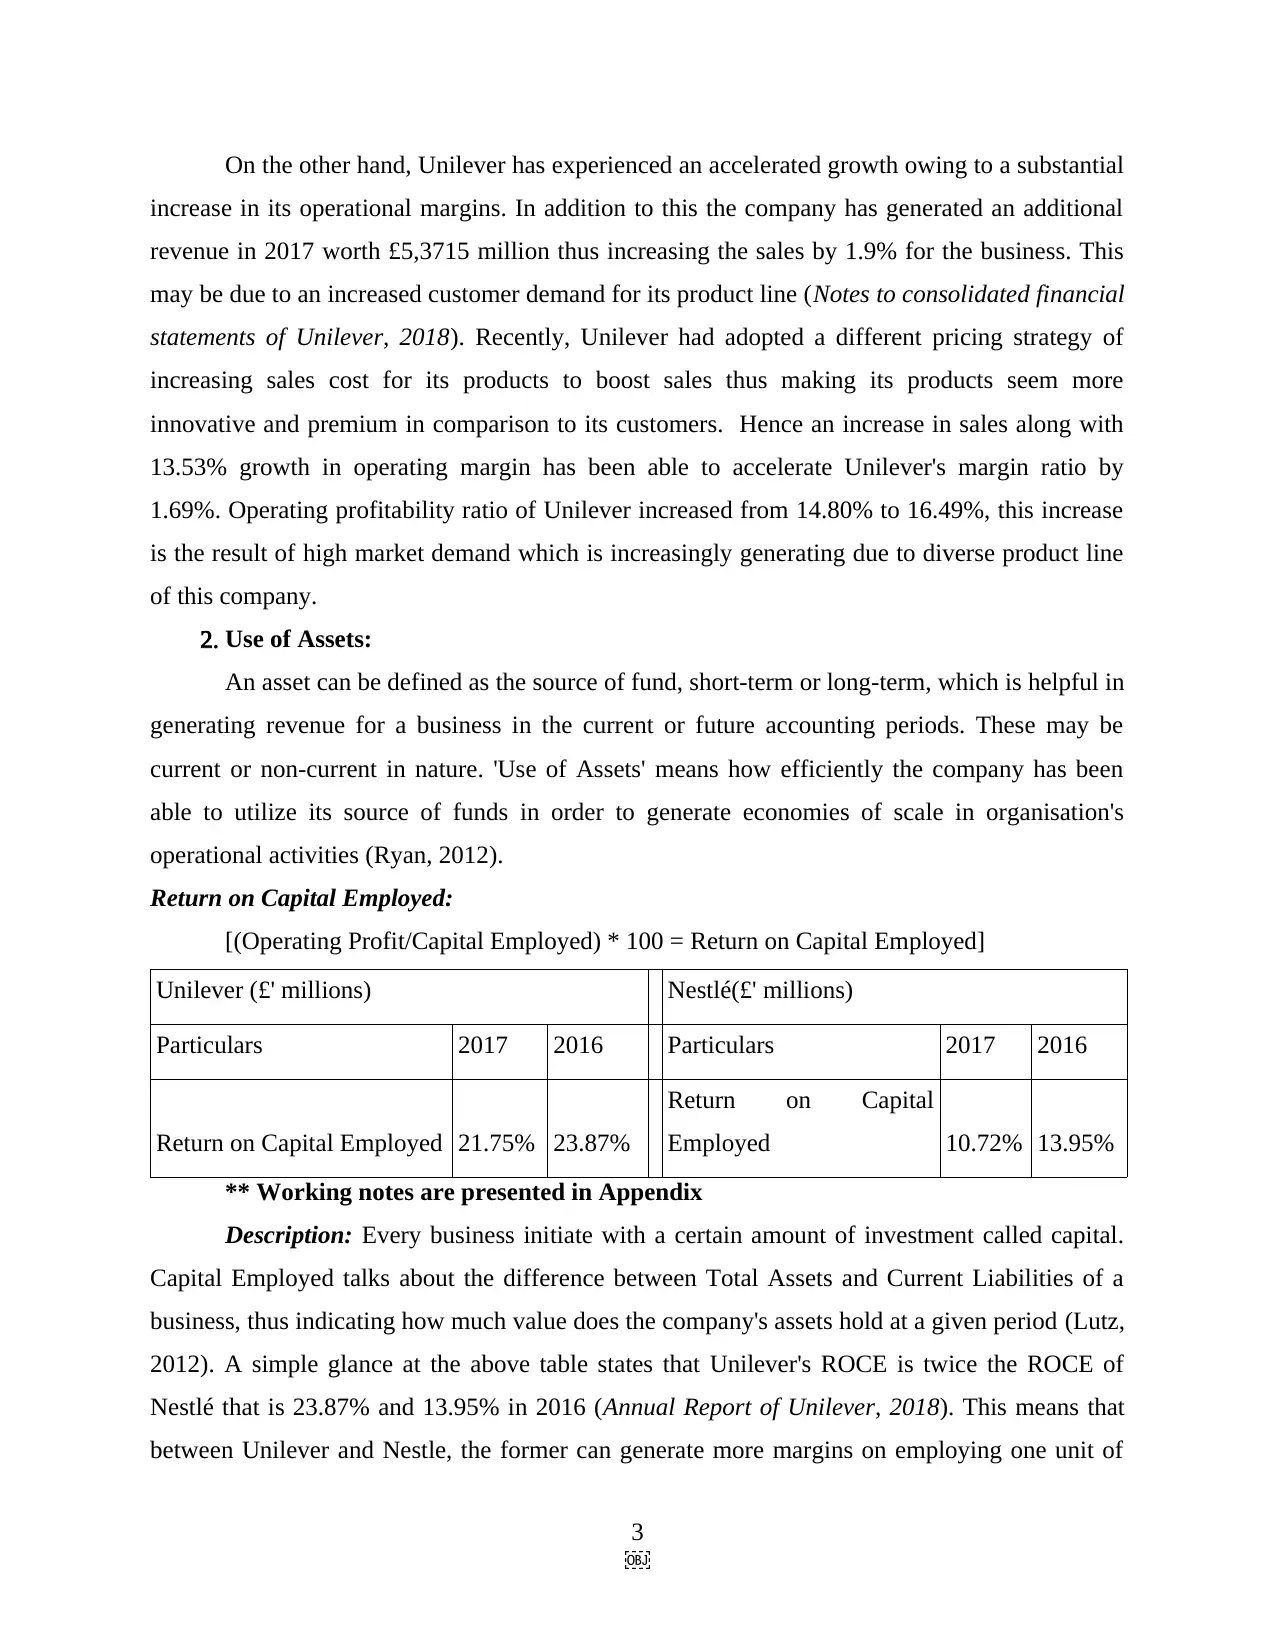
On the other hand, Unilever has experienced an accelerated growth owing to a substantial
increase in its operational margins. In addition to this the company has generated an additional
revenue in 2017 worth £5,3715 million thus increasing the sales by 1.9% for the business. This
may be due to an increased customer demand for its product line (Notes to consolidated financial
statements of Unilever, 2018). Recently, Unilever had adopted a different pricing strategy of
increasing sales cost for its products to boost sales thus making its products seem more
innovative and premium in comparison to its customers. Hence an increase in sales along with
13.53% growth in operating margin has been able to accelerate Unilever's margin ratio by
1.69%. Operating profitability ratio of Unilever increased from 14.80% to 16.49%, this increase
is the result of high market demand which is increasingly generating due to diverse product line
of this company.
2. Use of Assets:
An asset can be defined as the source of fund, short-term or long-term, which is helpful in
generating revenue for a business in the current or future accounting periods. These may be
current or non-current in nature. 'Use of Assets' means how efficiently the company has been
able to utilize its source of funds in order to generate economies of scale in organisation's
operational activities (Ryan, 2012).
Return on Capital Employed:
[(Operating Profit/Capital Employed) * 100 = Return on Capital Employed]
Unilever (£' millions) Nestlé(£' millions)
Particulars 2017 2016 Particulars 2017 2016
Return on Capital Employed 21.75% 23.87%
Return on Capital
Employed 10.72% 13.95%
** Working notes are presented in Appendix
Description: Every business initiate with a certain amount of investment called capital.
Capital Employed talks about the difference between Total Assets and Current Liabilities of a
business, thus indicating how much value does the company's assets hold at a given period (Lutz,
2012). A simple glance at the above table states that Unilever's ROCE is twice the ROCE of
Nestlé that is 23.87% and 13.95% in 2016 (Annual Report of Unilever, 2018). This means that
between Unilever and Nestle, the former can generate more margins on employing one unit of
3

⊘ This is a preview!⊘
Do you want full access?
Subscribe today to unlock all pages.
Trusted by 1+ million students worldwide
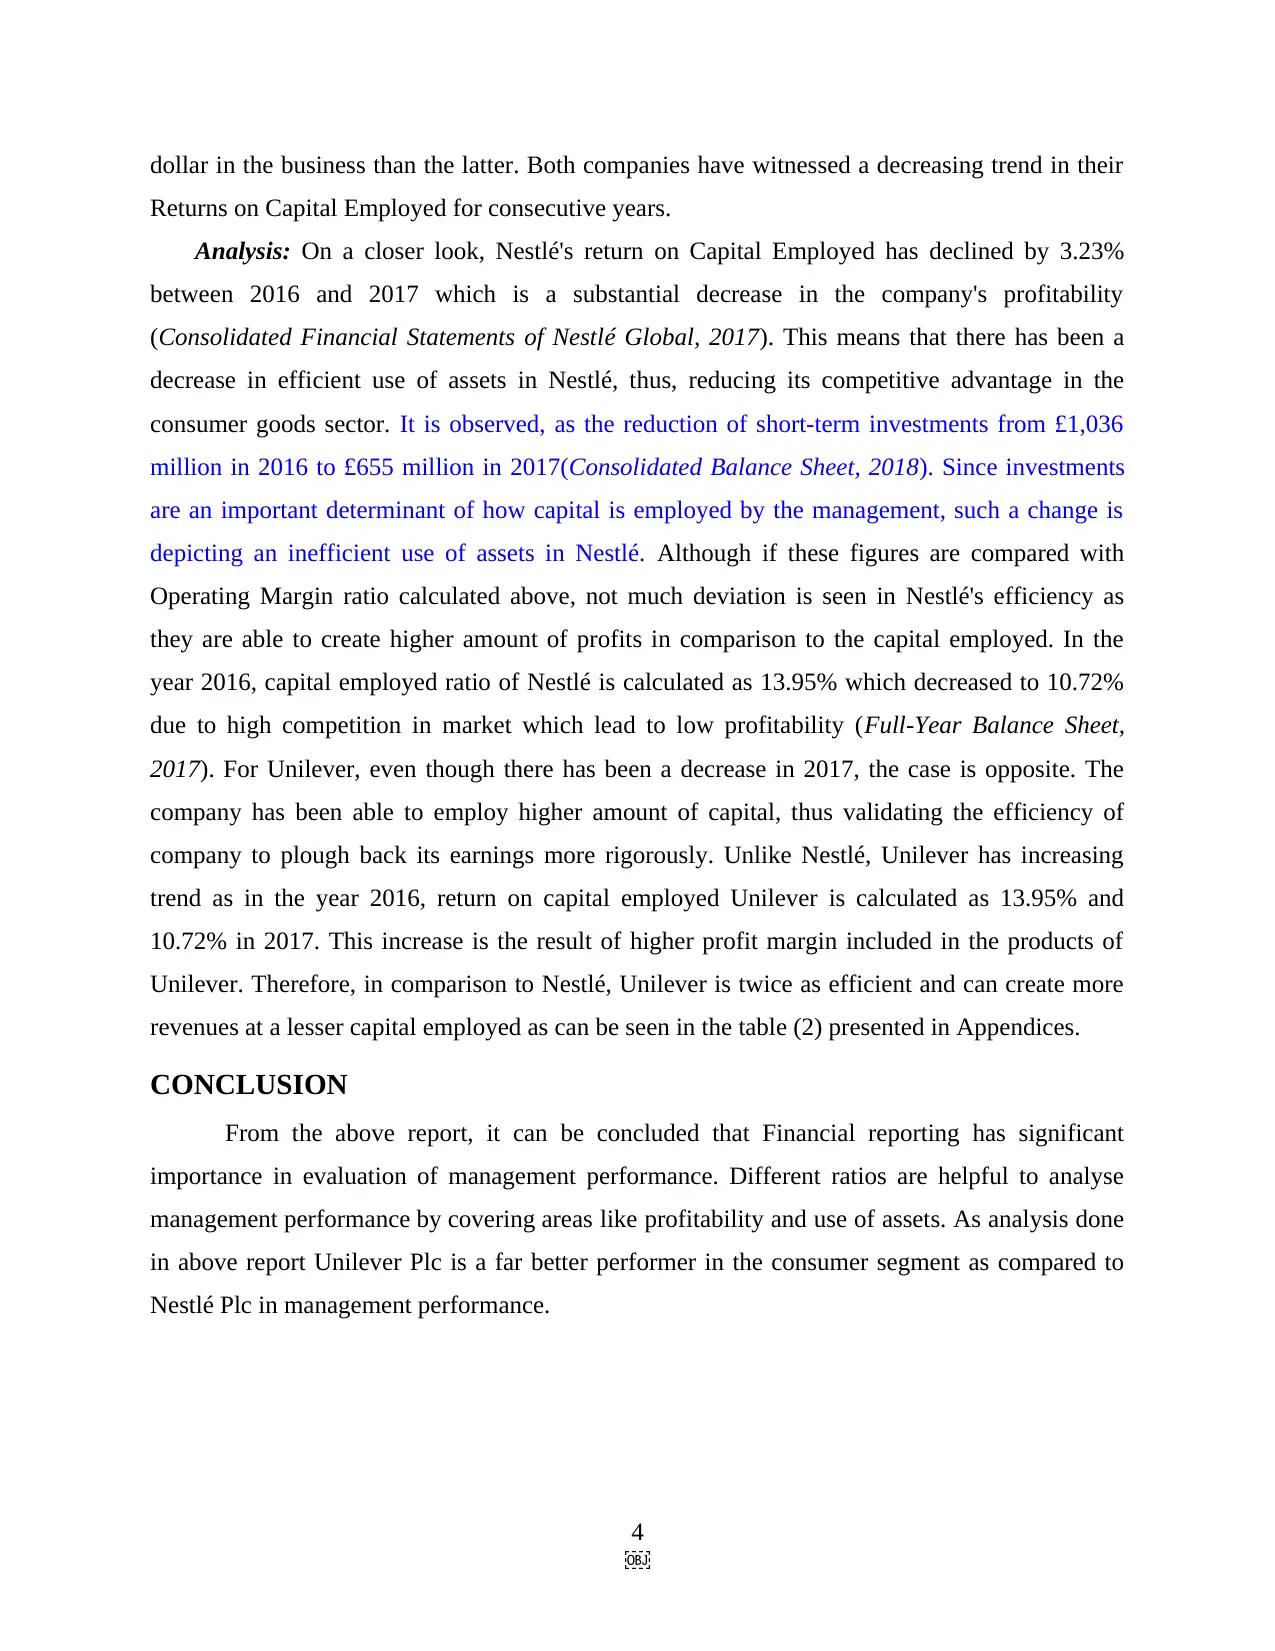
dollar in the business than the latter. Both companies have witnessed a decreasing trend in their
Returns on Capital Employed for consecutive years.
Analysis: On a closer look, Nestlé's return on Capital Employed has declined by 3.23%
between 2016 and 2017 which is a substantial decrease in the company's profitability
(Consolidated Financial Statements of Nestlé Global, 2017). This means that there has been a
decrease in efficient use of assets in Nestlé, thus, reducing its competitive advantage in the
consumer goods sector. It is observed, as the reduction of short-term investments from £1,036
million in 2016 to £655 million in 2017(Consolidated Balance Sheet, 2018). Since investments
are an important determinant of how capital is employed by the management, such a change is
depicting an inefficient use of assets in Nestlé. Although if these figures are compared with
Operating Margin ratio calculated above, not much deviation is seen in Nestlé's efficiency as
they are able to create higher amount of profits in comparison to the capital employed. In the
year 2016, capital employed ratio of Nestlé is calculated as 13.95% which decreased to 10.72%
due to high competition in market which lead to low profitability (Full-Year Balance Sheet,
2017). For Unilever, even though there has been a decrease in 2017, the case is opposite. The
company has been able to employ higher amount of capital, thus validating the efficiency of
company to plough back its earnings more rigorously. Unlike Nestlé, Unilever has increasing
trend as in the year 2016, return on capital employed Unilever is calculated as 13.95% and
10.72% in 2017. This increase is the result of higher profit margin included in the products of
Unilever. Therefore, in comparison to Nestlé, Unilever is twice as efficient and can create more
revenues at a lesser capital employed as can be seen in the table (2) presented in Appendices.
CONCLUSION
From the above report, it can be concluded that Financial reporting has significant
importance in evaluation of management performance. Different ratios are helpful to analyse
management performance by covering areas like profitability and use of assets. As analysis done
in above report Unilever Plc is a far better performer in the consumer segment as compared to
Nestlé Plc in management performance.
4

Paraphrase This Document
Need a fresh take? Get an instant paraphrase of this document with our AI Paraphraser
REFERENCES
Lutz, S., 2012. Determination of market values and risk premia of multi-national enterprises and
its application to transfer-pricing. International Business Research. 5(12). pp.1-7.
Oikonomou, I., Brooks, C. and Pavelin, S., 2012. The impact of corporate social performance on
financial risk and utility: A longitudinal analysis. Financial Management. 41(2).
pp.483-515.
Ray, S., 2012. Evaluating the impact of working capital management components on corporate
profitability: evidence from Indian manufacturing firms. International Journal of
Economic Practices and Theories. 2(3). pp.127-136.
Ryan, S. G., 2012. Financial reporting for financial instruments. Foundations and Trends® in
Accounting. 6(3–4). pp.187-354.
Weil, R. L., Schipper, K. and Francis, J., 2013. Financial accounting: an introduction to
concepts, methods and uses. Cengage Learning.
Zygmunt, J., 2013, March. Does liquidity impact on profitability. In Conference of informatics
and management sciences, March. (pp. 38-49).
Online:
Notes to consolidated financial statements of Unilever. 2018. [Online]. Available Through:
<https://www.unilever.com/investor-relations/annual-report-and-accounts/>
Consolidated Balance Sheet. 2018. [Online]. Available through:
<https://www.unilever.com/investor-relations/annual-report-and-accounts/>
Annual Report of Unilever. 2018. [Online]. Available through:
<https://www.unilever.com/Images/unilever-annual-report-and-accounts-2017_tcm244-
516456_en.pdf>
Unilever beats expectations for growth. 2018. [Online]. Available through:
<https://www.campaignlive.co.uk/article/unilever-beats-expectations-31-sales-growth/
1456001>
Annual Report of Nestlé Global. 2018. [Online]. Available through:
<https://www.nestle.com/asset-library/documents/library/documents/
financial_statements/2018-financial-statements-en.pdf>
Income Statement. 2017. [Online]. Available through:
<https://www.nestle.com/investors/publications#tab-2017>
Full-Year Balance Sheet. 2017. [Online]. Available Through:
<https://www.nestle.com/investors/publications#tab-2017>
Consolidated Financial Statements of Nestlé Global. 2017. [Online]. Available Through:
<https://www.nestle.com/investors/publications#tab-2017>
5

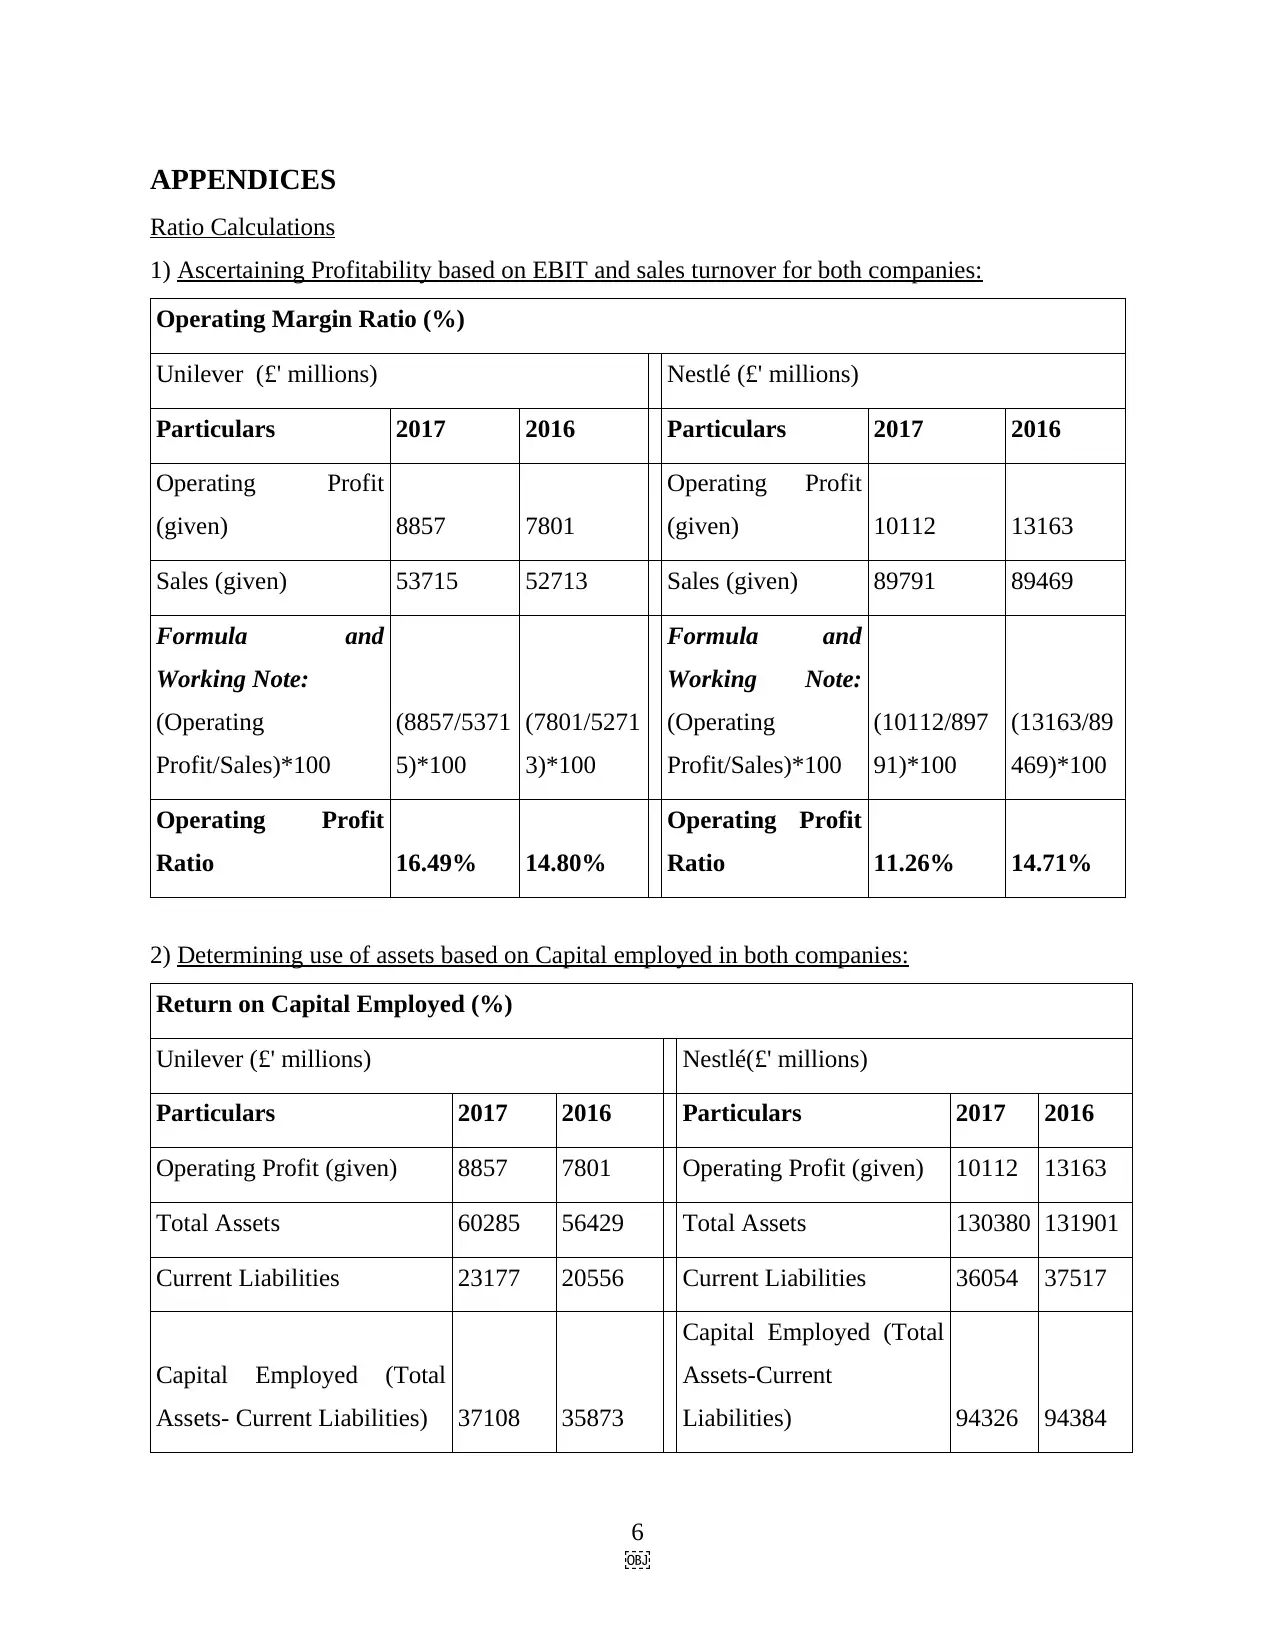
APPENDICES
Ratio Calculations
1) Ascertaining Profitability based on EBIT and sales turnover for both companies:
Operating Margin Ratio (%)
Unilever (£' millions) Nestlé (£' millions)
Particulars 2017 2016 Particulars 2017 2016
Operating Profit
(given) 8857 7801
Operating Profit
(given) 10112 13163
Sales (given) 53715 52713 Sales (given) 89791 89469
Formula and
Working Note:
(Operating
Profit/Sales)*100
(8857/5371
5)*100
(7801/5271
3)*100
Formula and
Working Note:
(Operating
Profit/Sales)*100
(10112/897
91)*100
(13163/89
469)*100
Operating Profit
Ratio 16.49% 14.80%
Operating Profit
Ratio 11.26% 14.71%
2) Determining use of assets based on Capital employed in both companies:
Return on Capital Employed (%)
Unilever (£' millions) Nestlé(£' millions)
Particulars 2017 2016 Particulars 2017 2016
Operating Profit (given) 8857 7801 Operating Profit (given) 10112 13163
Total Assets 60285 56429 Total Assets 130380 131901
Current Liabilities 23177 20556 Current Liabilities 36054 37517
Capital Employed (Total
Assets- Current Liabilities) 37108 35873
Capital Employed (Total
Assets-Current
Liabilities) 94326 94384
6

⊘ This is a preview!⊘
Do you want full access?
Subscribe today to unlock all pages.
Trusted by 1+ million students worldwide
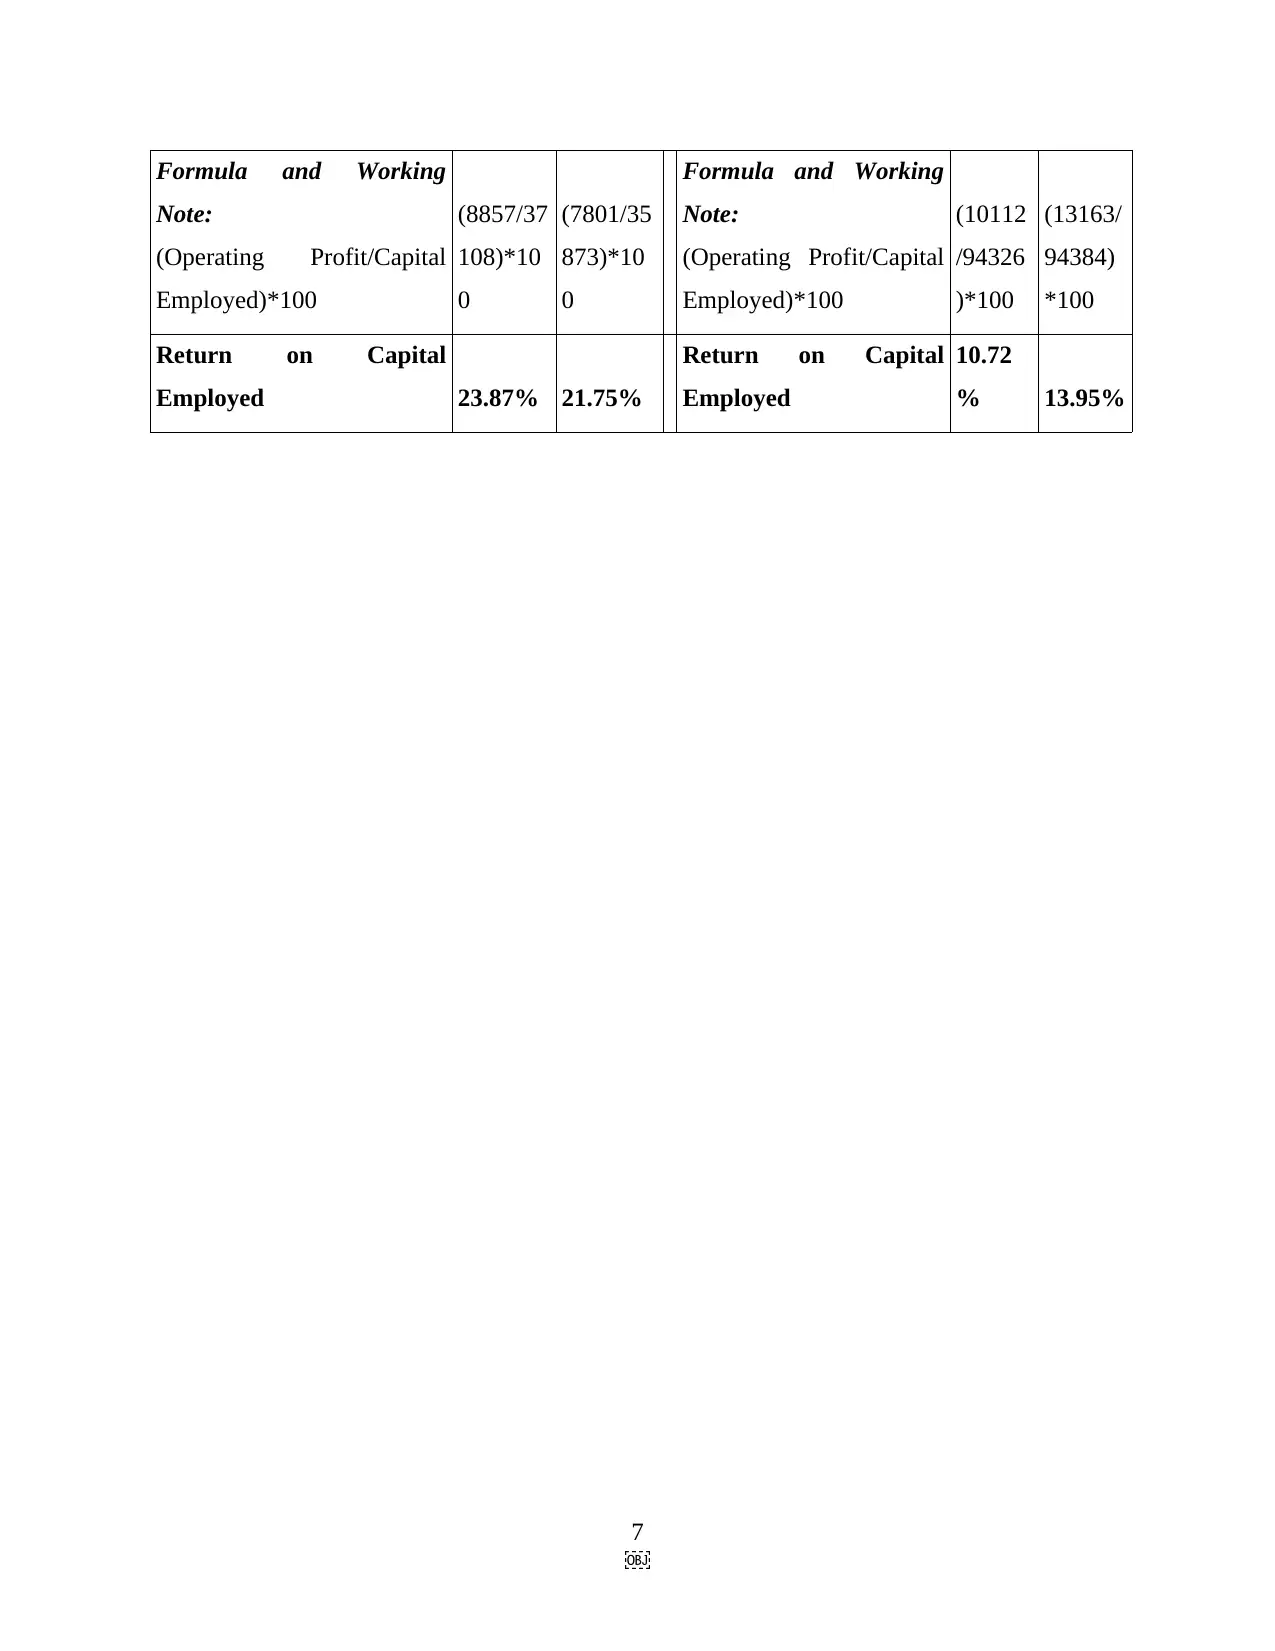
Formula and Working
Note:
(Operating Profit/Capital
Employed)*100
(8857/37
108)*10
0
(7801/35
873)*10
0
Formula and Working
Note:
(Operating Profit/Capital
Employed)*100
(10112
/94326
)*100
(13163/
94384)
*100
Return on Capital
Employed 23.87% 21.75%
Return on Capital
Employed
10.72
% 13.95%
7

Note:
(Operating Profit/Capital
Employed)*100
(8857/37
108)*10
0
(7801/35
873)*10
0
Formula and Working
Note:
(Operating Profit/Capital
Employed)*100
(10112
/94326
)*100
(13163/
94384)
*100
Return on Capital
Employed 23.87% 21.75%
Return on Capital
Employed
10.72
% 13.95%
7

1 out of 10
Related Documents


Your All-in-One AI-Powered Toolkit for Academic Success.
+13062052269
info@desklib.com
Available 24*7 on WhatsApp / Email
![[object Object]](/_next/static/media/star-bottom.7253800d.svg)
Unlock your academic potential
Copyright © 2020–2026 A2Z Services. All Rights Reserved. Developed and managed by ZUCOL.