Accounting & Finance for Managers: Financial Analysis Report
VerifiedAdded on 2020/01/15
|21
|4404
|46
Report
AI Summary
This report provides a comprehensive financial analysis comparing Next plc. and H&M, two major fashion retailers. It examines their performance, financial positions, and investment potential using various financial ratios, including current ratio, quick ratio, debt/equity ratio, and more. The report also incorporates SWOT analyses for both companies to assess their strengths, weaknesses, opportunities, and threats. Furthermore, it delves into chart formations to visualize key financial data, and offers recommendations for improving financial performance. Finally, the report discusses the limitations of relying solely on financial ratios. Investment appraisal techniques, such as payback period, net present value, and accounting rate of return, are also utilized to aid in investment decision-making, along with a discussion of their limitations.

Accounting & Finance
for managers
for managers
Paraphrase This Document
Need a fresh take? Get an instant paraphrase of this document with our AI Paraphraser

TABLE OF CONTENTS
Introduction......................................................................................................................................4
Task 1...............................................................................................................................................4
1. Analyze the performance and financial position and
investment potential of the two companies.................................................................................4
2. Chart formation........................................................................................................................7
3. Recommendations..................................................................................................................11
4. Limitation of relaying on financial ratios..............................................................................12
Task 2.............................................................................................................................................13
1. Use of Initial Investment Techniques....................................................................................13
Payback Period...........................................................................................................................14
Net present value........................................................................................................................15
Accounting rate of Return..........................................................................................................16
2. Limitations of Investment Appraisal techniques...................................................................17
Conclusion.....................................................................................................................................17
References......................................................................................................................................19
2

Index of Tables
Table 1: 10 financial ratios..............................................................................................................4
Table 2: SWOT analysis of Next plc...............................................................................................6
Table 3: SWOT analysis of H&M...................................................................................................7
Table 4: Ratios for Next plc.............................................................................................................8
Table 5: Ratios For H&M................................................................................................................8
Table 6: Ratios for Next plc............................................................................................................9
Table 7: Ratios For H&M..............................................................................................................10
Table 8: Depreciation for Project A...............................................................................................13
Table 9: Depreciation for Project B...............................................................................................13
Table 10: Cumulative Cash Flow..................................................................................................14
Table 11: Payback period...............................................................................................................15
Table 12: NPV ..............................................................................................................................15
Table 13: ARR...............................................................................................................................16
3
⊘ This is a preview!⊘
Do you want full access?
Subscribe today to unlock all pages.
Trusted by 1+ million students worldwide

Illustration Index
Illustration 1: Graph for Next plc.....................................................................................................9
Illustration 2: Graph for H&M.......................................................................................................10
Illustration 3: Graph for Next plc...................................................................................................11
Illustration 4: Graph for H&M.......................................................................................................12
4
Paraphrase This Document
Need a fresh take? Get an instant paraphrase of this document with our AI Paraphraser

INTRODUCTION
Finance is the management of money by the large companies and accounting means the
process of recording these financial transaction in systematic and comprehensive manner. The
managers use accounting and finance to check the availability of the money and to allocated the
extra money (Anandarajan, Anandarajan and Srinivasan, 2012). The present report is based on
the Asol ltd. which is a large fashion retailer company. The company's CFO (Chief Financial
Officer) is planning to purchase the share either in Next Plc. or in Hennes & Mauritz
( H&M )company. These two are clothing retailer companies who are listed in the London Stock
Exchange.
The below mentioned report will help in recommending the CFO about the more vital
option among the two company where he can invest in. In addition it will help in analysis the
financial positions of the two companies. The importance and limitations for the investment
point of view are discussed below. Furthermore the report will also conclude the use of
investment appraisal techniques for making the decision of purchasing shares.
TASK 1
1. Analyze the performance and financial position and
investment potential of the two companies
On the basis of ratio analysis, Asol ltd. is comparing two companies Next plc. and H&M
by which company can make decision invest either of these two companies.
Table 1: 10 financial ratios
Ratios Next plc. (2015) H&M (2014)
Current ratio 1.82 2.11
Quick ratio 1.16 1.07
debt / equity 2.61 0
Assets turnover 1.81 2.14
Inventory turnover 6.62 3.46
Net profit Margin 15.87% 13.19%
Return on equity 208.75% 41.27%
Free cash flow / Share 4.14 0.76
5

Market cap / Earnings 17.38 23.13
Enterprise value / EBITDA 12.74 14.41
The above table illustrate the 10 financial ratios of Next plc. and H&M over which the
current performance are compared.
Current ratio: This ratio indicates that the company is able to balance their current
liabilities from the current assets (Droms and Wright, 2015). By analyzing the Next plc.
Ratio of previous five year is observed that company's ratio is continuously increasing i.e.
in 2011 it was 1.28 which profitable ratio but in 2015 it is 1.82 which is higher ratio.
Similarly in H&M the ratio is continuously decreasing as in 2010 it was 2.96 and in 2014,
2.11 which is a good sign for current ratio. But while comparing two companies current
ratio Next plc.'s ratio is beneficial then H&M as it is lesser then 0.29%.
Quick ratio: The ideal quick ratio is 1:1 (Brief and Peasnell, 2013). While comparing the
ratio of previous years of H&M it is continuously decreasing with some units which is
not a good state as company will be relaying on its assets to meet the short term
liabilities. On the contrary, Next plc. is showing increment which depicts that company
can meet it present obligations with quick funds. In comparing two companies ratio's,
Next plc. Shows 1.16 which is higher then H&M which is 1.07, therefore Next's ratio is
profitable.
Debt/Equity ratio: This ratio indicates that the company finance which comes from
creditors and investor. Higher ratio shows more creditors and lower ratio shows more
investors (Debt to Equity Ratio, 2015). While comparing the ratio of Next and H&M,
second company is showing consistency by maintaining the value of 0 where as first
company is showing a variation from 2011 till 2015. By analysis it can seen that to
invest in H&M would be more feasible.
Asset turnover ratio: The first 3 years of Next plc. shows a constant result and in next 2
year it is seen decreasing which indicates the company's inefficiency in maintaining
assets and also have management problem. In comparison with H&M which is showing a
continuous increase till now that depicts company is efficiently using their assets for
generating sales (Gitman, Juchau and Flanagan, 2010). In current comparison also H&M
is showing higher ratio of 2.14.
6
⊘ This is a preview!⊘
Do you want full access?
Subscribe today to unlock all pages.
Trusted by 1+ million students worldwide
Inventory turnover ratio: Next is showing higher ratio of 6.62 which is higher than
H&M's ratio of 3.46. The higher ratio of Next plc. shows the efficiency of the company
in converting inventory to sale which is a good sign.
Net profit margin ratio: This ratio shows the profitability of the company (Simons,
2013). In present year Next plc. recorded the net profit ratio of 15.87% which is higher
than the 13.19% ratio of H&M. Next's higher ratio shows it more profitability then the
H&M.
Return on Equity (ROE): The higher ROE indicates the company's maximum and
effective utilization of investor's funds which Next plc. is showing with the ratio of
208.75%. H&M's profitability is affected with the low ratio of 41.27 %. According to this
ratio Next plc. is earning higher return on equity.
Free cash flow/Share: Company Next is showing the ratio of 4.14 which is higher then
0.76 ratio of H&M. The higher ratio indicates the high per share earnings of the
company.
Market cap/Earnings: This ratio is the price to earning ratio which depicts the higher
ratio indicates the high performance and growth in future which H&M is showing by
23.13%. this company would perform good in future as compared to Next plc. which
recorded the ratio of 17.38%.
Enterprise value/EBITDA: Next plc. is showing 12.74% which is a low ratio in
comparison to H&M's 14.41% ratio. The higher ratio indicates H&M company's high
growth.
Non financial comparison on the bases of SWOT analysis
SWOT analysis will help the Asol ltd. to analysis the non-financial aspects of the two
companies, Next plc. and H&M.
Table 2: SWOT analysis of Next plc.
Strengths
Individual Style
Good Quality
Value for Money
Weaknesses
Incomplete product range
Competitor's effects
Cost structure
7
Paraphrase This Document
Need a fresh take? Get an instant paraphrase of this document with our AI Paraphraser
Extensive market over-viewing
Easy Adaptability
High loan rates are possible
Profitability in future
Opportunities
Attentively observing social
rethinking
Environment friendly raw material
Individuality product
Growing economy
Increasing demand
Threats
Guerrilla attack by other affecting
competitor
Lack of control over unpredictable
events
External business risk
Increasing rate of return
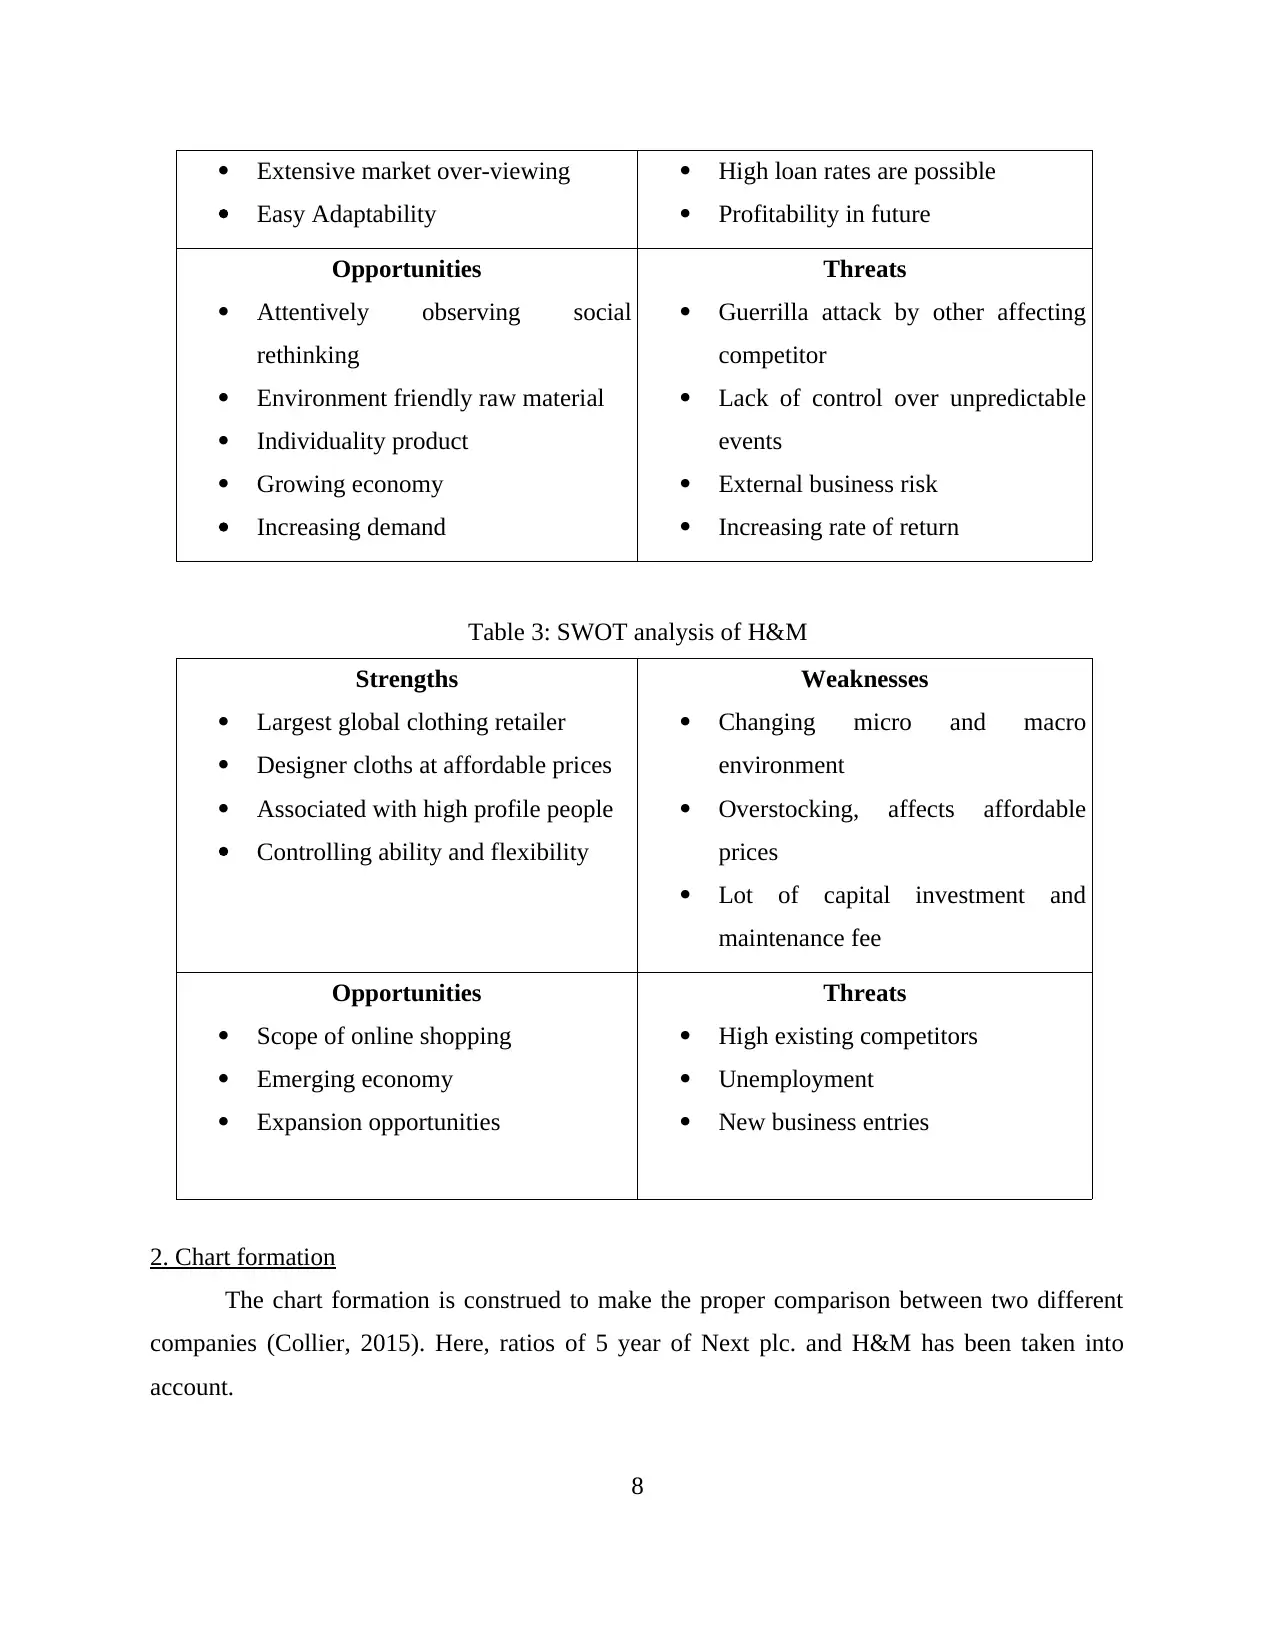
Table 3: SWOT analysis of H&M
Strengths
Largest global clothing retailer
Designer cloths at affordable prices
Associated with high profile people
Controlling ability and flexibility
Weaknesses
Changing micro and macro
environment
Overstocking, affects affordable
prices
Lot of capital investment and
maintenance fee
Opportunities
Scope of online shopping
Emerging economy
Expansion opportunities
Threats
High existing competitors
Unemployment
New business entries
2. Chart formation
The chart formation is construed to make the proper comparison between two different
companies (Collier, 2015). Here, ratios of 5 year of Next plc. and H&M has been taken into
account.
8
Easy Adaptability
High loan rates are possible
Profitability in future
Opportunities
Attentively observing social
rethinking
Environment friendly raw material
Individuality product
Growing economy
Increasing demand
Threats
Guerrilla attack by other affecting
competitor
Lack of control over unpredictable
events
External business risk
Increasing rate of return
Table 3: SWOT analysis of H&M
Strengths
Largest global clothing retailer
Designer cloths at affordable prices
Associated with high profile people
Controlling ability and flexibility
Weaknesses
Changing micro and macro
environment
Overstocking, affects affordable
prices
Lot of capital investment and
maintenance fee
Opportunities
Scope of online shopping
Emerging economy
Expansion opportunities
Threats
High existing competitors
Unemployment
New business entries
2. Chart formation
The chart formation is construed to make the proper comparison between two different
companies (Collier, 2015). Here, ratios of 5 year of Next plc. and H&M has been taken into
account.
8

Table 4: Ratios for Next plc.
Year Gross profit margin
ratio
Pay – out ratio
2011 29.27 35.84
2012 30.38 34.9
2013 31.48 32.8
2014 33.16 35.25
2015 33.59 35.04
The above table and graph shows the gross profit and pay-out ratio of Next plc. Which
shows the variation in the profit margin and also show that in the payback of initial investment.
Table 5: Ratios For H&M
Year Gross profit margin
ratio
Pay – out ratio
2010 62.93 42.08
2011 60.13 49.69
2012 59.5 93.22
2013 59.13 91.99
9
1 2 3 4 5
0
5
10
15
20
25
30
35
40
29.27 30.38 31.48 33.16 33.59
35.84 34.9 32.8
35.25 35.04
Gross profit margin ratio
Pay – out ratio
Illustration 1: Graph for Next plc.
Year Gross profit margin
ratio
Pay – out ratio
2011 29.27 35.84
2012 30.38 34.9
2013 31.48 32.8
2014 33.16 35.25
2015 33.59 35.04
The above table and graph shows the gross profit and pay-out ratio of Next plc. Which
shows the variation in the profit margin and also show that in the payback of initial investment.
Table 5: Ratios For H&M
Year Gross profit margin
ratio
Pay – out ratio
2010 62.93 42.08
2011 60.13 49.69
2012 59.5 93.22
2013 59.13 91.99
9
1 2 3 4 5
0
5
10
15
20
25
30
35
40
29.27 30.38 31.48 33.16 33.59
35.84 34.9 32.8
35.25 35.04
Gross profit margin ratio
Pay – out ratio
Illustration 1: Graph for Next plc.
⊘ This is a preview!⊘
Do you want full access?
Subscribe today to unlock all pages.
Trusted by 1+ million students worldwide
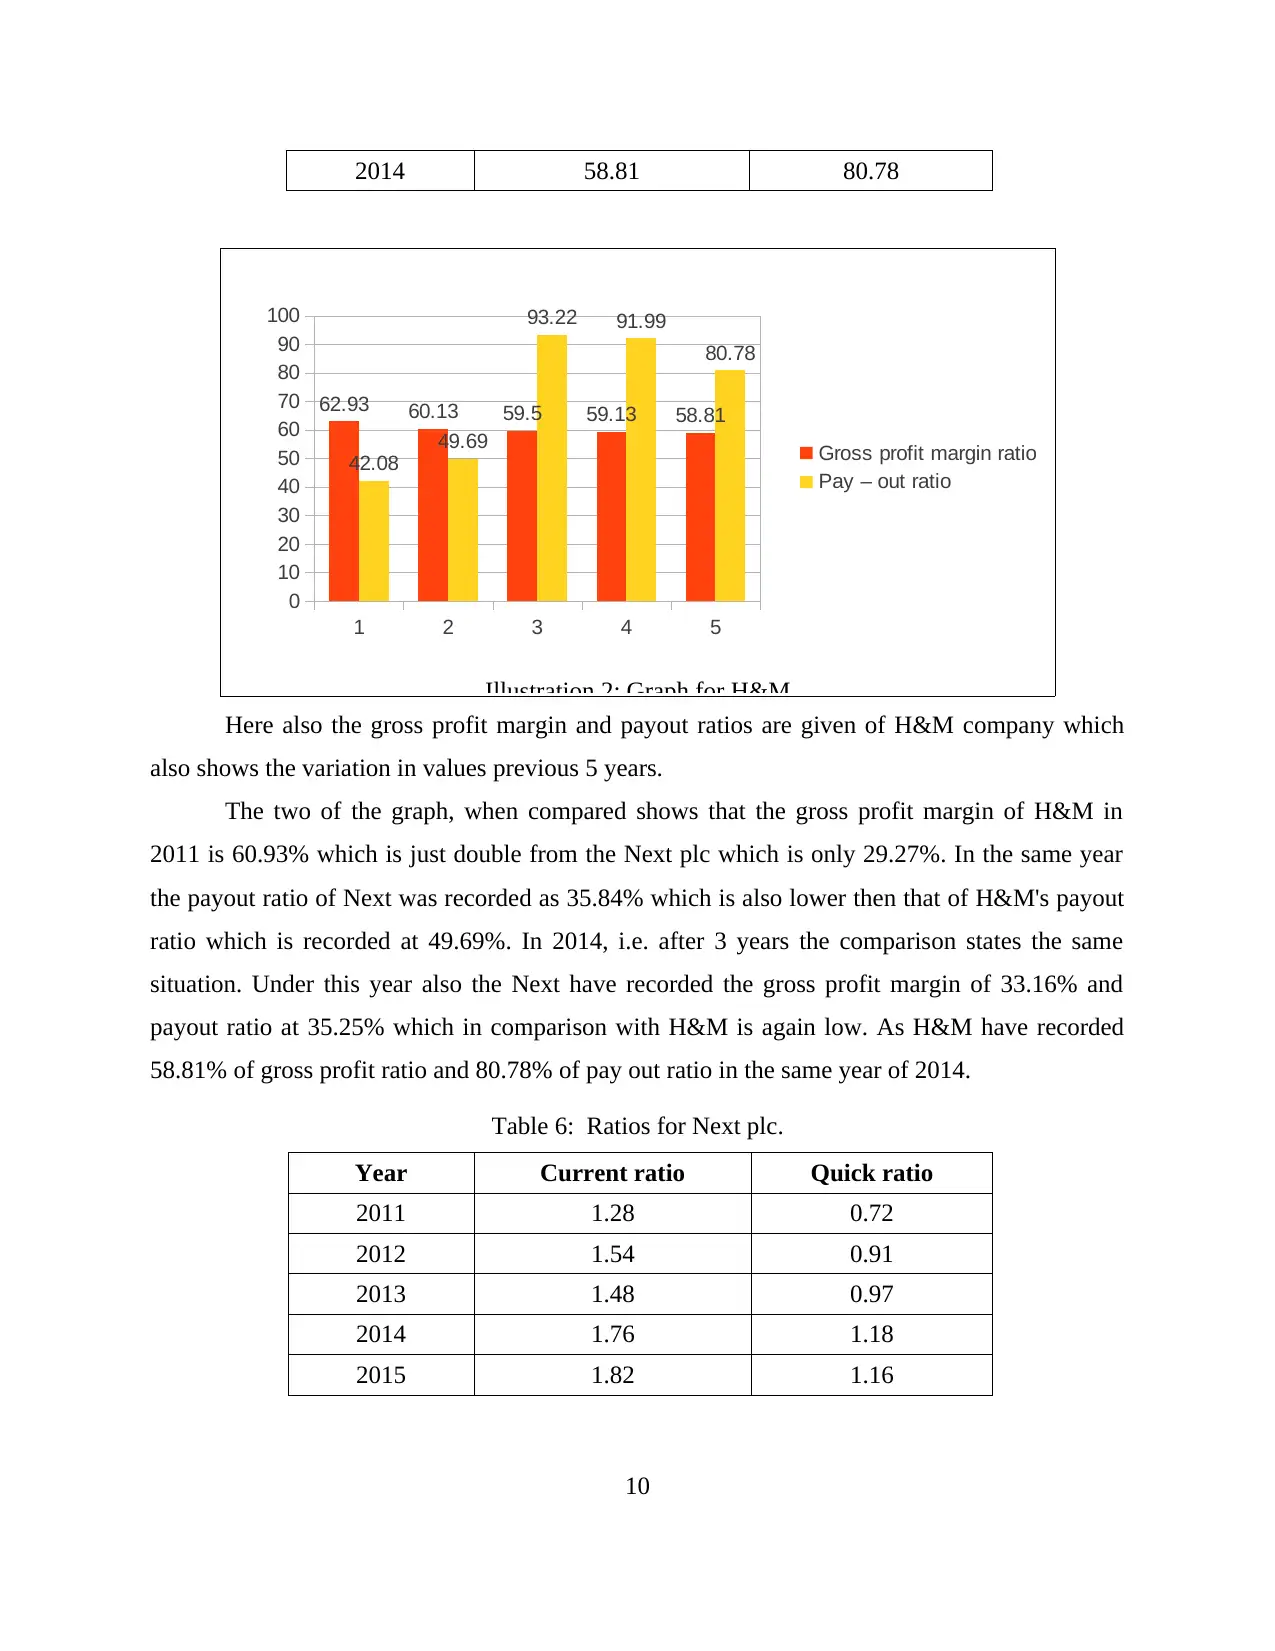
2014 58.81 80.78
Here also the gross profit margin and payout ratios are given of H&M company which
also shows the variation in values previous 5 years.
The two of the graph, when compared shows that the gross profit margin of H&M in
2011 is 60.93% which is just double from the Next plc which is only 29.27%. In the same year
the payout ratio of Next was recorded as 35.84% which is also lower then that of H&M's payout
ratio which is recorded at 49.69%. In 2014, i.e. after 3 years the comparison states the same
situation. Under this year also the Next have recorded the gross profit margin of 33.16% and
payout ratio at 35.25% which in comparison with H&M is again low. As H&M have recorded
58.81% of gross profit ratio and 80.78% of pay out ratio in the same year of 2014.
Table 6: Ratios for Next plc.
Year Current ratio Quick ratio
2011 1.28 0.72
2012 1.54 0.91
2013 1.48 0.97
2014 1.76 1.18
2015 1.82 1.16
10
1 2 3 4 5
0
10
20
30
40
50
60
70
80
90
100
62.93 60.13 59.5 59.13 58.81
42.08
49.69
93.22 91.99
80.78
Gross profit margin ratio
Pay – out ratio
Illustration 2: Graph for H&M
Paraphrase This Document
Need a fresh take? Get an instant paraphrase of this document with our AI Paraphraser

Table 7: Ratios For H&M
Year Current ratio Quick ratio
2010 2.96 2.06
2011 2.71 1.69
2012 2.66 1.49
2013 2.25 1.22
2014 2.11 1.07
11
1 2 3 4 5
0
0.2
0.4
0.6
0.8
1
1.2
1.4
1.6
1.8
2
1.28
1.54 1.48
1.76 1.82
0.72
0.91 0.97
1.18 1.16
Current ratio
Quick ratio
Illustration 3: Graph for Next plc.
Year Current ratio Quick ratio
2010 2.96 2.06
2011 2.71 1.69
2012 2.66 1.49
2013 2.25 1.22
2014 2.11 1.07
11
1 2 3 4 5
0
0.2
0.4
0.6
0.8
1
1.2
1.4
1.6
1.8
2
1.28
1.54 1.48
1.76 1.82
0.72
0.91 0.97
1.18 1.16
Current ratio
Quick ratio
Illustration 3: Graph for Next plc.
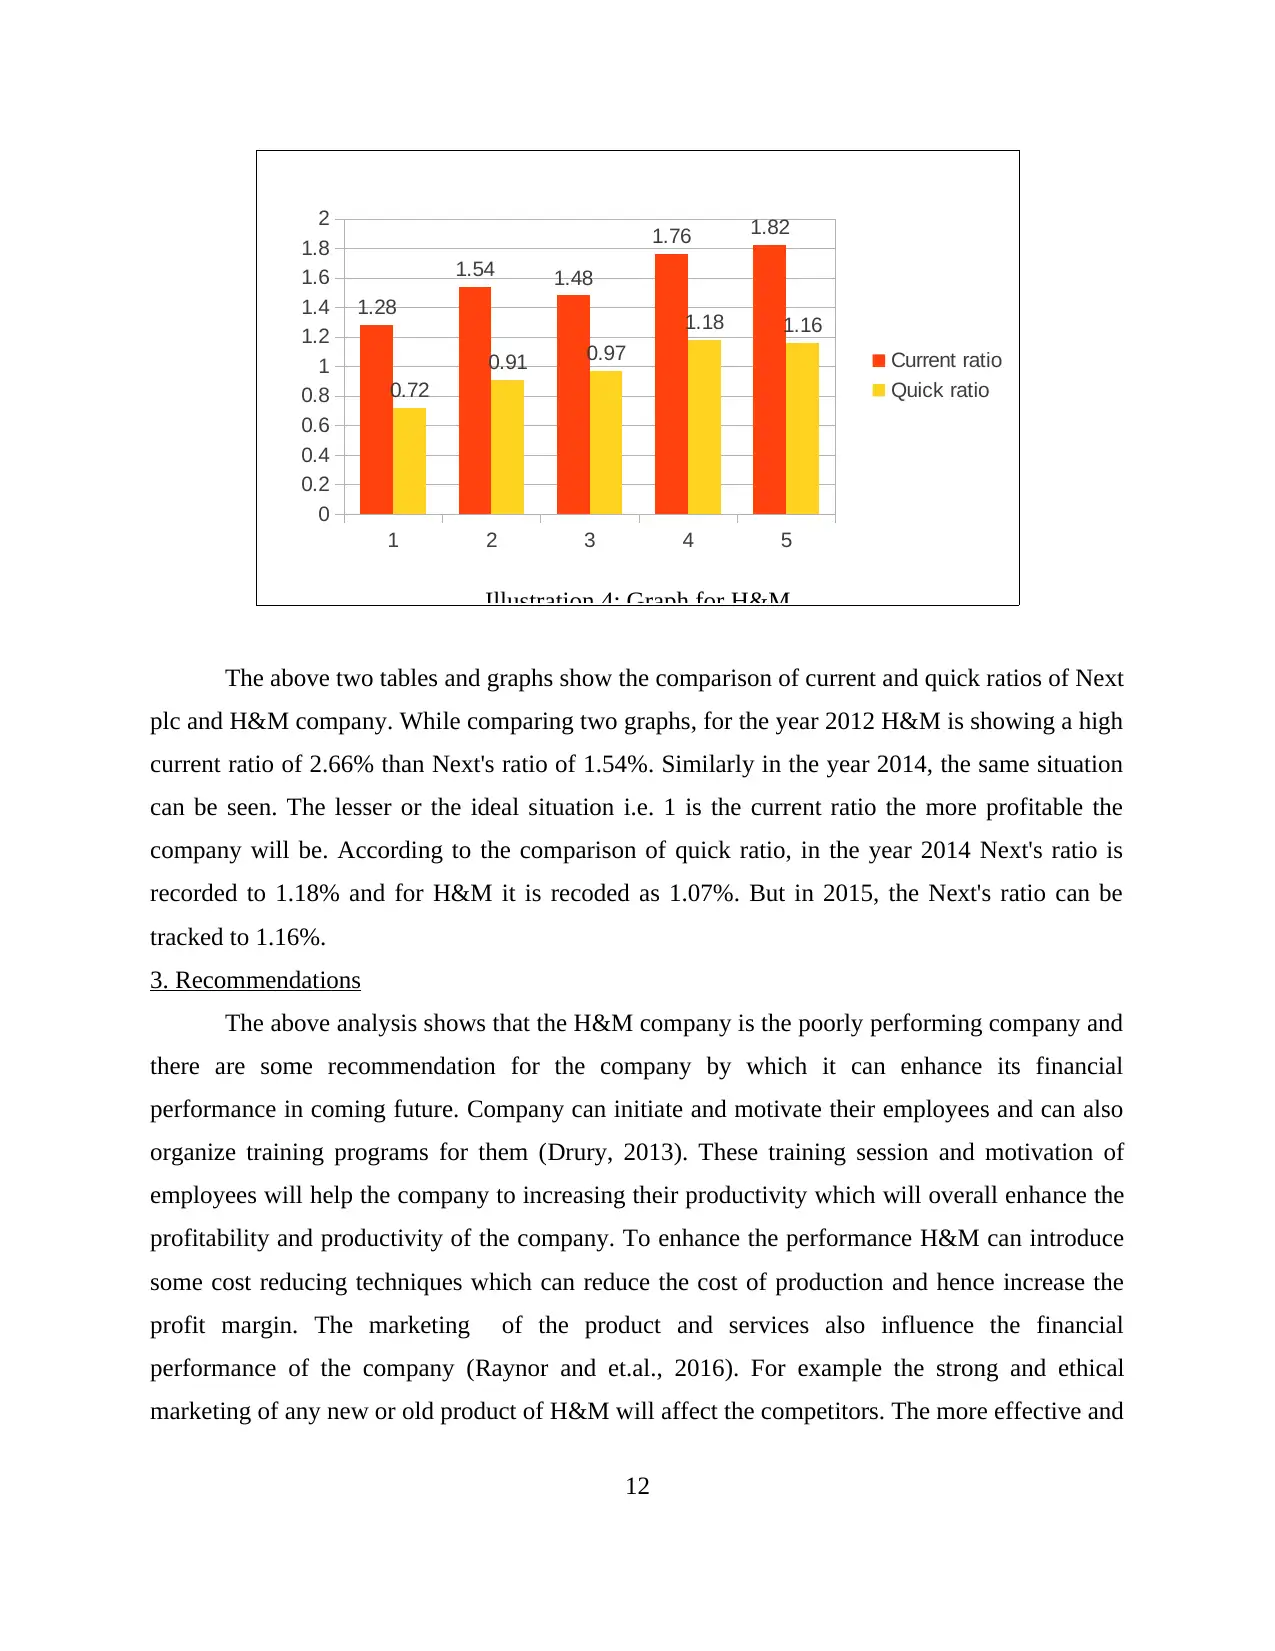
The above two tables and graphs show the comparison of current and quick ratios of Next
plc and H&M company. While comparing two graphs, for the year 2012 H&M is showing a high
current ratio of 2.66% than Next's ratio of 1.54%. Similarly in the year 2014, the same situation
can be seen. The lesser or the ideal situation i.e. 1 is the current ratio the more profitable the
company will be. According to the comparison of quick ratio, in the year 2014 Next's ratio is
recorded to 1.18% and for H&M it is recoded as 1.07%. But in 2015, the Next's ratio can be
tracked to 1.16%.
3. Recommendations
The above analysis shows that the H&M company is the poorly performing company and
there are some recommendation for the company by which it can enhance its financial
performance in coming future. Company can initiate and motivate their employees and can also
organize training programs for them (Drury, 2013). These training session and motivation of
employees will help the company to increasing their productivity which will overall enhance the
profitability and productivity of the company. To enhance the performance H&M can introduce
some cost reducing techniques which can reduce the cost of production and hence increase the
profit margin. The marketing of the product and services also influence the financial
performance of the company (Raynor and et.al., 2016). For example the strong and ethical
marketing of any new or old product of H&M will affect the competitors. The more effective and
12
1 2 3 4 5
0
0.2
0.4
0.6
0.8
1
1.2
1.4
1.6
1.8
2
1.28
1.54 1.48
1.76 1.82
0.72
0.91 0.97
1.18 1.16
Current ratio
Quick ratio
Illustration 4: Graph for H&M
⊘ This is a preview!⊘
Do you want full access?
Subscribe today to unlock all pages.
Trusted by 1+ million students worldwide
1 out of 21
Related Documents


Your All-in-One AI-Powered Toolkit for Academic Success.
+13062052269
info@desklib.com
Available 24*7 on WhatsApp / Email
![[object Object]](/_next/static/media/star-bottom.7253800d.svg)
Unlock your academic potential
Copyright © 2020–2026 A2Z Services. All Rights Reserved. Developed and managed by ZUCOL.