Financial Statement Analysis and Interpretation of Next and Debenhams
VerifiedAdded on 2021/02/21
|24
|3522
|251
Report
AI Summary
This report presents a comprehensive financial statement analysis of Next Plc and Debenhams Plc, two prominent retail companies. It begins with an overview of each company, detailing their business operations and market positions. The core of the report involves a detailed examination of their financial statements, including income statements, balance sheets, and cash flow statements for the years 2016 to 2018. The analysis interprets trends in turnover, operating income, net profit, total assets, liabilities, and shareholder equity. Furthermore, the report employs ratio analysis, focusing on profitability, liquidity, and solvency ratios to assess the companies' financial health and performance. Key ratios such as net profit margin, operating margin, current ratio, quick ratio, and earnings per share are calculated and compared. The report concludes with a comparison of the two companies, highlighting their strengths and weaknesses, and offering insights into their competitive positions and overall financial performance. This analysis provides a thorough understanding of the financial aspects of Next Plc and Debenhams Plc.
Financial Statement
Analysis
Analysis
Paraphrase This Document
Need a fresh take? Get an instant paraphrase of this document with our AI Paraphraser
Table of Contents
INTRODUCTION...........................................................................................................................1
TASK...............................................................................................................................................1
Overview of Company:..........................................................................................................1
Analysis and interpretation of financial statement of NEXT PLC:........................................1
Analysis and interpretation of financial statement of DEBENHAMS PLC:.........................2
Ratio Analysis:.......................................................................................................................3
SWOT analysis of Next Plc:...................................................................................................7
CONCLUSION................................................................................................................................8
REFERENCES................................................................................................................................9
ANNEXURE..................................................................................................................................10
INTRODUCTION
Analysing financial statement is vital for a business entity as it helpful in providing
reliable source for taking momentary and effective decisions. Financial statements are analysed
by external stakeholders to obtain a complete understanding of entire performance of any
particular company, and also they can compare two or more corporates (Cooper, 2017). Internal
stakeholders can also apply such analysis to manage and track the fiscal resources of company.
The study contains an analysis of financial statements of company NEXT Plc and its competitor
DEBENHAMS Plc. Study also evaluate how internal and external factors influencing company's
performance, analysis of ratios and flow of cash.
TASK
Overview of Company:
Next Plc: It is retailer of home products, clothings and foot-wears in UK. Company also
have its business operations across the world. It has about 700 stores worldwide. In sales amount
company holing top position in UK. Company is listed in Stock Exchange of London. It is knows
for providing products at moderate price (Next Plc. 2019). Company's vision is to expand its
business territory and launch large range of new products. It is operating its business and trade
through headquarters at Enderby, Leicestershire, England, United Kingdom. It has approx 44000
employees all over the world.
Debenhams Plc: it UK's multinational retailer and operating its business under
departmental format. Company has approx 179 stores across the world. It engaged in selling
household items, furniture and clothings at retail price. Specially in UK and Ireland company has
department stores only with its own products (Debenhams PLC. 2019). It is listed in London
Stock Exchange. It has headquarters at 10 Brock Street, London, England, United Kingdom.
Company has classified product range in Fashion clothing, cosmetics, accessories, home and
furniture, shoes, gifts, electricals and toys.
Analysis and interpretation of financial statement of NEXT PLC:
Financial Statements of a corporate combines income/revenue statement, balance sheet
and other accounts prepared for finalisation of books. Each of them defines entity's performance
thoroughly while covering different variables. In this context following points contains
interpretation and complete analysis of aspects of financial statement of NEXT Plc, as follows:
1
⊘ This is a preview!⊘
Do you want full access?
Subscribe today to unlock all pages.
Trusted by 1+ million students worldwide
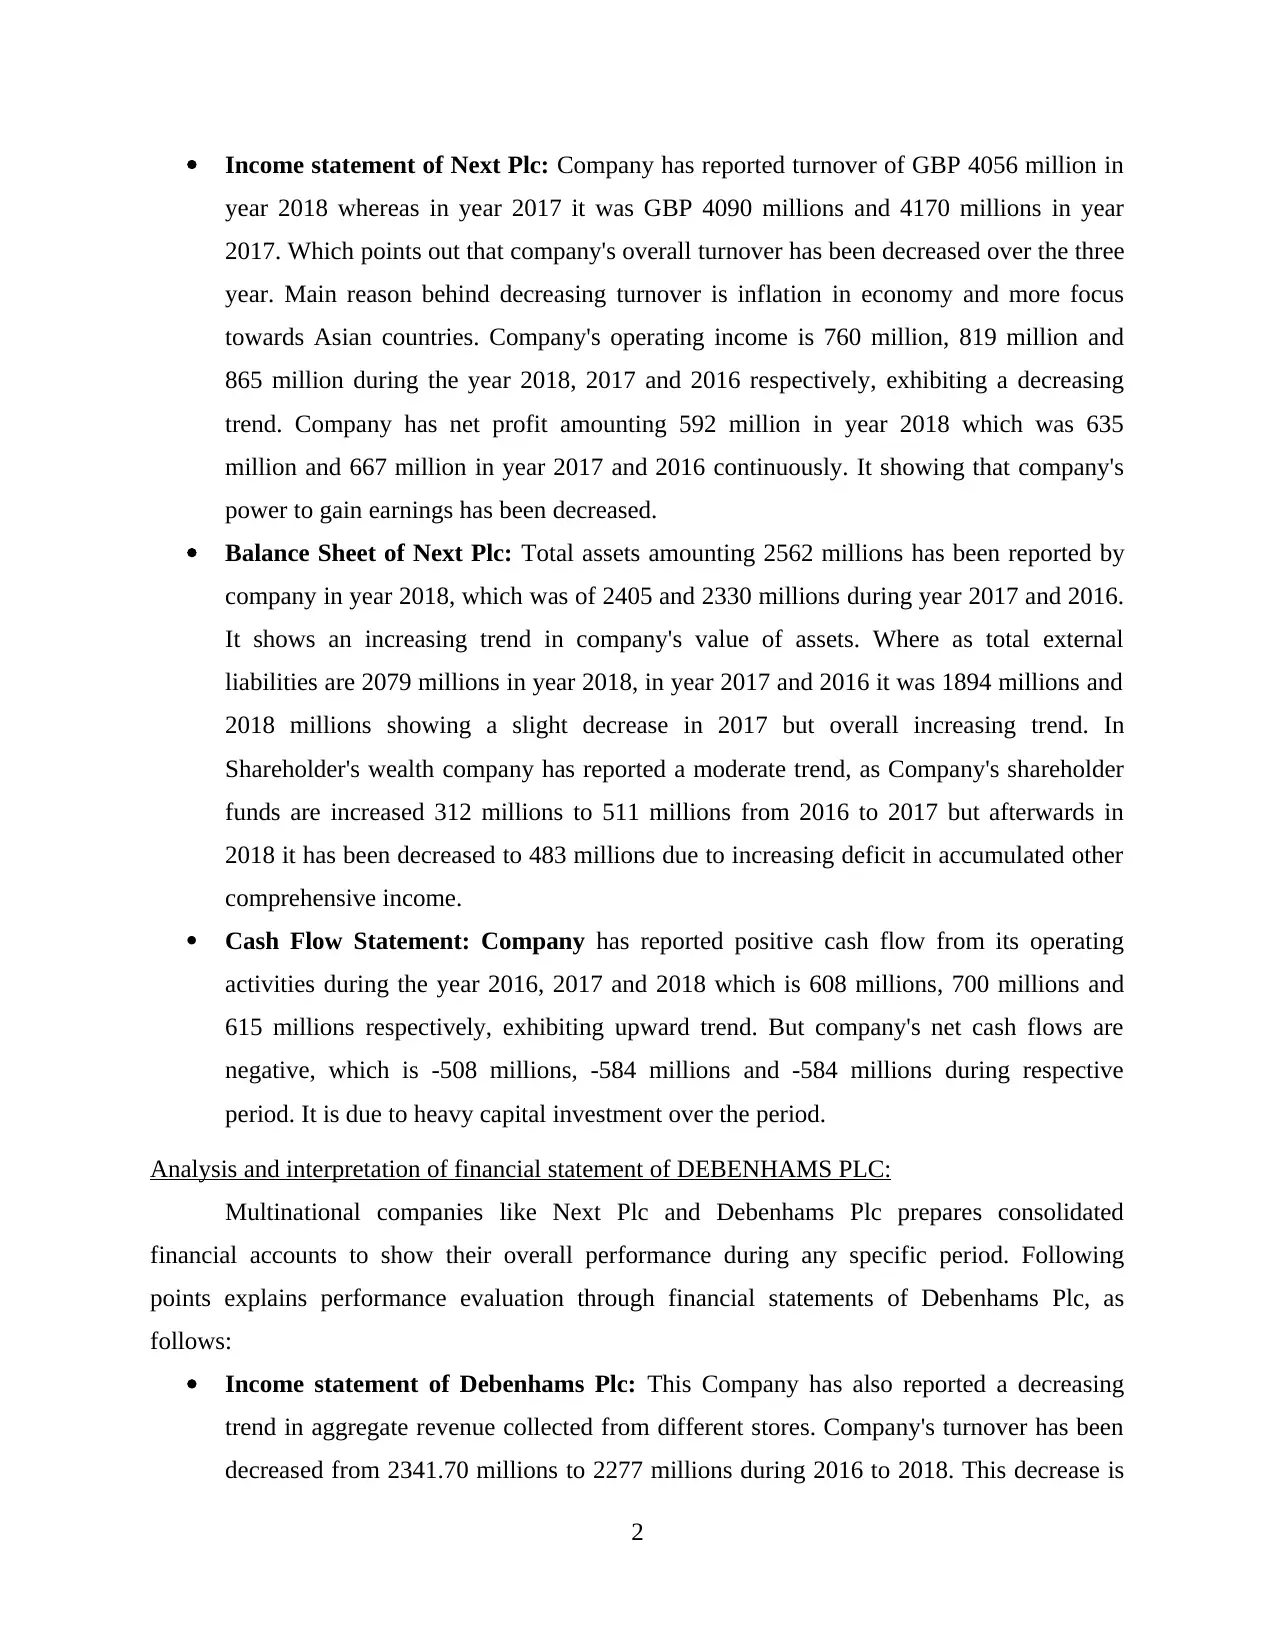
Income statement of Next Plc: Company has reported turnover of GBP 4056 million in
year 2018 whereas in year 2017 it was GBP 4090 millions and 4170 millions in year
2017. Which points out that company's overall turnover has been decreased over the three
year. Main reason behind decreasing turnover is inflation in economy and more focus
towards Asian countries. Company's operating income is 760 million, 819 million and
865 million during the year 2018, 2017 and 2016 respectively, exhibiting a decreasing
trend. Company has net profit amounting 592 million in year 2018 which was 635
million and 667 million in year 2017 and 2016 continuously. It showing that company's
power to gain earnings has been decreased.
Balance Sheet of Next Plc: Total assets amounting 2562 millions has been reported by
company in year 2018, which was of 2405 and 2330 millions during year 2017 and 2016.
It shows an increasing trend in company's value of assets. Where as total external
liabilities are 2079 millions in year 2018, in year 2017 and 2016 it was 1894 millions and
2018 millions showing a slight decrease in 2017 but overall increasing trend. In
Shareholder's wealth company has reported a moderate trend, as Company's shareholder
funds are increased 312 millions to 511 millions from 2016 to 2017 but afterwards in
2018 it has been decreased to 483 millions due to increasing deficit in accumulated other
comprehensive income.
Cash Flow Statement: Company has reported positive cash flow from its operating
activities during the year 2016, 2017 and 2018 which is 608 millions, 700 millions and
615 millions respectively, exhibiting upward trend. But company's net cash flows are
negative, which is -508 millions, -584 millions and -584 millions during respective
period. It is due to heavy capital investment over the period.
Analysis and interpretation of financial statement of DEBENHAMS PLC:
Multinational companies like Next Plc and Debenhams Plc prepares consolidated
financial accounts to show their overall performance during any specific period. Following
points explains performance evaluation through financial statements of Debenhams Plc, as
follows:
Income statement of Debenhams Plc: This Company has also reported a decreasing
trend in aggregate revenue collected from different stores. Company's turnover has been
decreased from 2341.70 millions to 2277 millions during 2016 to 2018. This decrease is
2
Paraphrase This Document
Need a fresh take? Get an instant paraphrase of this document with our AI Paraphraser
reported due to inflationary effects and failure of department stores format. Company's
operating income is negative in 2018 i.e. loss of 173.70 millions. Which was 122.50
million and 83.40 million in year 2016 and 2017 respectively. Net loss of company in
2018 is 461 millions whereas company has gained earning in 2016 and 2017 amounting
85.90 and 48.80 millions respectively. Company should take its serious as a continuous
loss can lead to decline in brand value.
Balance Sheet of Debenhams Plc: Company's total assets are also decreased during
2016 to 2018, however a minor improvement has been reported in year 2017. Company's
total assets amount are 1967.90, 2265.80 and 2191.00 millions in 2018, 2017 and 2016
respectively. Company's shareholder fund also has decreased from 883.90 to 489.40
millions during the year 2016 to 2018, due to decrease in net profit in 2017 and net loss
in year 2018. Company is required to improve their profitability scale in order to improve
shareholder's wealth. Overall liabilities of company showing increasing trend which in
run can hurt company's performance and liquidity.
Cash Flow Statement: Company's operating cash flow is 126.5o million in year 2018,
189.30 million in year 2017 and 224.90 million in year 2016. Where as overall cash flow
is positive during three years which is 38.90, 19.70 and 40.80 million during year 2016,
2017 and 2018 respectively, showing an uneven trend in flow of cash.
From above analysis is has been articulated that Next Ltd's performance is better as
compare to Debenhams Plc. However it is recommended that company should improve their net
profits and turnover to sustain their market share. Overall comparison shows that company is
enjoying competitive advantages to an extent which helping it to retain profitability even in
adverse competitive environment.
Ratio Analysis:
In present trade environment every company want to ensure their performance in all context. So
different fiscal ratios are computed by companies for assessment of their performance as
liquidity position, solvency position etc. Ratios are assessed and compared with standards to
know actual efficiencies of company (DeFusco and et.al., 201). Following tables and points
exhibits ratio analysis of both companies, as follows:
Profitability Ratios: This ratio defines company performance in terms of profitably. These are
most considerable ratio as they provide an overview of company's ability of earning profits.
3
These ratios includes Net Profit Margin ratio, operating profit margin ratio, gross profit margin
ratio etc (Doxey, 2014). Following is comparison of ratios and analysis of profitability ratios of
both entities, as follows:
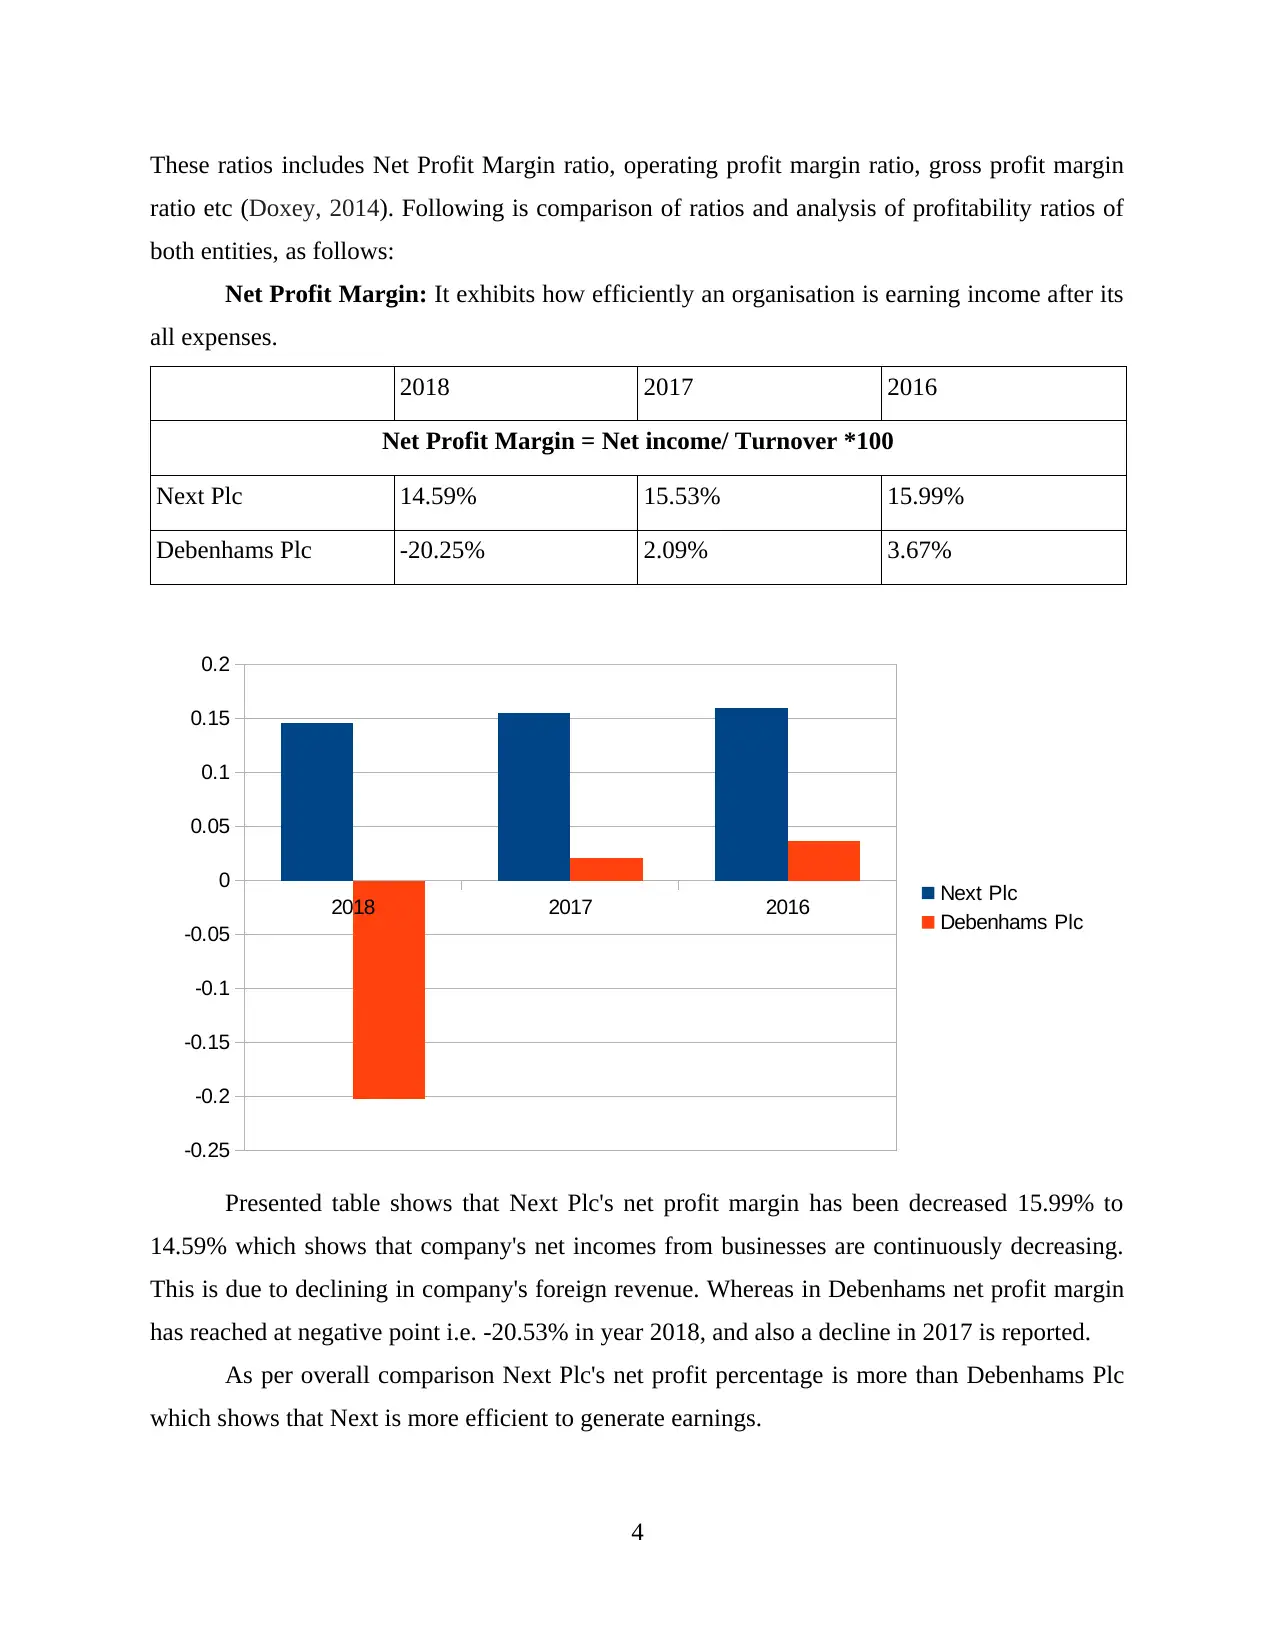
Net Profit Margin: It exhibits how efficiently an organisation is earning income after its
all expenses.
2018 2017 2016
Net Profit Margin = Net income/ Turnover *100
Next Plc 14.59% 15.53% 15.99%
Debenhams Plc -20.25% 2.09% 3.67%
Presented table shows that Next Plc's net profit margin has been decreased 15.99% to
14.59% which shows that company's net incomes from businesses are continuously decreasing.
This is due to declining in company's foreign revenue. Whereas in Debenhams net profit margin
has reached at negative point i.e. -20.53% in year 2018, and also a decline in 2017 is reported.
As per overall comparison Next Plc's net profit percentage is more than Debenhams Plc
which shows that Next is more efficient to generate earnings.
4
2018 2017 2016
-0.25
-0.2
-0.15
-0.1
-0.05
0
0.05
0.1
0.15
0.2
Next Plc
Debenhams Plc
ratio etc (Doxey, 2014). Following is comparison of ratios and analysis of profitability ratios of
both entities, as follows:
Net Profit Margin: It exhibits how efficiently an organisation is earning income after its
all expenses.
2018 2017 2016
Net Profit Margin = Net income/ Turnover *100
Next Plc 14.59% 15.53% 15.99%
Debenhams Plc -20.25% 2.09% 3.67%
Presented table shows that Next Plc's net profit margin has been decreased 15.99% to
14.59% which shows that company's net incomes from businesses are continuously decreasing.
This is due to declining in company's foreign revenue. Whereas in Debenhams net profit margin
has reached at negative point i.e. -20.53% in year 2018, and also a decline in 2017 is reported.
As per overall comparison Next Plc's net profit percentage is more than Debenhams Plc
which shows that Next is more efficient to generate earnings.
4
2018 2017 2016
-0.25
-0.2
-0.15
-0.1
-0.05
0
0.05
0.1
0.15
0.2
Next Plc
Debenhams Plc
⊘ This is a preview!⊘
Do you want full access?
Subscribe today to unlock all pages.
Trusted by 1+ million students worldwide
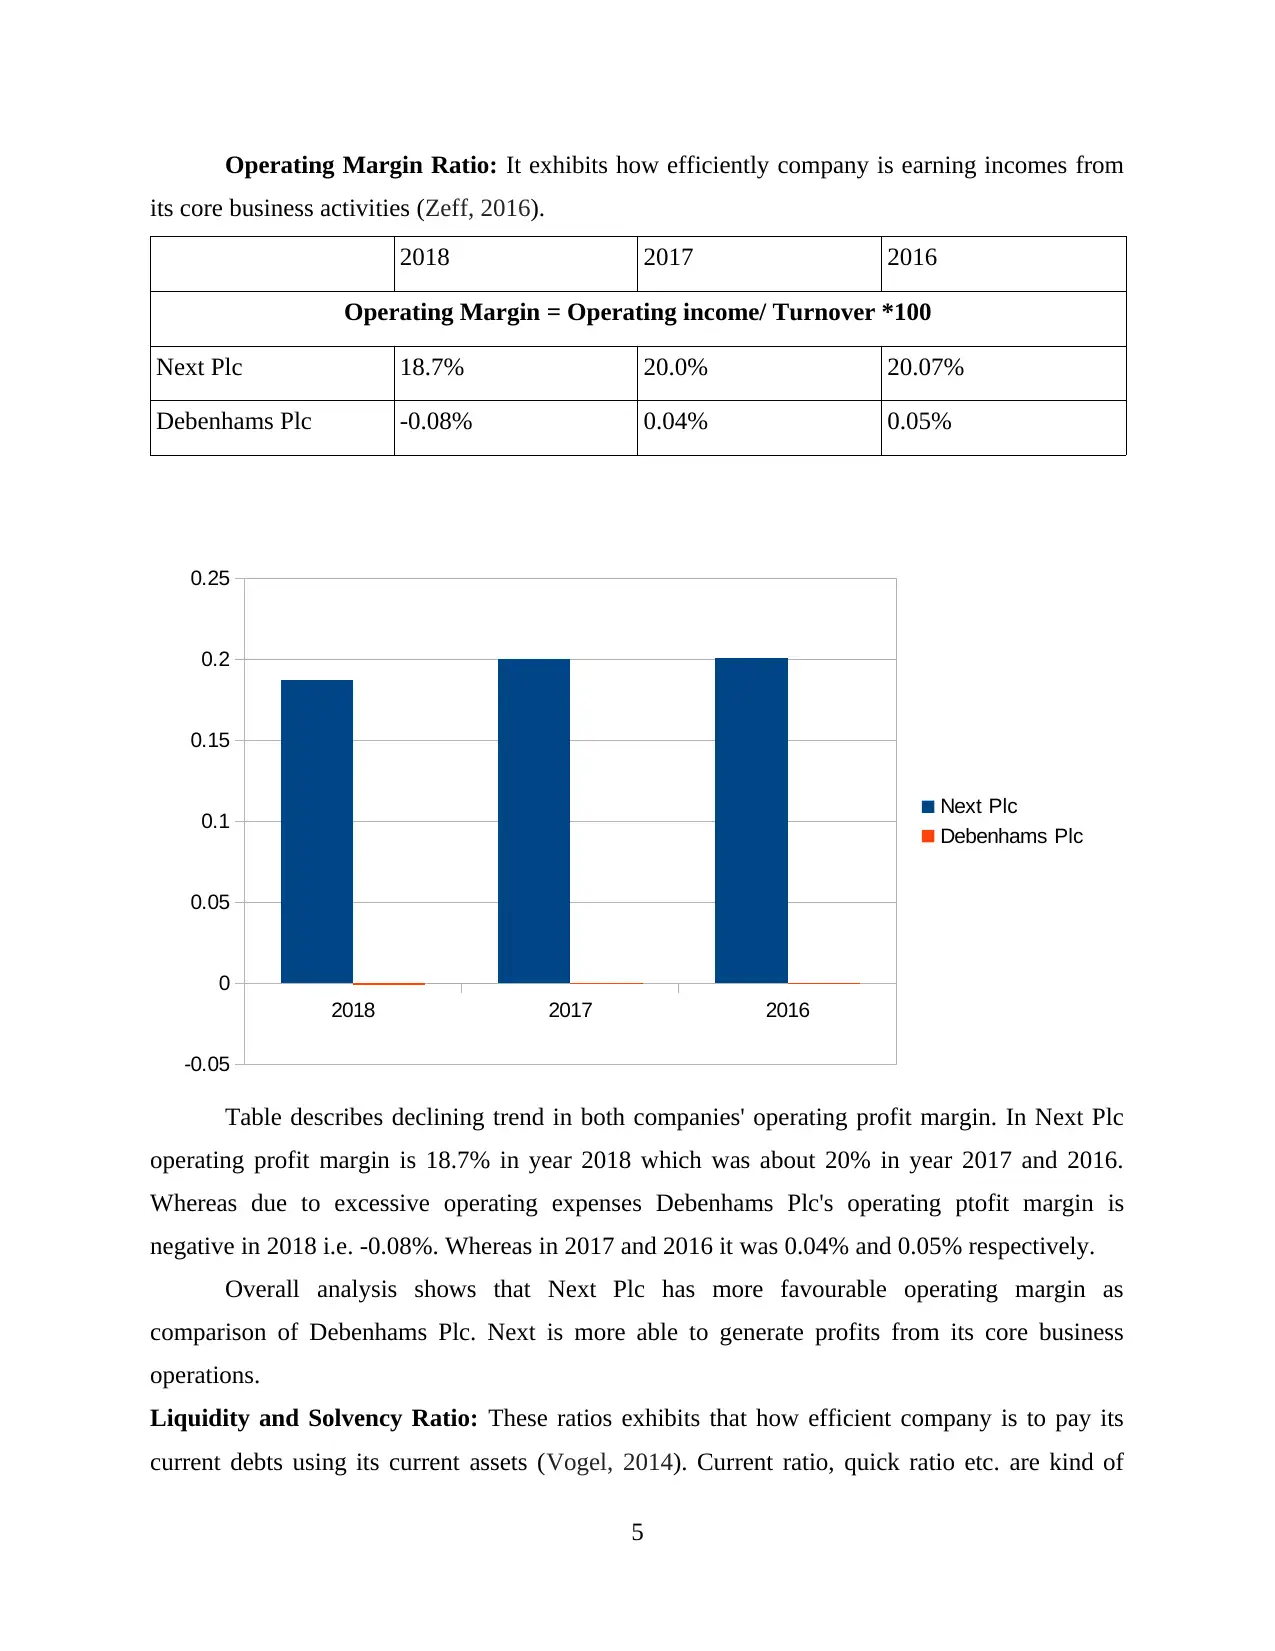
Operating Margin Ratio: It exhibits how efficiently company is earning incomes from
its core business activities (Zeff, 2016).
2018 2017 2016
Operating Margin = Operating income/ Turnover *100
Next Plc 18.7% 20.0% 20.07%
Debenhams Plc -0.08% 0.04% 0.05%
Table describes declining trend in both companies' operating profit margin. In Next Plc
operating profit margin is 18.7% in year 2018 which was about 20% in year 2017 and 2016.
Whereas due to excessive operating expenses Debenhams Plc's operating ptofit margin is
negative in 2018 i.e. -0.08%. Whereas in 2017 and 2016 it was 0.04% and 0.05% respectively.
Overall analysis shows that Next Plc has more favourable operating margin as
comparison of Debenhams Plc. Next is more able to generate profits from its core business
operations.
Liquidity and Solvency Ratio: These ratios exhibits that how efficient company is to pay its
current debts using its current assets (Vogel, 2014). Current ratio, quick ratio etc. are kind of
5
2018 2017 2016
-0.05
0
0.05
0.1
0.15
0.2
0.25
Next Plc
Debenhams Plc
Paraphrase This Document
Need a fresh take? Get an instant paraphrase of this document with our AI Paraphraser
solvency ratio which assist stakeholders and company personnels to assess company's solvency
situation. Following are key liquidity ratio along with analysis in context of both companies, as
follows:
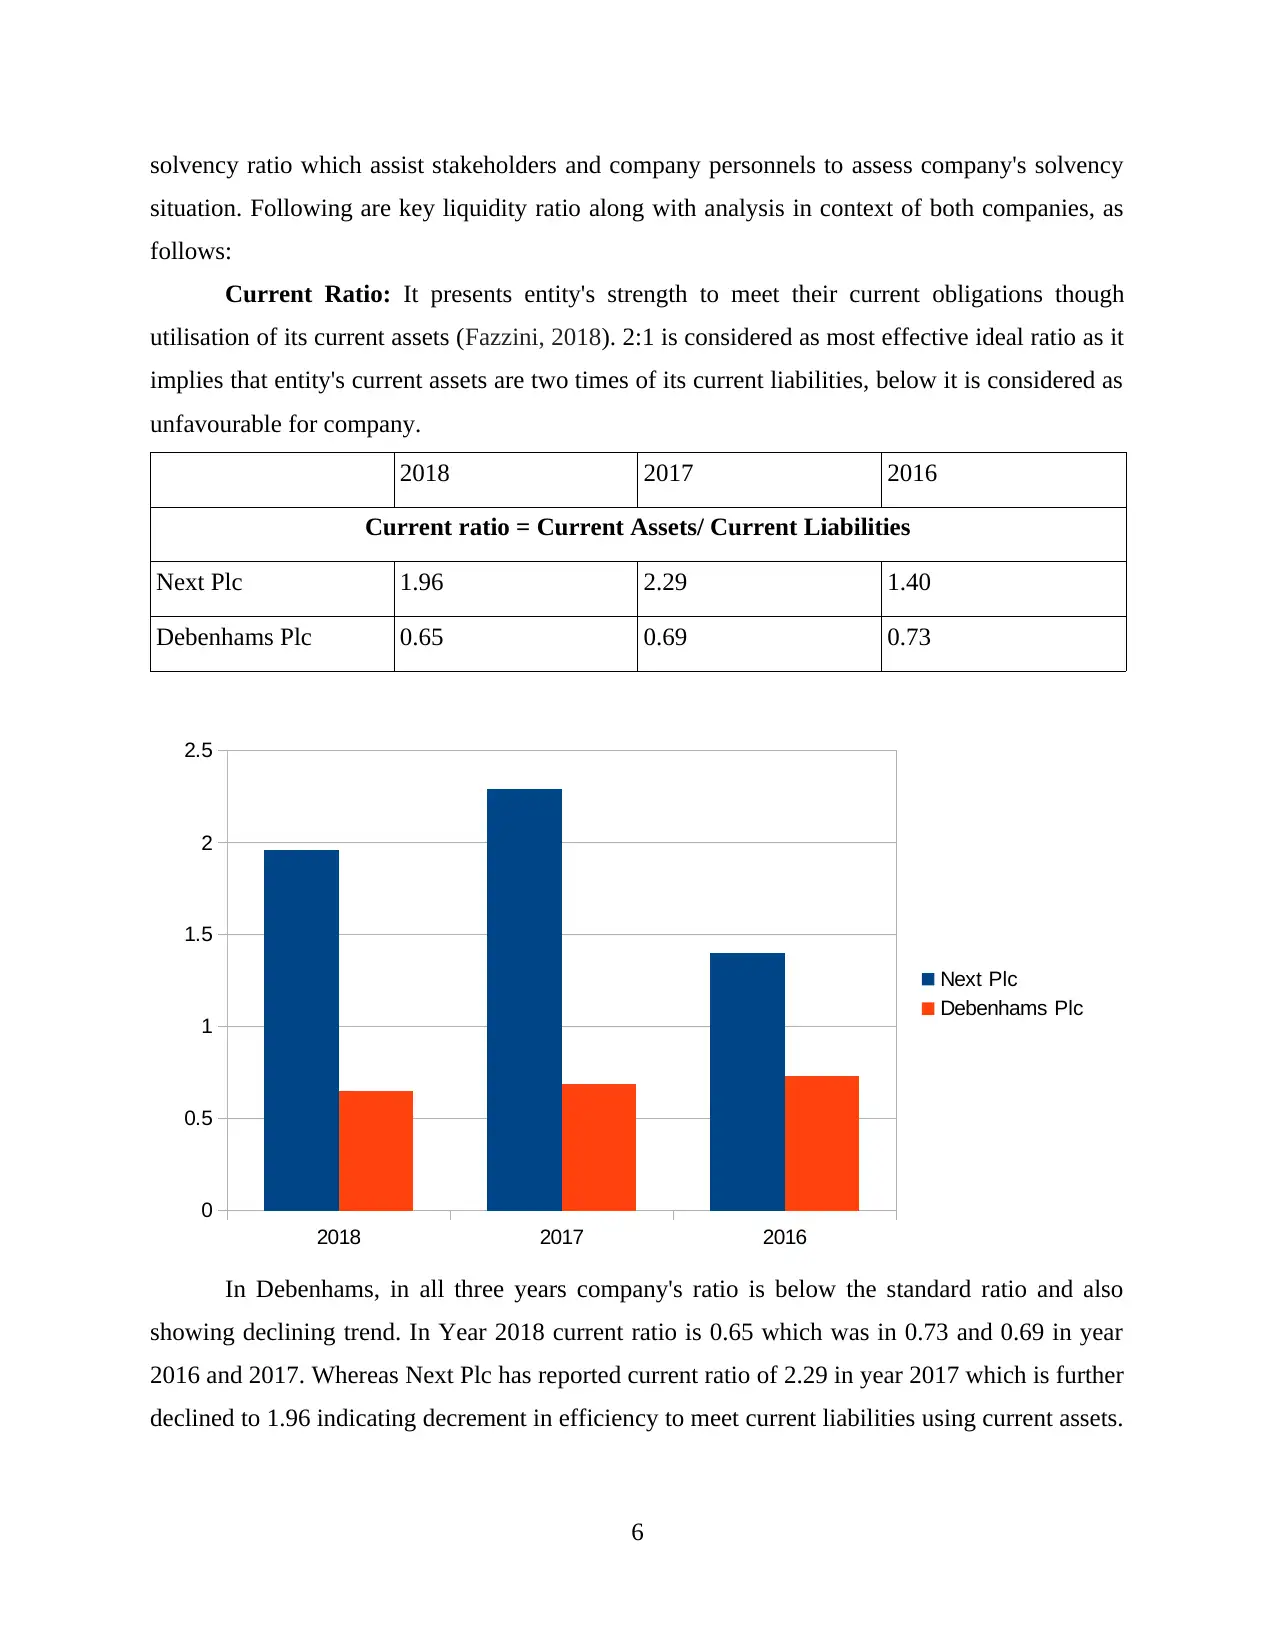
Current Ratio: It presents entity's strength to meet their current obligations though
utilisation of its current assets (Fazzini, 2018). 2:1 is considered as most effective ideal ratio as it
implies that entity's current assets are two times of its current liabilities, below it is considered as
unfavourable for company.
2018 2017 2016
Current ratio = Current Assets/ Current Liabilities
Next Plc 1.96 2.29 1.40
Debenhams Plc 0.65 0.69 0.73
In Debenhams, in all three years company's ratio is below the standard ratio and also
showing declining trend. In Year 2018 current ratio is 0.65 which was in 0.73 and 0.69 in year
2016 and 2017. Whereas Next Plc has reported current ratio of 2.29 in year 2017 which is further
declined to 1.96 indicating decrement in efficiency to meet current liabilities using current assets.
6
2018 2017 2016
0
0.5
1
1.5
2
2.5
Next Plc
Debenhams Plc
situation. Following are key liquidity ratio along with analysis in context of both companies, as
follows:
Current Ratio: It presents entity's strength to meet their current obligations though
utilisation of its current assets (Fazzini, 2018). 2:1 is considered as most effective ideal ratio as it
implies that entity's current assets are two times of its current liabilities, below it is considered as
unfavourable for company.
2018 2017 2016
Current ratio = Current Assets/ Current Liabilities
Next Plc 1.96 2.29 1.40
Debenhams Plc 0.65 0.69 0.73
In Debenhams, in all three years company's ratio is below the standard ratio and also
showing declining trend. In Year 2018 current ratio is 0.65 which was in 0.73 and 0.69 in year
2016 and 2017. Whereas Next Plc has reported current ratio of 2.29 in year 2017 which is further
declined to 1.96 indicating decrement in efficiency to meet current liabilities using current assets.
6
2018 2017 2016
0
0.5
1
1.5
2
2.5
Next Plc
Debenhams Plc
Entire table comparison shows that Next Plc's current ratio more efficient as compare to
Debenhams showing company's solvency potion is more sound.
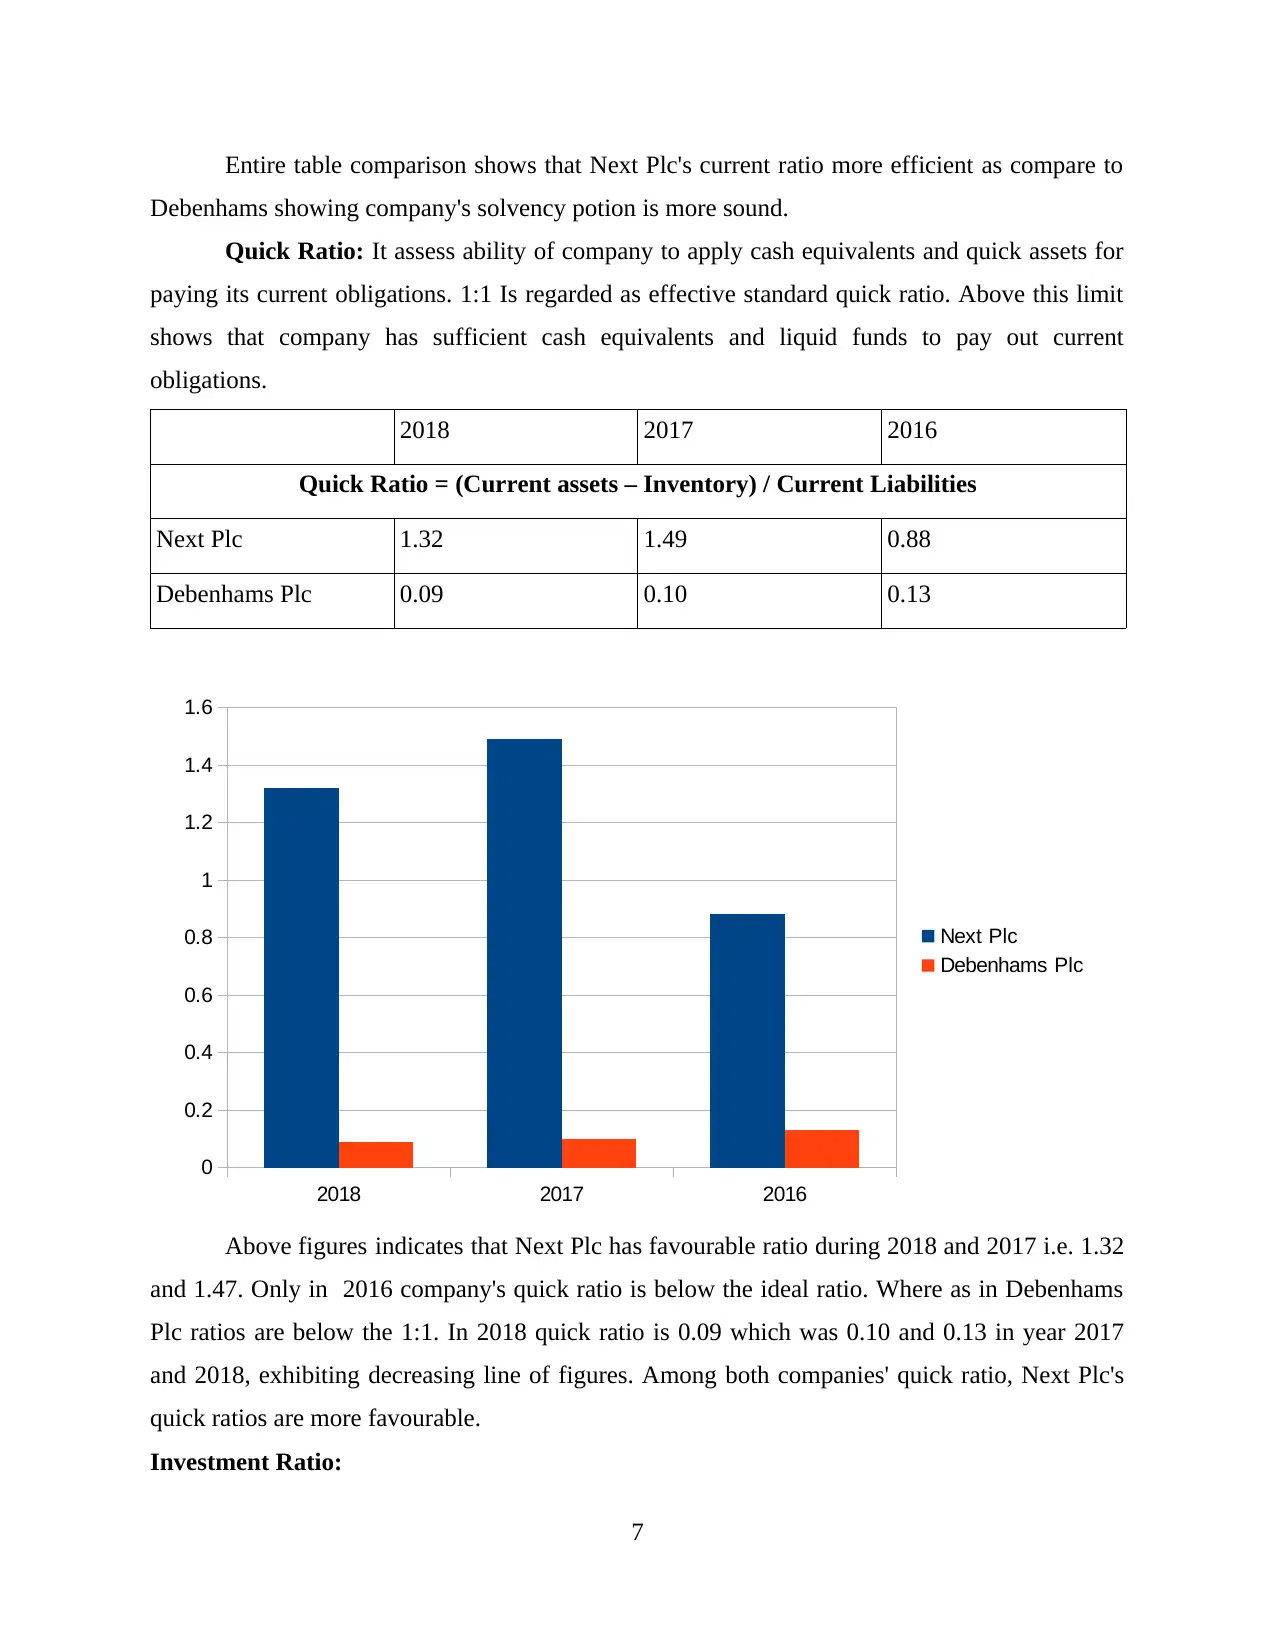
Quick Ratio: It assess ability of company to apply cash equivalents and quick assets for
paying its current obligations. 1:1 Is regarded as effective standard quick ratio. Above this limit
shows that company has sufficient cash equivalents and liquid funds to pay out current
obligations.
2018 2017 2016
Quick Ratio = (Current assets – Inventory) / Current Liabilities
Next Plc 1.32 1.49 0.88
Debenhams Plc 0.09 0.10 0.13
Above figures indicates that Next Plc has favourable ratio during 2018 and 2017 i.e. 1.32
and 1.47. Only in 2016 company's quick ratio is below the ideal ratio. Where as in Debenhams
Plc ratios are below the 1:1. In 2018 quick ratio is 0.09 which was 0.10 and 0.13 in year 2017
and 2018, exhibiting decreasing line of figures. Among both companies' quick ratio, Next Plc's
quick ratios are more favourable.
Investment Ratio:
7
2018 2017 2016
0
0.2
0.4
0.6
0.8
1
1.2
1.4
1.6
Next Plc
Debenhams Plc
Debenhams showing company's solvency potion is more sound.
Quick Ratio: It assess ability of company to apply cash equivalents and quick assets for
paying its current obligations. 1:1 Is regarded as effective standard quick ratio. Above this limit
shows that company has sufficient cash equivalents and liquid funds to pay out current
obligations.
2018 2017 2016
Quick Ratio = (Current assets – Inventory) / Current Liabilities
Next Plc 1.32 1.49 0.88
Debenhams Plc 0.09 0.10 0.13
Above figures indicates that Next Plc has favourable ratio during 2018 and 2017 i.e. 1.32
and 1.47. Only in 2016 company's quick ratio is below the ideal ratio. Where as in Debenhams
Plc ratios are below the 1:1. In 2018 quick ratio is 0.09 which was 0.10 and 0.13 in year 2017
and 2018, exhibiting decreasing line of figures. Among both companies' quick ratio, Next Plc's
quick ratios are more favourable.
Investment Ratio:
7
2018 2017 2016
0
0.2
0.4
0.6
0.8
1
1.2
1.4
1.6
Next Plc
Debenhams Plc
⊘ This is a preview!⊘
Do you want full access?
Subscribe today to unlock all pages.
Trusted by 1+ million students worldwide
These ratios are aim to provide assistance to stakeholders regarding decisions of making
investment in companies (Schmidlin, 2014). It shows investment viability in context of securities
of company. Following discussion analyse the different investment ratio for both companies as
follows:
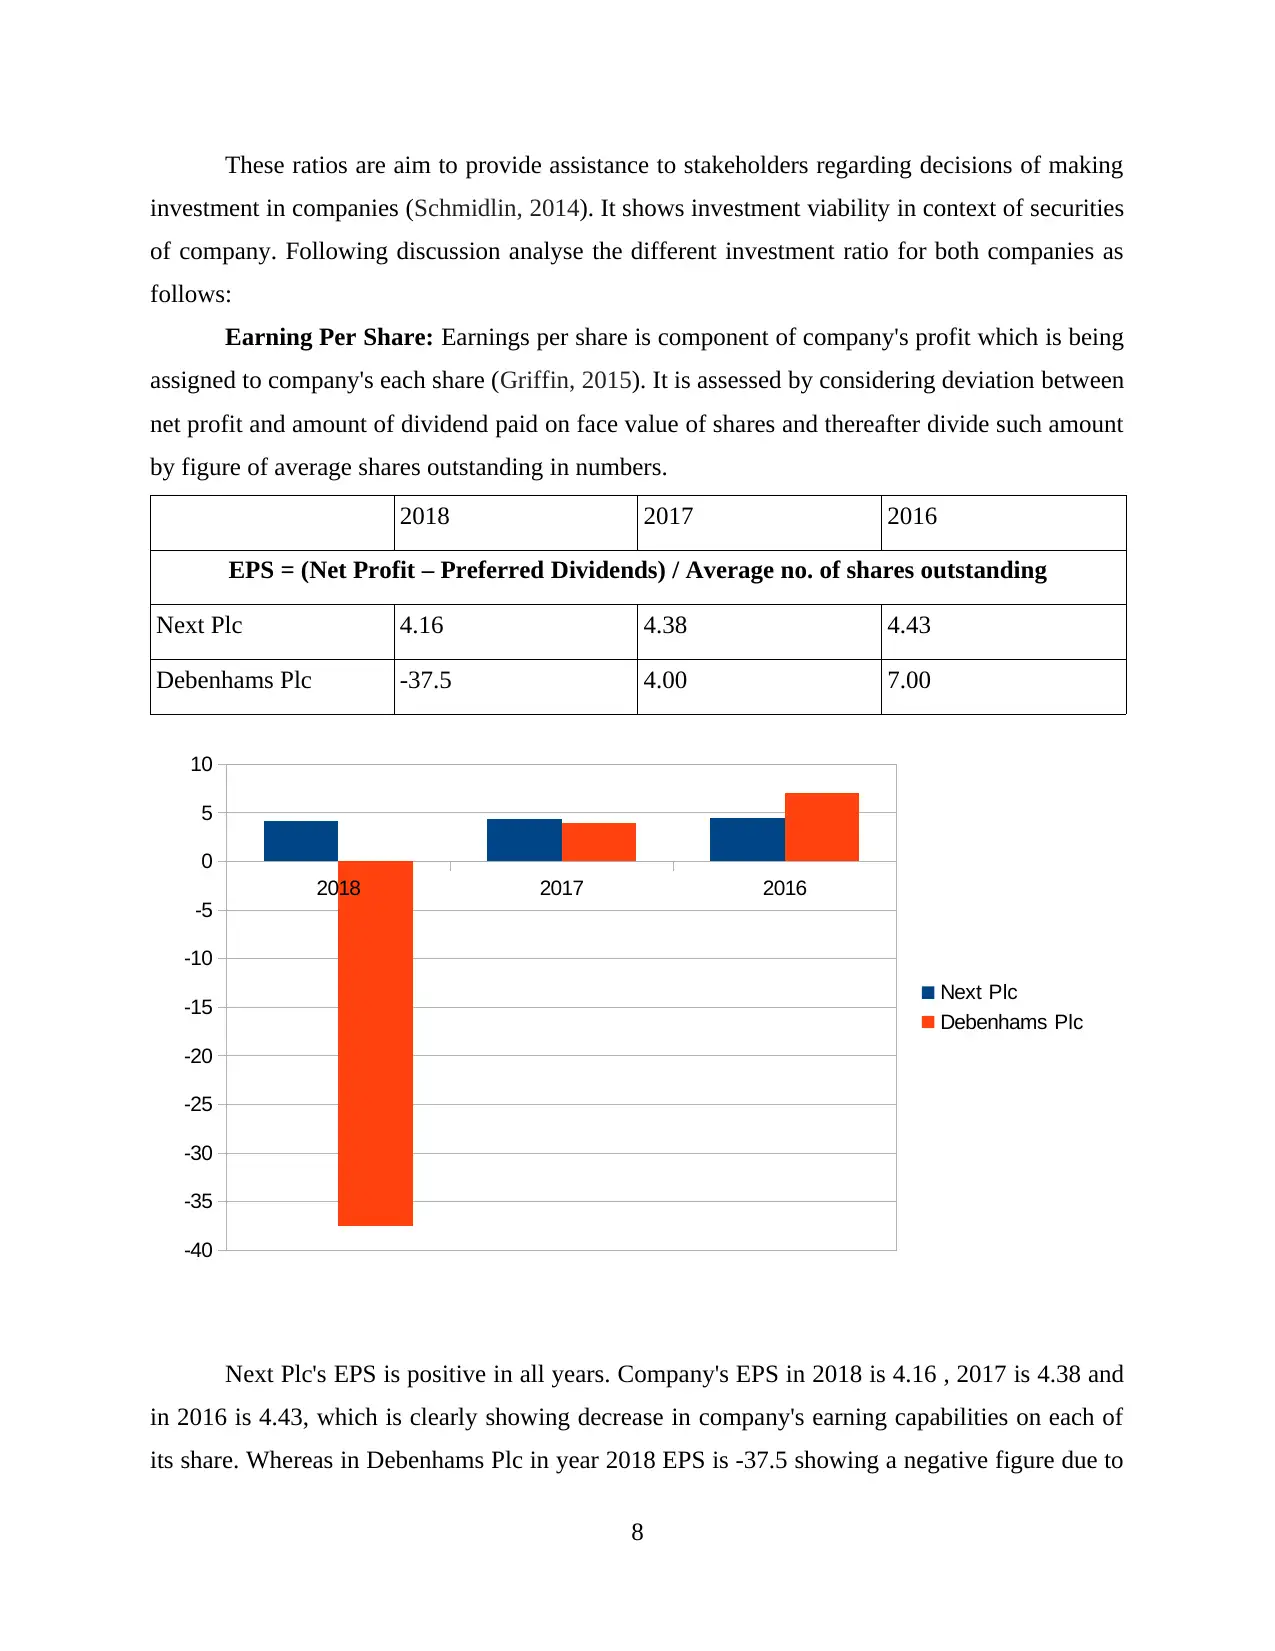
Earning Per Share: Earnings per share is component of company's profit which is being
assigned to company's each share (Griffin, 2015). It is assessed by considering deviation between
net profit and amount of dividend paid on face value of shares and thereafter divide such amount
by figure of average shares outstanding in numbers.
2018 2017 2016
EPS = (Net Profit – Preferred Dividends) / Average no. of shares outstanding
Next Plc 4.16 4.38 4.43
Debenhams Plc -37.5 4.00 7.00
Next Plc's EPS is positive in all years. Company's EPS in 2018 is 4.16 , 2017 is 4.38 and
in 2016 is 4.43, which is clearly showing decrease in company's earning capabilities on each of
its share. Whereas in Debenhams Plc in year 2018 EPS is -37.5 showing a negative figure due to
8
2018 2017 2016
-40
-35
-30
-25
-20
-15
-10
-5
0
5
10
Next Plc
Debenhams Plc
investment in companies (Schmidlin, 2014). It shows investment viability in context of securities
of company. Following discussion analyse the different investment ratio for both companies as
follows:
Earning Per Share: Earnings per share is component of company's profit which is being
assigned to company's each share (Griffin, 2015). It is assessed by considering deviation between
net profit and amount of dividend paid on face value of shares and thereafter divide such amount
by figure of average shares outstanding in numbers.
2018 2017 2016
EPS = (Net Profit – Preferred Dividends) / Average no. of shares outstanding
Next Plc 4.16 4.38 4.43
Debenhams Plc -37.5 4.00 7.00
Next Plc's EPS is positive in all years. Company's EPS in 2018 is 4.16 , 2017 is 4.38 and
in 2016 is 4.43, which is clearly showing decrease in company's earning capabilities on each of
its share. Whereas in Debenhams Plc in year 2018 EPS is -37.5 showing a negative figure due to
8
2018 2017 2016
-40
-35
-30
-25
-20
-15
-10
-5
0
5
10
Next Plc
Debenhams Plc
Paraphrase This Document
Need a fresh take? Get an instant paraphrase of this document with our AI Paraphraser
net loss in year 2018. In 2017 EPS is 4.00 which was 7.00 in 2016, showing decline in EPS.
Entire comparative table showing that Next Plc is more efficient to provide return on its
securities.
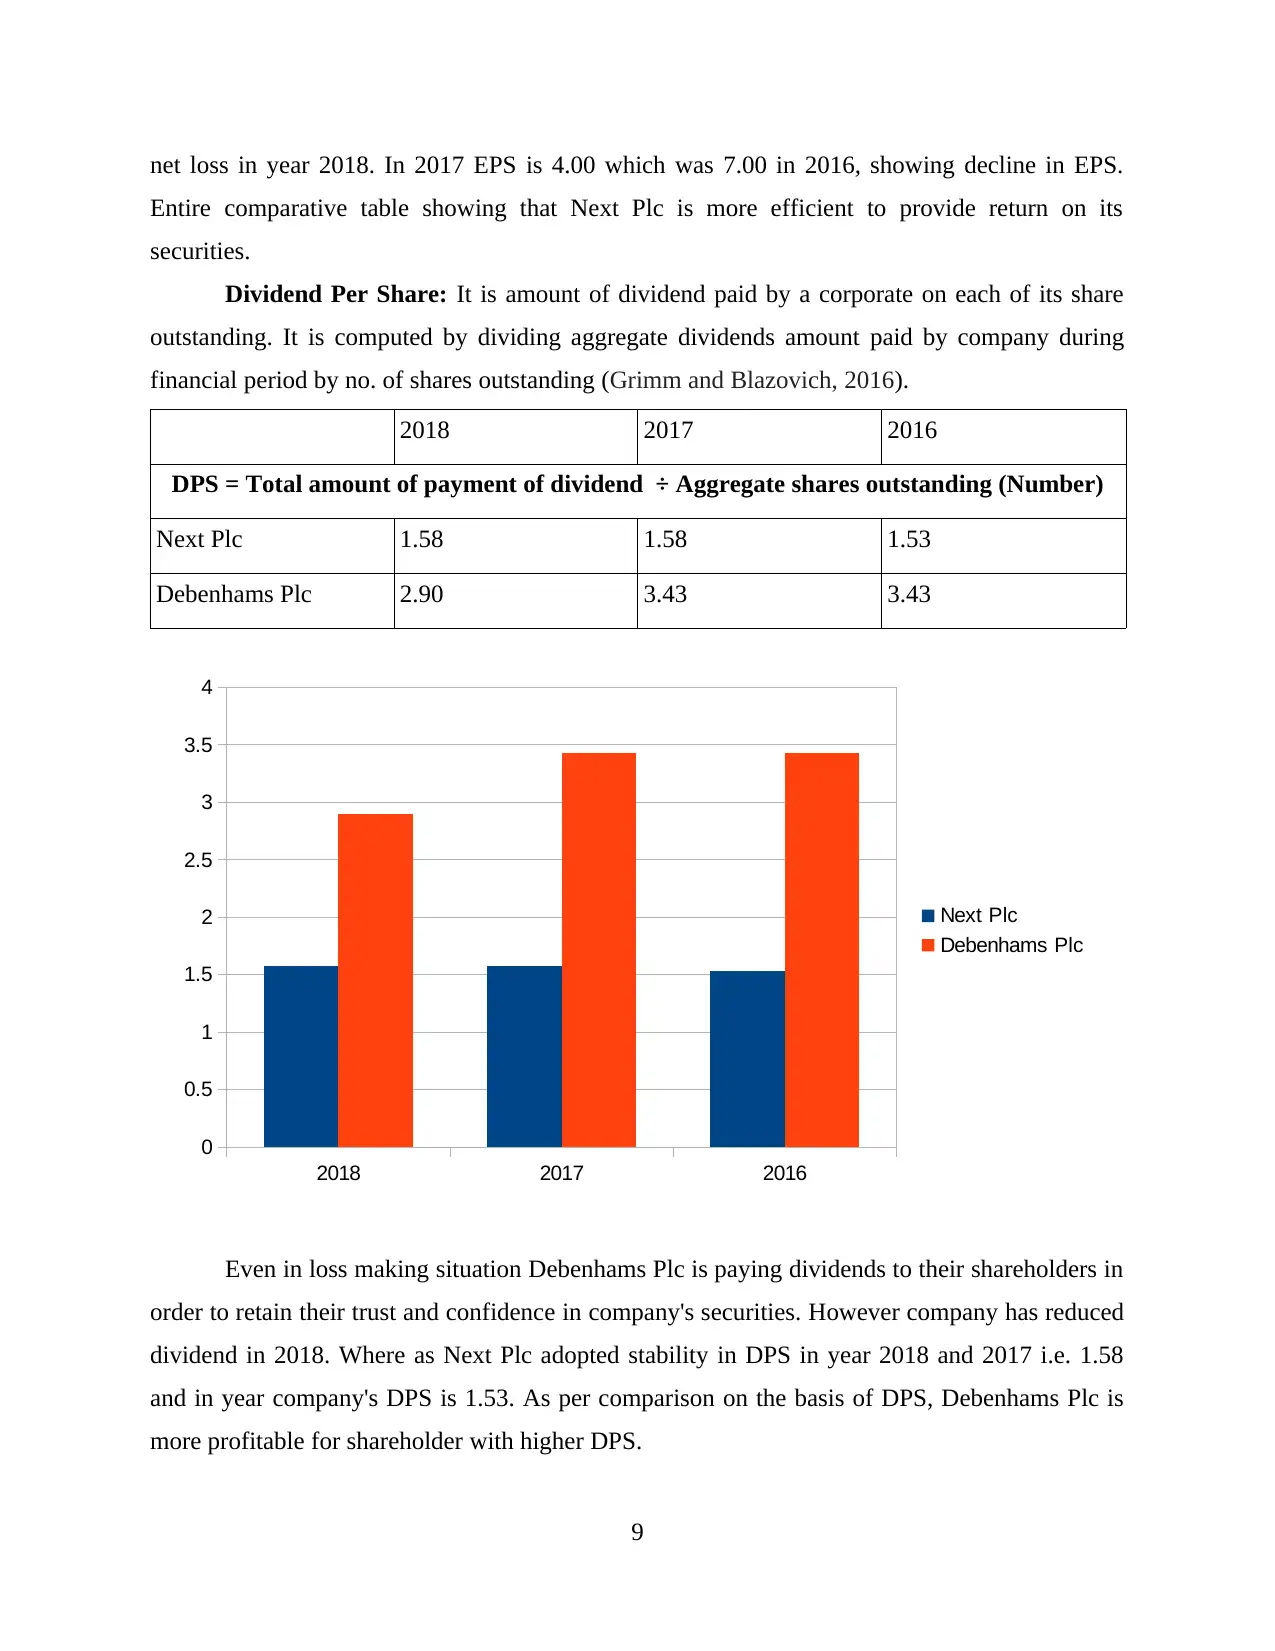
Dividend Per Share: It is amount of dividend paid by a corporate on each of its share
outstanding. It is computed by dividing aggregate dividends amount paid by company during
financial period by no. of shares outstanding (Grimm and Blazovich, 2016).
2018 2017 2016
DPS = Total amount of payment of dividend ÷ Aggregate shares outstanding (Number)
Next Plc 1.58 1.58 1.53
Debenhams Plc 2.90 3.43 3.43
Even in loss making situation Debenhams Plc is paying dividends to their shareholders in
order to retain their trust and confidence in company's securities. However company has reduced
dividend in 2018. Where as Next Plc adopted stability in DPS in year 2018 and 2017 i.e. 1.58
and in year company's DPS is 1.53. As per comparison on the basis of DPS, Debenhams Plc is
more profitable for shareholder with higher DPS.
9
2018 2017 2016
0
0.5
1
1.5
2
2.5
3
3.5
4
Next Plc
Debenhams Plc
Entire comparative table showing that Next Plc is more efficient to provide return on its
securities.
Dividend Per Share: It is amount of dividend paid by a corporate on each of its share
outstanding. It is computed by dividing aggregate dividends amount paid by company during
financial period by no. of shares outstanding (Grimm and Blazovich, 2016).
2018 2017 2016
DPS = Total amount of payment of dividend ÷ Aggregate shares outstanding (Number)
Next Plc 1.58 1.58 1.53
Debenhams Plc 2.90 3.43 3.43
Even in loss making situation Debenhams Plc is paying dividends to their shareholders in
order to retain their trust and confidence in company's securities. However company has reduced
dividend in 2018. Where as Next Plc adopted stability in DPS in year 2018 and 2017 i.e. 1.58
and in year company's DPS is 1.53. As per comparison on the basis of DPS, Debenhams Plc is
more profitable for shareholder with higher DPS.
9
2018 2017 2016
0
0.5
1
1.5
2
2.5
3
3.5
4
Next Plc
Debenhams Plc
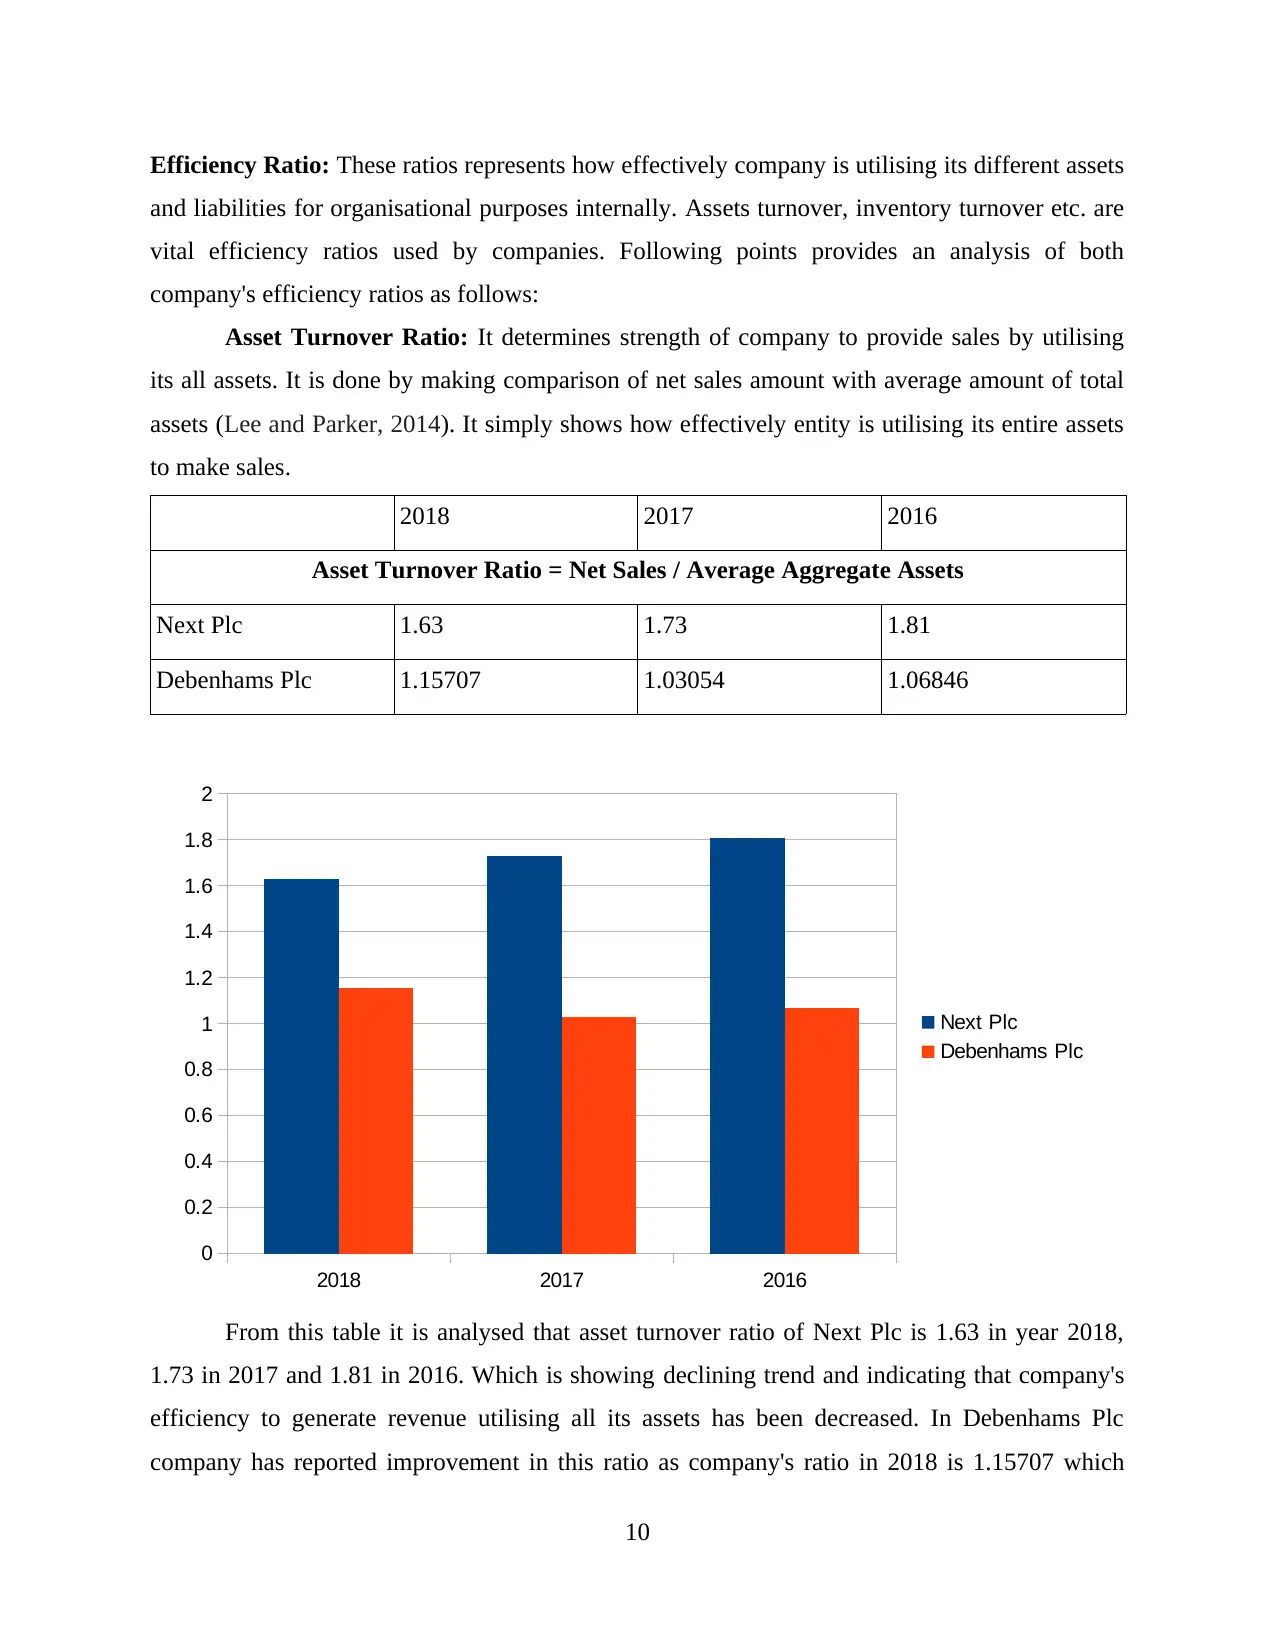
Efficiency Ratio: These ratios represents how effectively company is utilising its different assets
and liabilities for organisational purposes internally. Assets turnover, inventory turnover etc. are
vital efficiency ratios used by companies. Following points provides an analysis of both
company's efficiency ratios as follows:
Asset Turnover Ratio: It determines strength of company to provide sales by utilising
its all assets. It is done by making comparison of net sales amount with average amount of total
assets (Lee and Parker, 2014). It simply shows how effectively entity is utilising its entire assets
to make sales.
2018 2017 2016
Asset Turnover Ratio = Net Sales / Average Aggregate Assets
Next Plc 1.63 1.73 1.81
Debenhams Plc 1.15707 1.03054 1.06846
From this table it is analysed that asset turnover ratio of Next Plc is 1.63 in year 2018,
1.73 in 2017 and 1.81 in 2016. Which is showing declining trend and indicating that company's
efficiency to generate revenue utilising all its assets has been decreased. In Debenhams Plc
company has reported improvement in this ratio as company's ratio in 2018 is 1.15707 which
10
2018 2017 2016
0
0.2
0.4
0.6
0.8
1
1.2
1.4
1.6
1.8
2
Next Plc
Debenhams Plc
⊘ This is a preview!⊘
Do you want full access?
Subscribe today to unlock all pages.
Trusted by 1+ million students worldwide
1 out of 24
Related Documents


Your All-in-One AI-Powered Toolkit for Academic Success.
+13062052269
info@desklib.com
Available 24*7 on WhatsApp / Email
![[object Object]](/_next/static/media/star-bottom.7253800d.svg)
Unlock your academic potential
Copyright © 2020–2026 A2Z Services. All Rights Reserved. Developed and managed by ZUCOL.