Financial Management Report: Investment Appraisal Techniques Analysis
VerifiedAdded on 2020/02/03
|10
|2637
|76
Report
AI Summary
This report delves into key financial management techniques essential for business decision-making. It begins by exploring capital budgeting, a method for assessing project viability, and its relationship with sensitivity and scenario analysis. Sensitivity analysis is examined as a tool for determining project uncertainty, while scenario analysis helps forecast the future value of investments under various conditions. The report then transitions to a comparative analysis of the Capital Asset Pricing Model (CAPM) and the Capital Market Line (CML), highlighting their similarities and differences in evaluating investment returns and risks. CAPM is presented as a method to determine the return generated from an asset, while CML is used to analyze the market value of an asset by CAPM. The report concludes by emphasizing the importance of these tools in making effective financial decisions and enhancing business profitability.

FINANCIAL
MANAGEMENT
MANAGEMENT
Paraphrase This Document
Need a fresh take? Get an instant paraphrase of this document with our AI Paraphraser
TABLE OF CONTENTS
INTRODUCTION...........................................................................................................................1
TASK 1............................................................................................................................................1
Sensitivity and scenario analysis relating to capital budgeting techniques.................................1
A. Sensitivity analysis.................................................................................................................1
B. Scenario analysis....................................................................................................................3
TASK 2............................................................................................................................................4
Similarities as well as differences between CAPM and CML model.........................................4
CONCLUSION................................................................................................................................6
REFERENCES................................................................................................................................7
INTRODUCTION
Finance is plays an integral role in each and every business organisation in order
to exist and run in the industry. Without financial resources the entity can not establish in
market and offers goods and services to the consumers. Further, to manage financial
resources is also necessary with help of better and effective decision making. The present
report throws light on three methods of decision making such as sensitivity analysis,
capital budgeting and scenario analysis. It describes relation between sensitivity analysis
and capital budgeting as well as scenario analysis and investment appraisal techniques. In
the second part it shows differences as well as similarities among the capital asset pricing
model and capital market line.
TASK 1
Sensitivity and scenario analysis relating to capital budgeting techniques
Capital budgeting is a technique which helps to management in order to assess the
viability of a project from two or more mutually exclusive projects. There are various methods of
capital budgeting where the company is able to determine risk, return as well as future value of
the potential investment. The various tools are such as net present value, internal rate of return,
average rate of return, payback period etc (Coffie and Chukwulobelu, 2012). The investment
appraisal techniques are related to the sensitivity as well as scenario analysis in order to manage
financial resources of the company. Relation between the two analysis with reference to capital
budgeting tools is given as below:
A. Sensitivity analysis
The analysis is helps to the managers in order to determine uncertainty of the project that
whether investment will impact on financial performance of the firm in positive manner or
negative manner. Sensitivity analysis is a process which consists changing in forecasting or make
assumptions for analyse and derive project's finance impacts on the business performance. It can
be known as an uncertainty analysis as well by which the company is able to determine future
value of the firm (Capital Budgeting Techniques: Certainty and Risk, 2016). Most of the
companies are use capital budgeting tools for undertake a project and take appropriate business
decisions. On the other side capital budgeting is helps to the company in order to determine the
1
⊘ This is a preview!⊘
Do you want full access?
Subscribe today to unlock all pages.
Trusted by 1+ million students worldwide
value of potential investment for the upcoming financial year. Apart from this it shows the time
frame that within how many years a project will be recover. Simulation analysis is a
mathematical model with help of cash inflows and outflows which are determined by capital
budgeting techniques.
The mathematical model gives idea and analyse about the investment with help of
probability distribution. The distribution is a statistical tool which used by the analyser in order
to derive probability of a variable that another variable will be impact on the investment or not.
Capital budgeting is helps to calculate cash inflow in the future of the investment which is
known as net present value. With help of the sensitivity analysis as well as capital budgeting
methods the management is able to analyse about the investment before investing. Moreover, the
simulation or sensitivity analysis is gives the information that how much probability a project has
in order to generating cash flow by which the manager is able to take better and effective
decisions. Hence, it can be said that sensitivity and investment appraisal analysis both are related
up to greater extent in the company (Marshall, 2015). Relation between both the analysis or
techniques for derive future value, risk and return of the investment as well as making business
decisions is explained with a chart which is given as below:
2
Paraphrase This Document
Need a fresh take? Get an instant paraphrase of this document with our AI Paraphraser
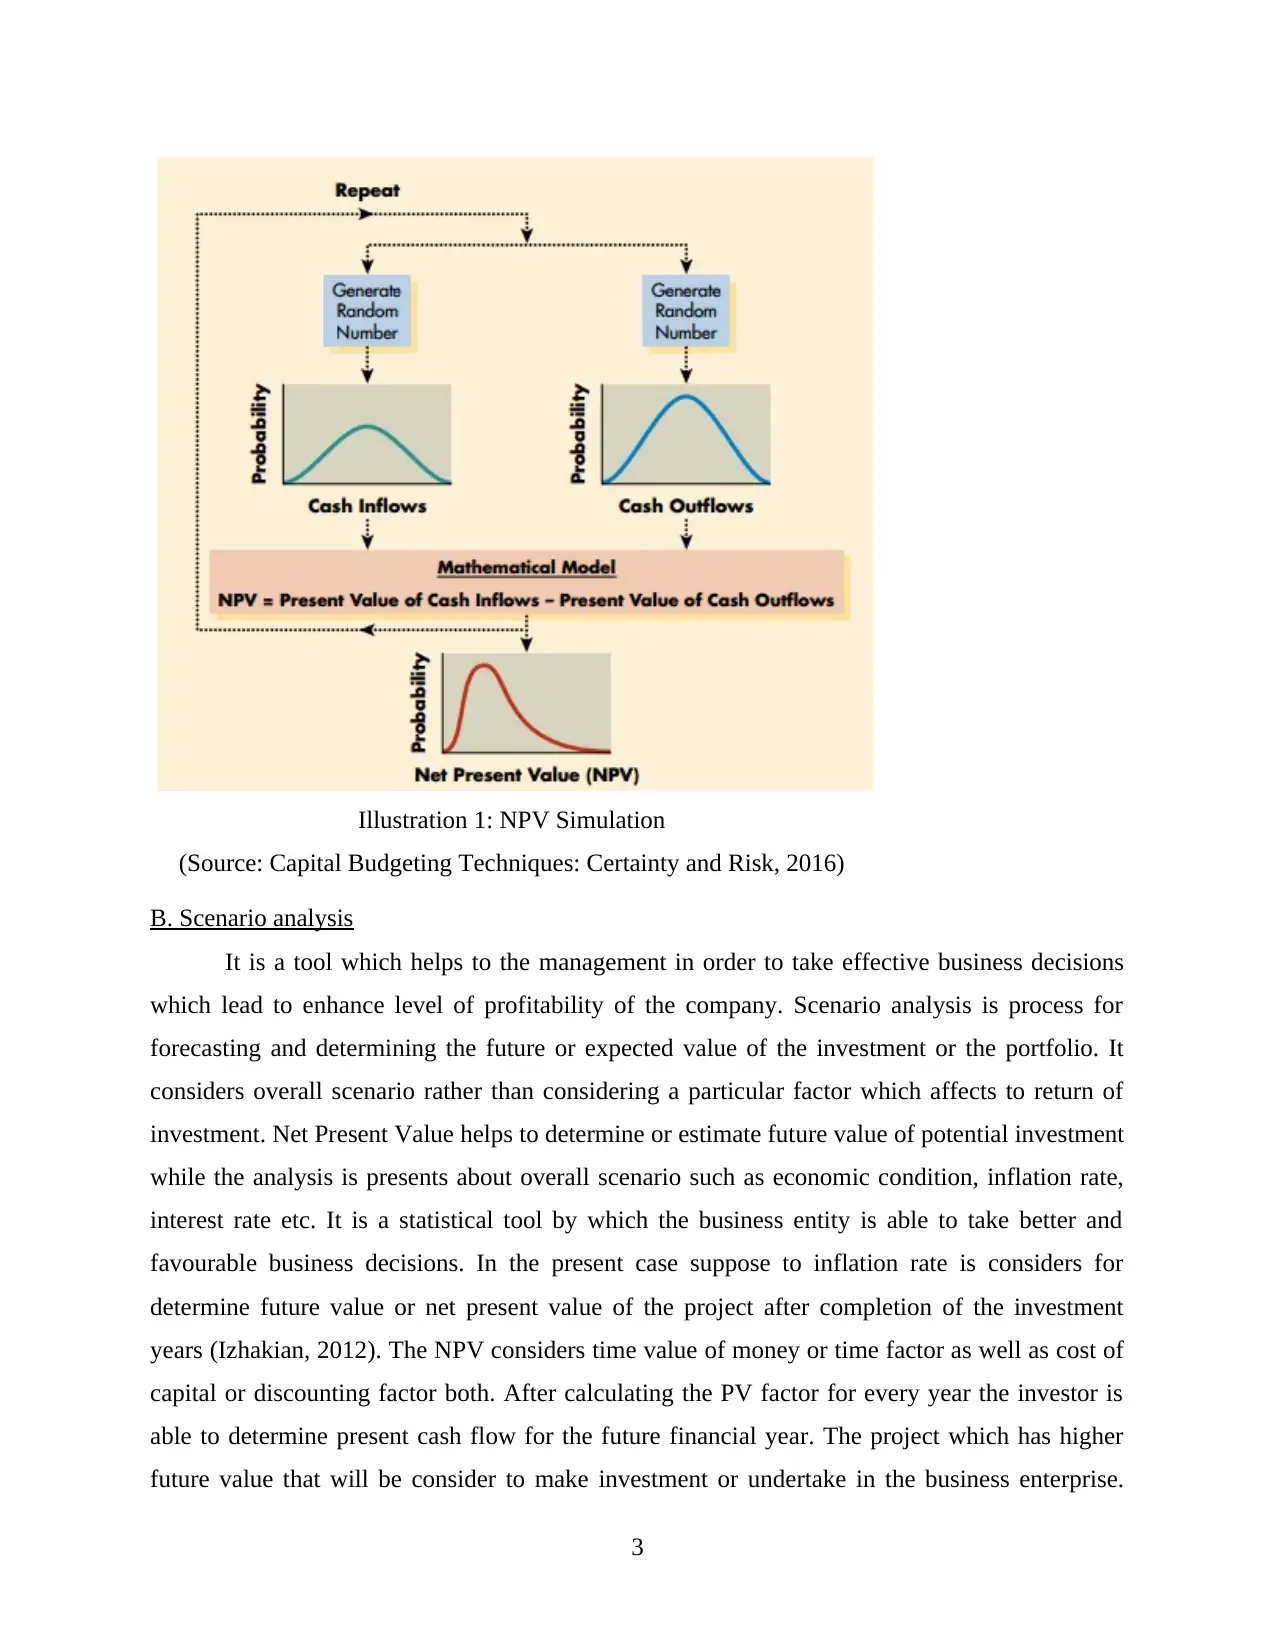
Illustration 1: NPV Simulation
(Source: Capital Budgeting Techniques: Certainty and Risk, 2016)
B. Scenario analysis
It is a tool which helps to the management in order to take effective business decisions
which lead to enhance level of profitability of the company. Scenario analysis is process for
forecasting and determining the future or expected value of the investment or the portfolio. It
considers overall scenario rather than considering a particular factor which affects to return of
investment. Net Present Value helps to determine or estimate future value of potential investment
while the analysis is presents about overall scenario such as economic condition, inflation rate,
interest rate etc. It is a statistical tool by which the business entity is able to take better and
favourable business decisions. In the present case suppose to inflation rate is considers for
determine future value or net present value of the project after completion of the investment
years (Izhakian, 2012). The NPV considers time value of money or time factor as well as cost of
capital or discounting factor both. After calculating the PV factor for every year the investor is
able to determine present cash flow for the future financial year. The project which has higher
future value that will be consider to make investment or undertake in the business enterprise.
3
Further the discounting factor is based on the economic condition of the country where inflation
rate, interest rate etc. are considers.
Furthermore, in terms of scenario analysis if inflation rate is increases then it impacts on
interest rate as well as discounting factor of the project. When cost of capital get fluctuate then
net present value of potential investment as well. Without value of cost of capital it is unable to
determine net present value after completion of the project. The scenario analysis is based on
every scenario of the country's economy, by which the management is able to know financial
impact on the portfolio (Hsieh and Hodnett, 2012). It helps to take better business decisions by
which the company can choose high profitable investment avenue and enhance profitability of
the business. Hence, it can be said that both the tools such as capital budgeting and scenario
analysis are related with each other for taking investment decisions.
TASK 2
Similarities as well as differences between CAPM and CML model
Capital asset pricing model(CAPM)
Capital asset pricing model(CAPM) is used to identify the amount generated in form of
return from an asset. This method is used in order to take decisions at the time of adding an asset
to the portfolio. Additionally, the stated method is taken into consideration at the time of
analysing the sensitivity of an asset during non diversifiable risk. It can also be said that it is a
technique through which the rate of return is calculated against a risky asset. Adoption of this
model is necessary as it determines the actual price of an investment. At the time of analysing
risky assets the cash flow of an investments can be discounted to their present value. By
extending this model, the fair value is calculated and compared with the actual market price.
Besides this, the cited model shows that the equity capital's cost can be evaluated with the help of
beta. In order to select the appropriate portfolio asset pricing model is being adapted by the
organization. Although, this model is used to access the risk and risk free capital asset pricing
where the outcomes of both the methods are different. In case of risk and capital asset pricing, it
is crucial to have good understanding of risk associated with an investment. However, a single
security consist the risk related with the depreciation which results in the investment loss to the
investor (Anghel and Paschia, 2013).
4
⊘ This is a preview!⊘
Do you want full access?
Subscribe today to unlock all pages.
Trusted by 1+ million students worldwide
In context to above, the risk free rate is the expected rate of an investment which is
assumed to carry zero involvement of risk. It is seen that the stated risk is adopted in short term
which can affect the entire monetary system. In CAPM model, the beta value of the financial
asset helps in measuring the associated systematic risk to the concerned asset. If the value of beta
is 1 then the associated risk with share is same as of the capital market. There are certain
advantages and disadvantages associated with the stated model. The major advantage of this
method is that it assumes the investor has diverse portfolio as the market. It only considers
systematic risk and ignores unsystematic risk of an asset. On contrary to this, the drawback of the
model is that it is used for short term securities for the government. Additionally, the issue arises
when the market is negative whi9ch leads to affect the overall return (Brown and Walter, 2013).
Capital market line model (CML)
In relation to capital market line, the portfolio of market includes mixtures of assets
associated with risk and risk free. However, the market value of the asset can be analysed with
the help of capital market line which is derived by CAPM model. It helps in sporting the return
expected form different kinds of risk. It can also be said that, CPM is a line which moves from
the point associated risk free asset to the executable field. However, at the time of building
portfolio, it is necessary to analyse both the risks i.e. systematic and unsystematic risk. Whereas,
systematic risk is the one which has major relation with the market. This kind of risk cannot be
distributed or diversified. On contrary to this, unsystematic risk is related with the stock which
can be diversified at the time of building portfolio. The stated tangible line depicts the premium
risk that an individual can earn for taking extra risk. This line has major relation with CAPM
model, as it is used in this model represents the rate of return of the effectual portfolios (Dayala,
2012).
Similarities and differences between the two models
The major similarity between the models are that both the models focuses on the
investment evaluation. Additionally, the major focus of the two models are on analysing the high
rate of return of a risky asset. Besides this, the CAPM and CML model considers both the risk
and return of the assets. At the time of building portfolio, it is necessary to consider both risk and
return of an asset. This helps the investor to identify the major association of risk and return of
an asset. However, the two methods are useful for the evaluation of risk effectively.
5
Paraphrase This Document
Need a fresh take? Get an instant paraphrase of this document with our AI Paraphraser
In context to above, there are certain differences carried by the two stated models. The
CML focuses on the rate of return to an asset including the risky and risk free for the portfolio
development. On another hand, SML is a graphical representation of the market risk of a
particular period. It is seen that, both the models used in identifying the factors used to measure
the risk. But the CML measures the associated risk of asset with the help of standard deviation
(Dayala, 2012). But in case SML, the risk is measured with the consideration of beta. In addition
to this, the CML line defines the portfolio consisting of expected return and security market line
graphically shows the both the efficient and non-efficient portfolios. At the time of calculating
the expected return the tangible line shows on the Y-axis of the graph. Whereas, SML explains
the beta over the X-axis. In case of CML, the market portfolio and assets contains zero risk are
explained by CML line. On contrary to this, the security factors determined by the SML line.
Among the two, CML line majorly considered at the time of risk measurement. This allows the
investor to make appropriate risk decisions (Sekhar and Gudimetla, 2013).
CONCLUSION
From the above report of managing financials it can be articulated that the above
mentioned three tools such as capital budgeting, sensitivity analysis and scenario analysis are
very helpful for making effective business decisions. It can be said that sensitivity and capital
budgeting both are related to each other where it shows probability and future value of potential
investment respectively. Apart from this scenario as well as financial tools both are related in
order to make better decisions for investment making. Further, it can be concluded that capital
market line and capital asset pricing model both have some similarities and differences. Both the
models are helpful in terms of assessing value of the portfolio where various investment avenues
are available. Apart from this the CAPM helps to assessing overall portfolio value while CML is
shows value of a particular security or investment avenue from more than two investment areas.
6
REFERENCES
Books and Journals
Anghel, M. G. and Paschia, L., 2013. Using the CAPM Model to Estimate the Profitability of a
Financial Instrument Portfolio. Annales Universitatis Apulensis: Series
Oeconomica.15(2). p.541.
Brown, P. and Walter, T., 2013. The CAPM: theoretical validity, empirical intractability and
practical applications.Abacus. 49(S1). pp.44-50.
Coffie, W. and Chukwulobelu, O., 2012. The application of capital asset pricing model (CAPM)
to individual securities on Ghana stock exchange. In Finance and Development in
Africa (pp. 121-147). Emerald Group Publishing Limited.
Dayala, R., 2012. The Capital Asset Pricing Model: A Fundamental Critique. Business Valuation
Review. 31(1). pp. 23-34.
Hsieh, H. H. and Hodnett, K., 2012. Cross-sector style analysis of global equities based on the
Fama and French three-factor model. The International Business & Economics
Research Journal (Online) .11(2). pp. 161.
Izhakian, Y., 2012. Capital asset pricing under ambiguity.
Marshall, C. M., 2015. Isolating the systematic and unsystematic components of a single stock’s
(or portfolio’s) standard deviation. Applied Economics. 47(1). pp.1-11.
Sekhar, S. and Gudimetla, V., 2013. Theorems and Theories of Financial Innovation: Models
and Mechanism Perspective.
Wagdi, O., 2014. Relationship Between Risk and Common Stock Return in CML and CAPM.
Browser Download This Paper.
Online
Capital Asset Pricing Model-CAPM, 2017. [Online] Available through:
<http://www.investopedia.com/terms/c/capm.asp>. [Accessed on: 21st January, 2017].
7
⊘ This is a preview!⊘
Do you want full access?
Subscribe today to unlock all pages.
Trusted by 1+ million students worldwide

Capital Budgeting Techniques: Certainty and Risk, 2016. [Pdf]. Available through:
<http://wps.aw.com/wps/media/objects/222/227412/ebook/ch09/chapter09.pdf> [Accessed
on 21st January 2017].
8
<http://wps.aw.com/wps/media/objects/222/227412/ebook/ch09/chapter09.pdf> [Accessed
on 21st January 2017].
8
1 out of 10
Related Documents


Your All-in-One AI-Powered Toolkit for Academic Success.
+13062052269
info@desklib.com
Available 24*7 on WhatsApp / Email
![[object Object]](/_next/static/media/star-bottom.7253800d.svg)
Unlock your academic potential
Copyright © 2020–2026 A2Z Services. All Rights Reserved. Developed and managed by ZUCOL.