Financial Analysis Report: Finance for Business, University Report

Verified

Added on  2020/05/16

|16
|2223
|31
Report
AI Summary
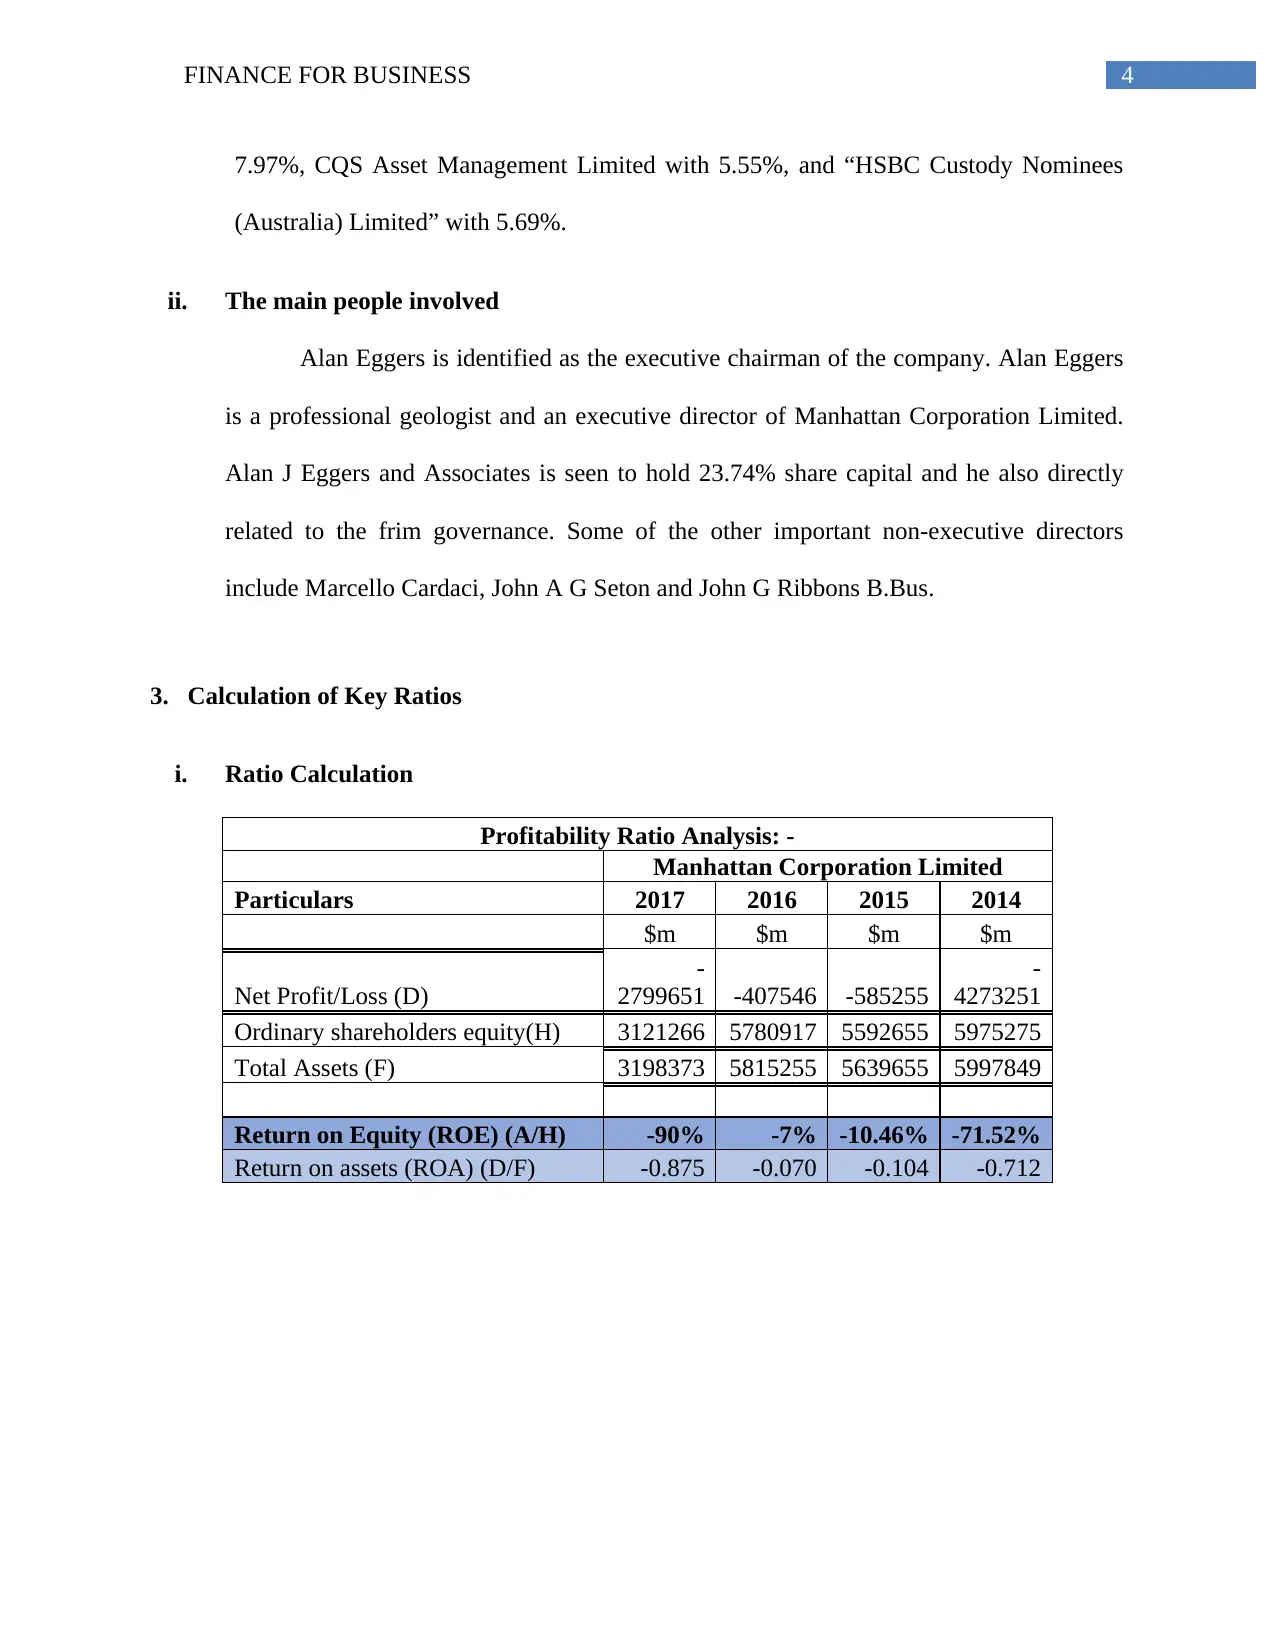
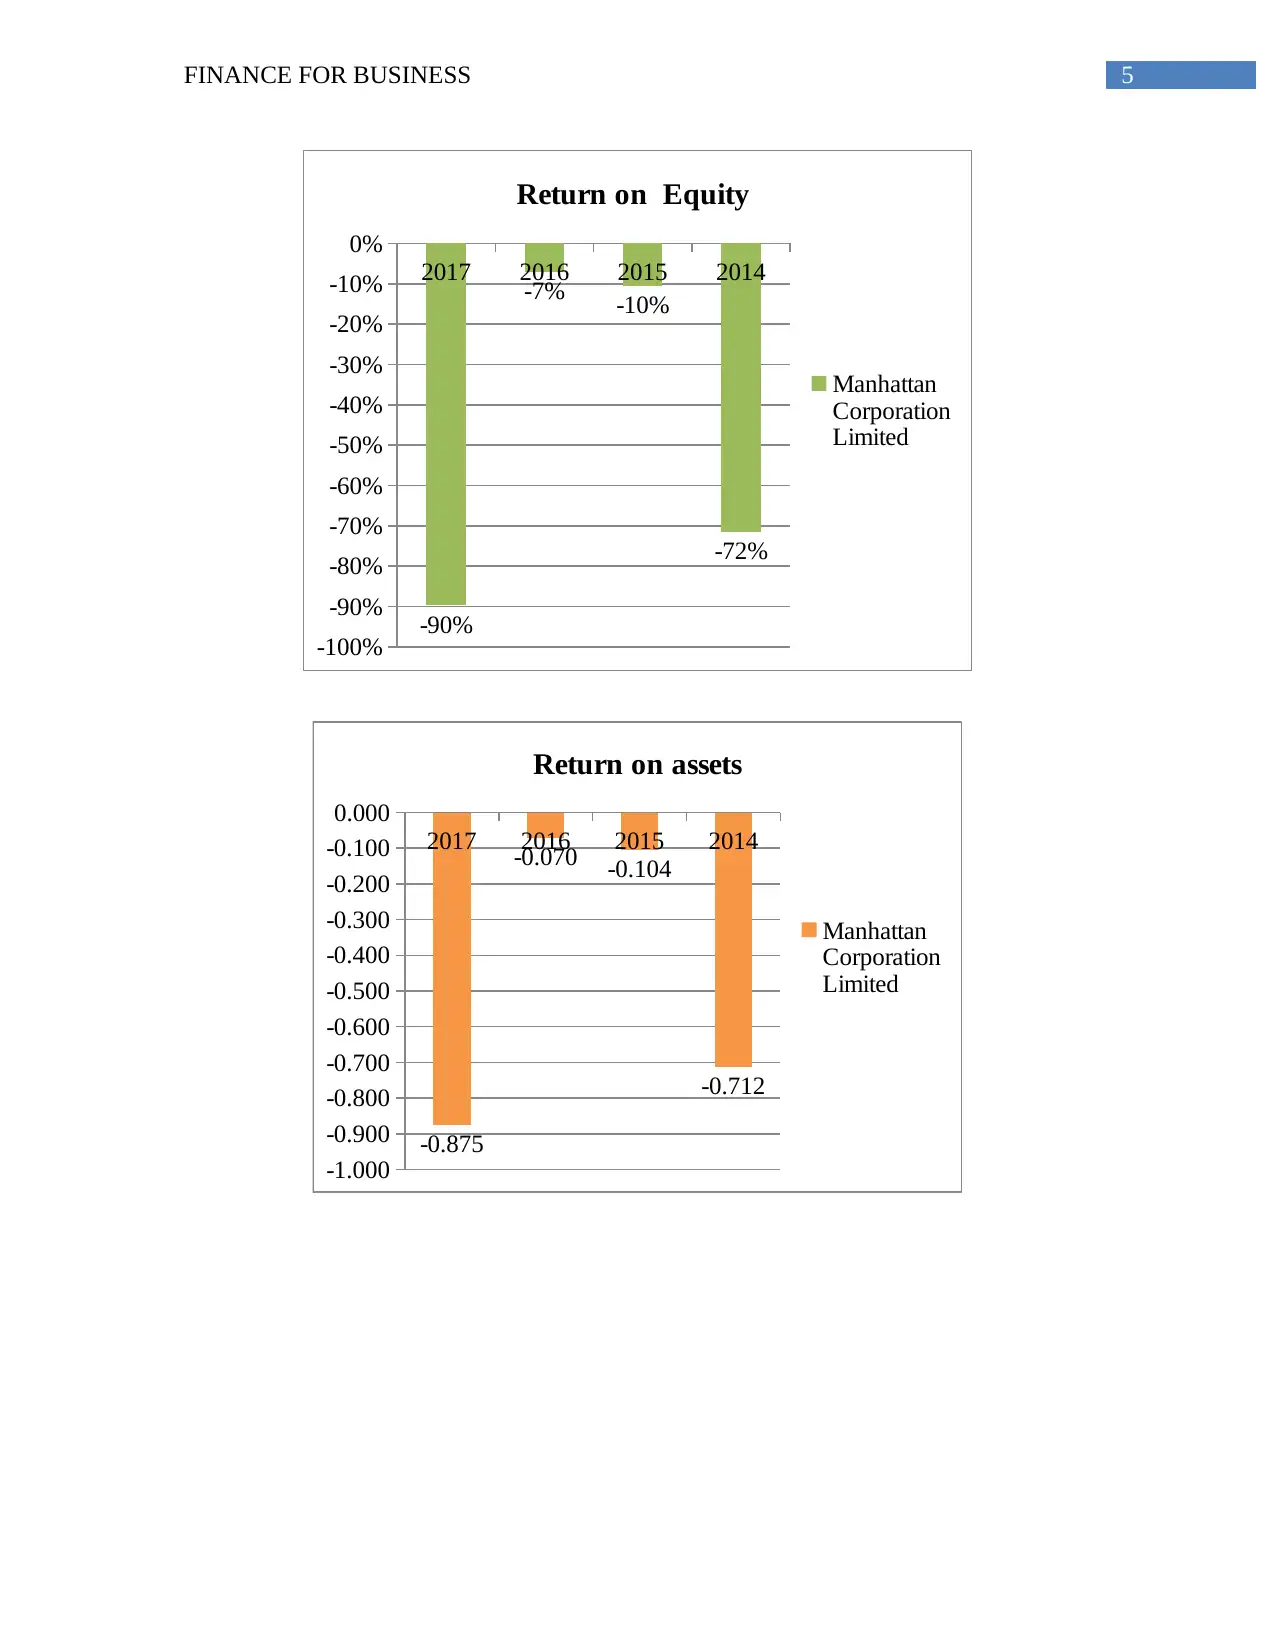
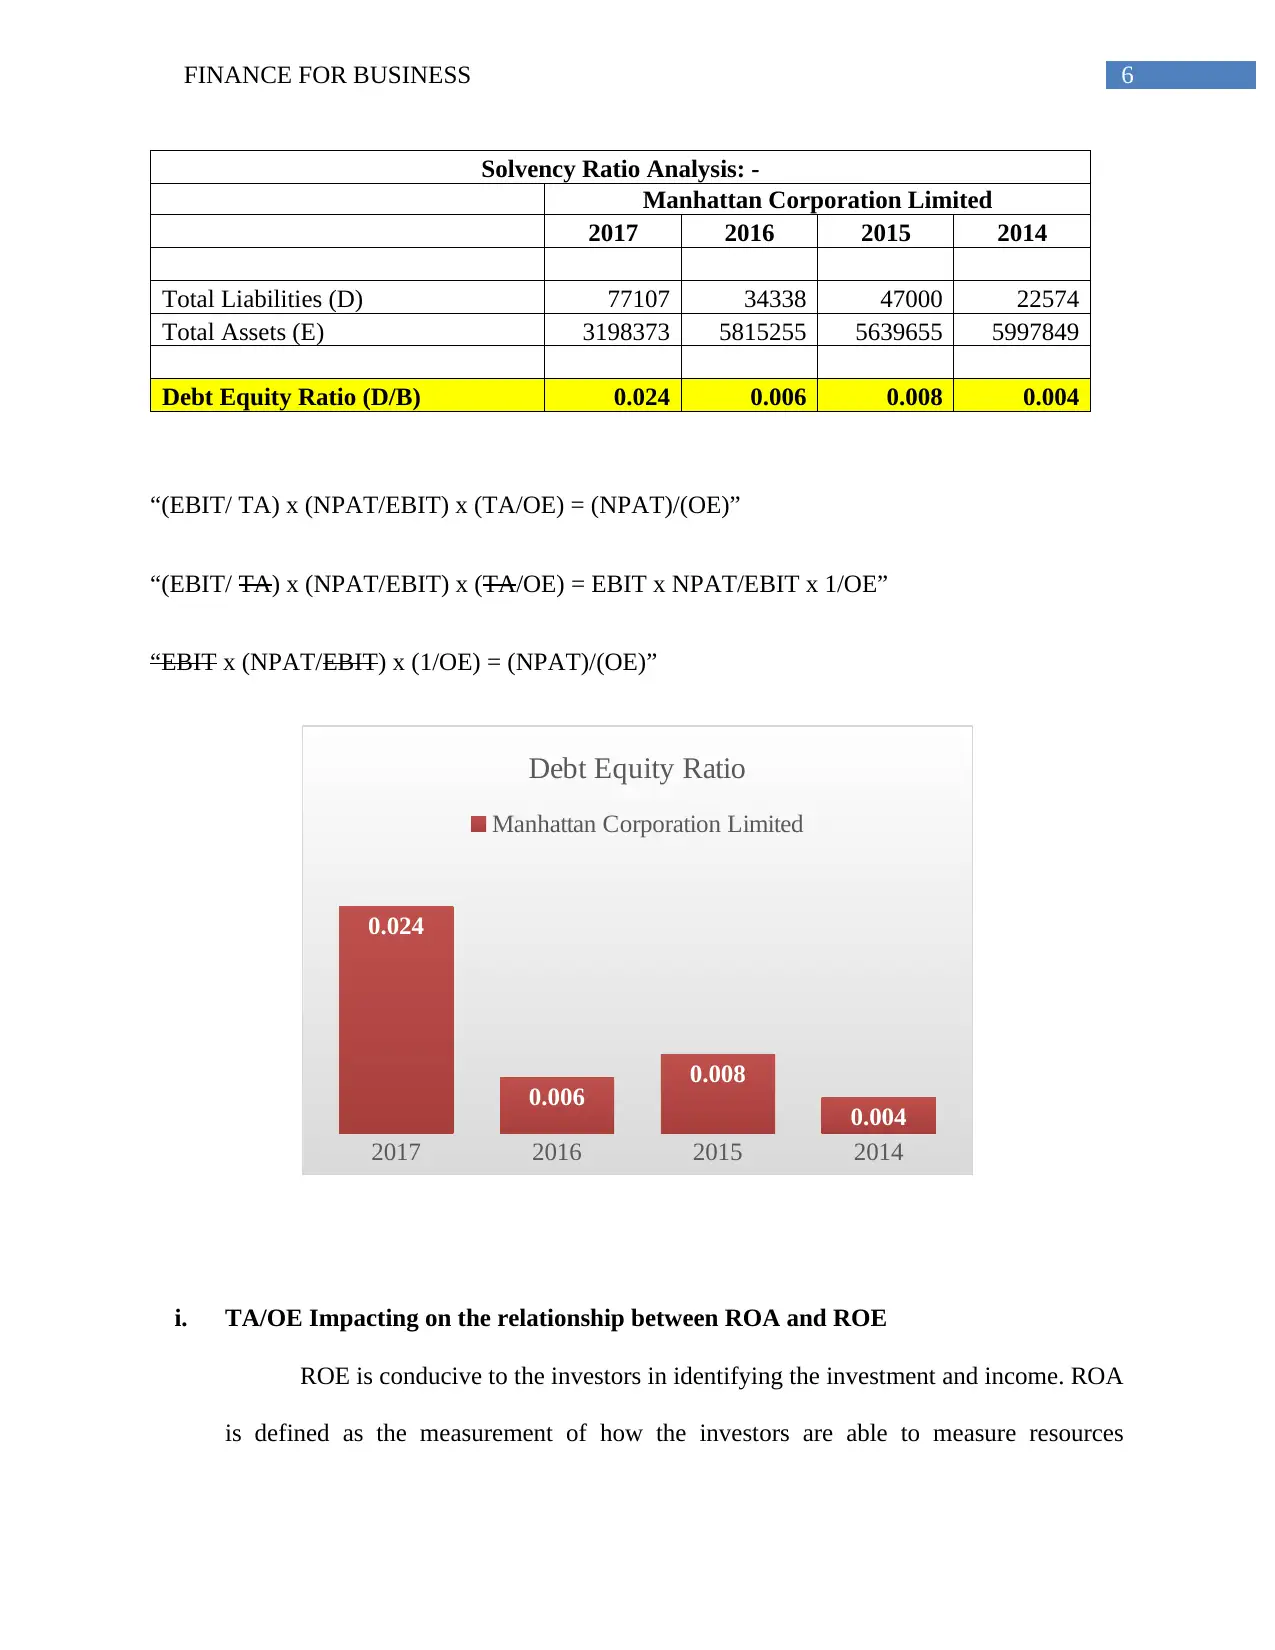
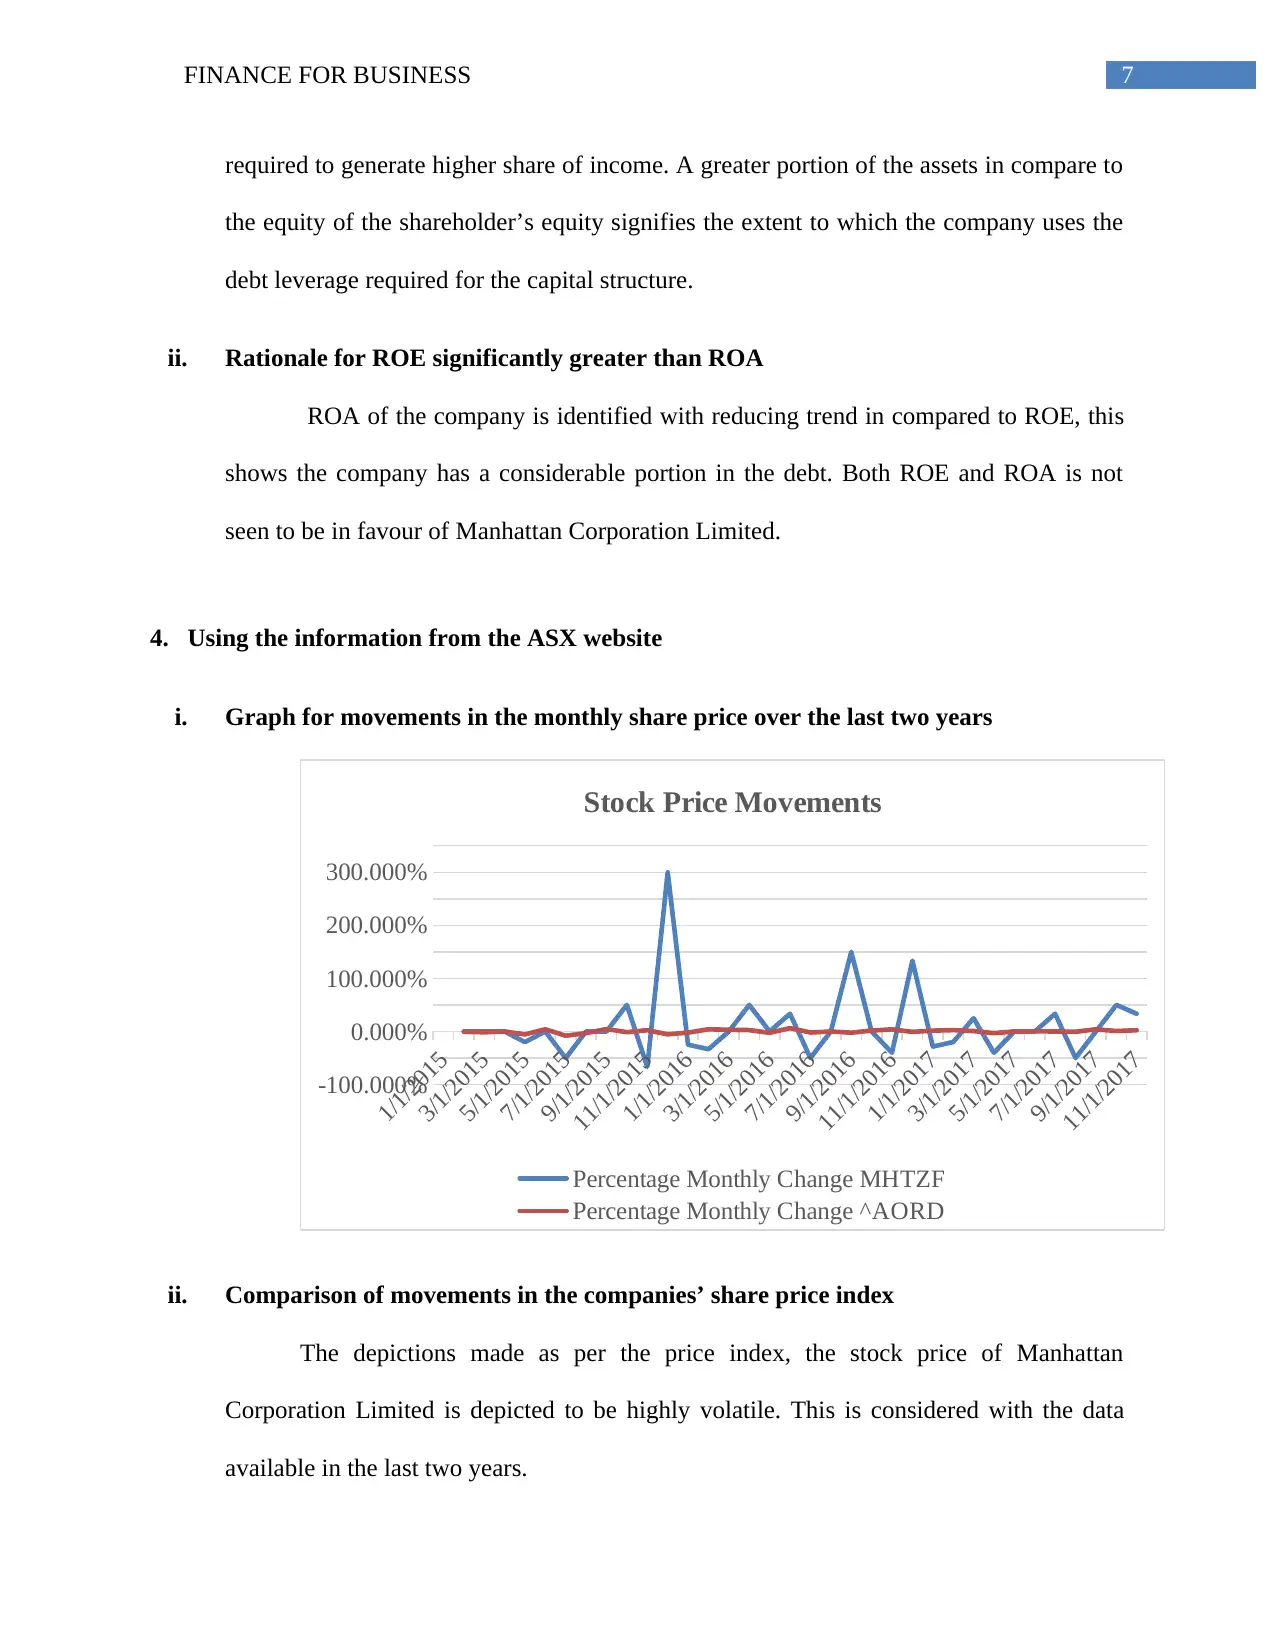
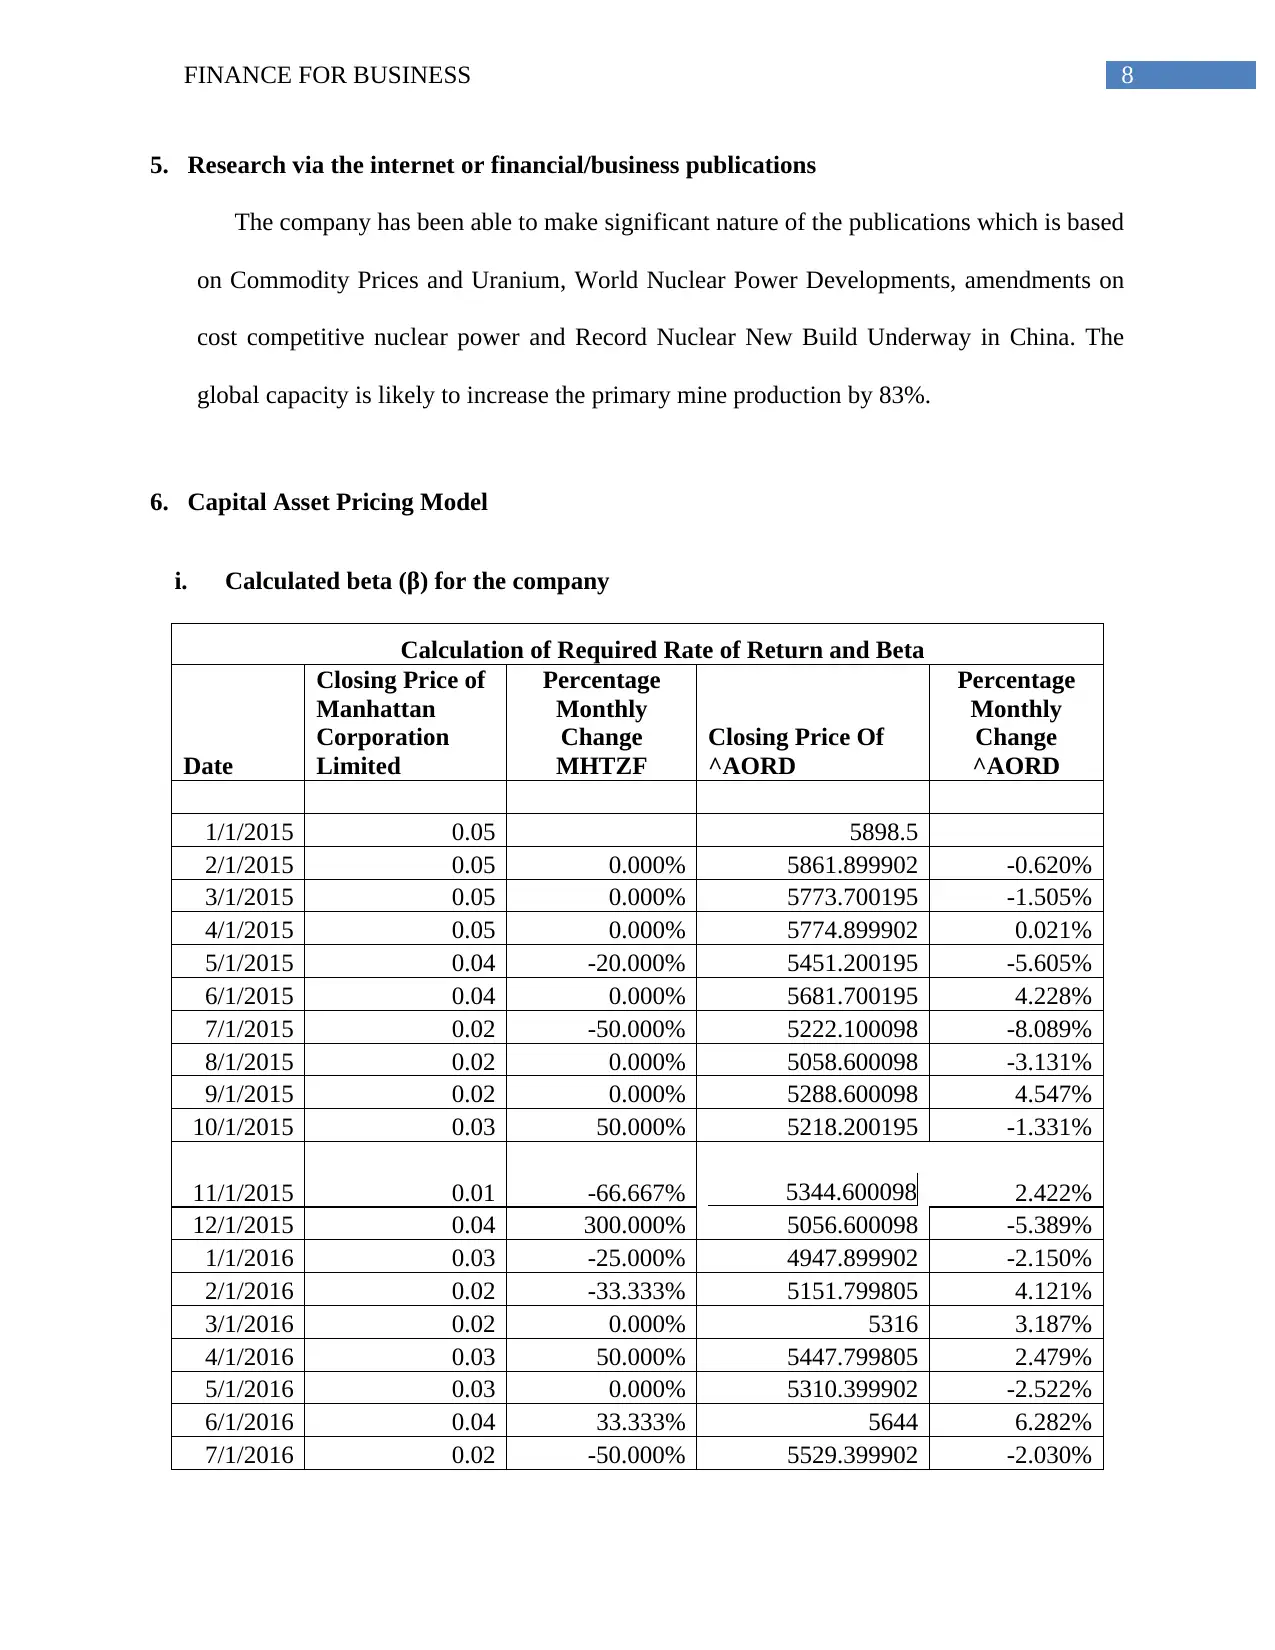
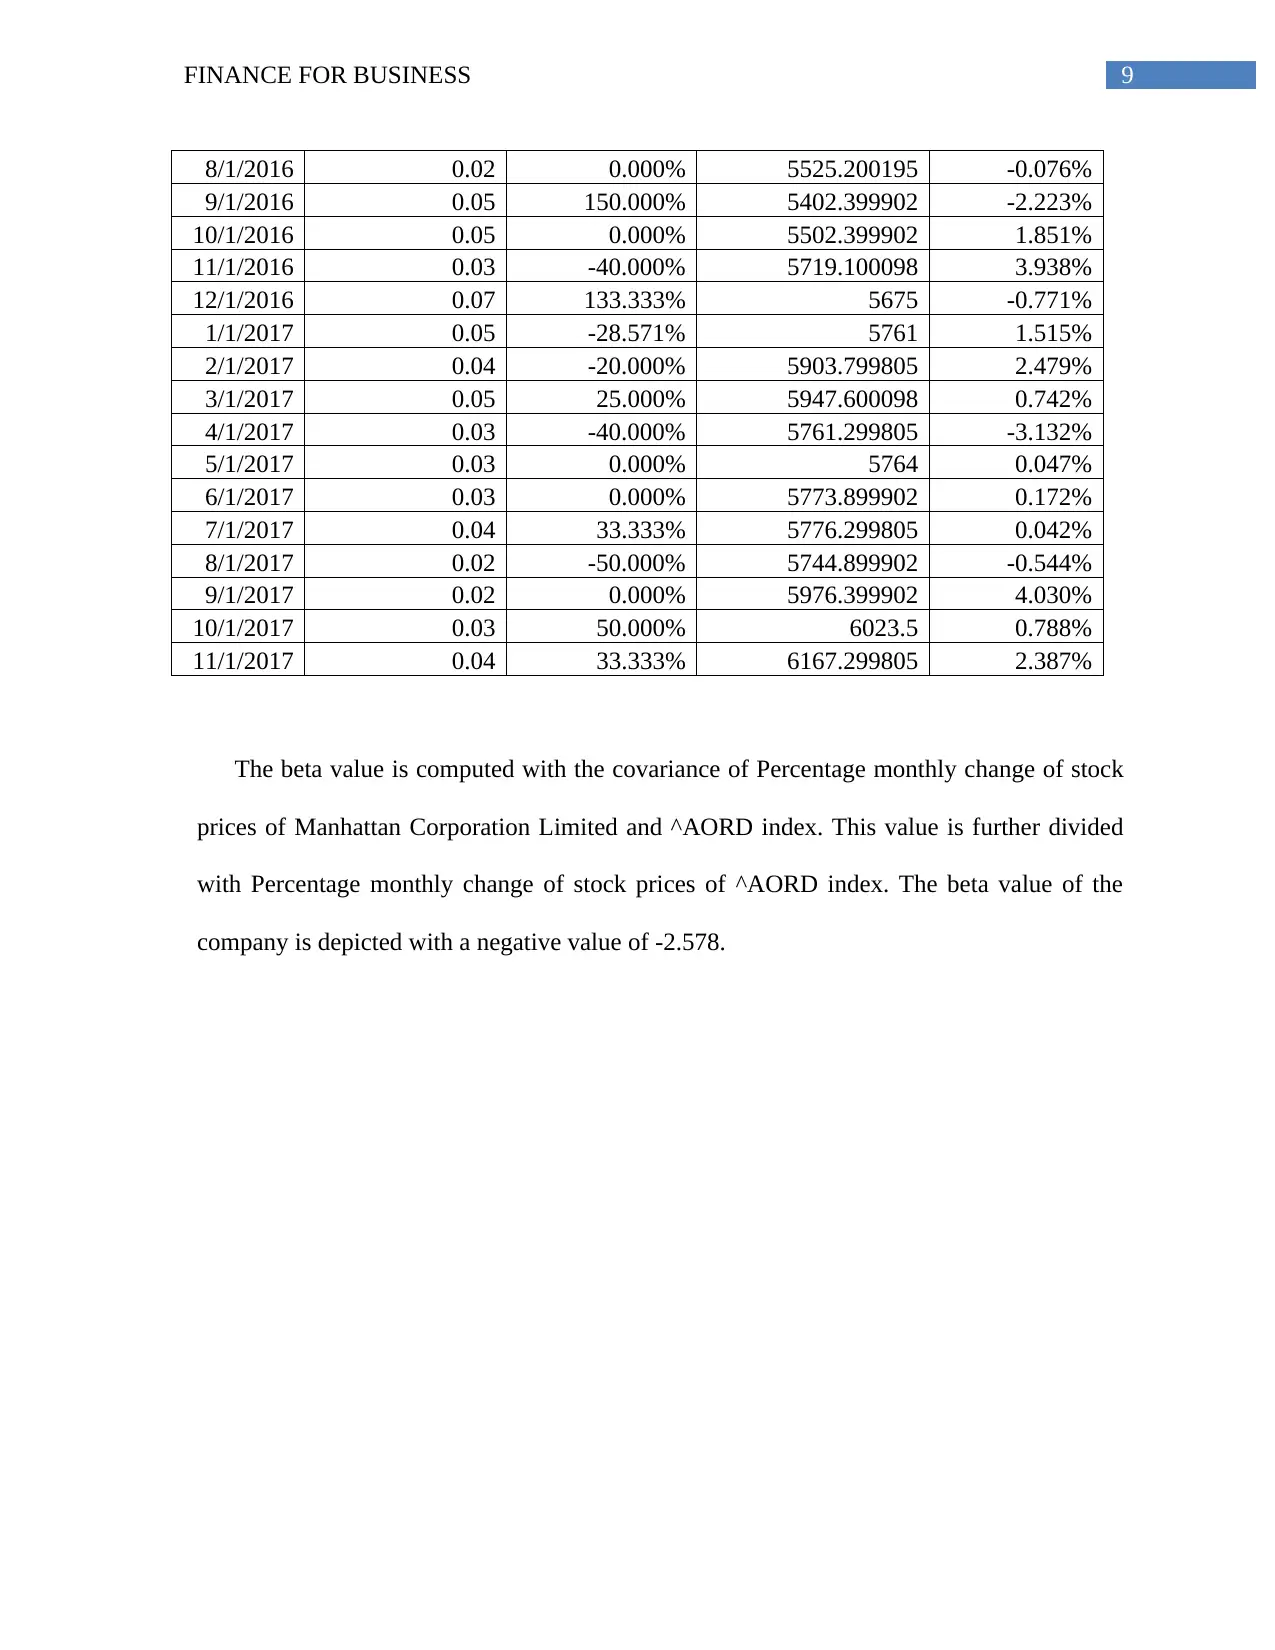
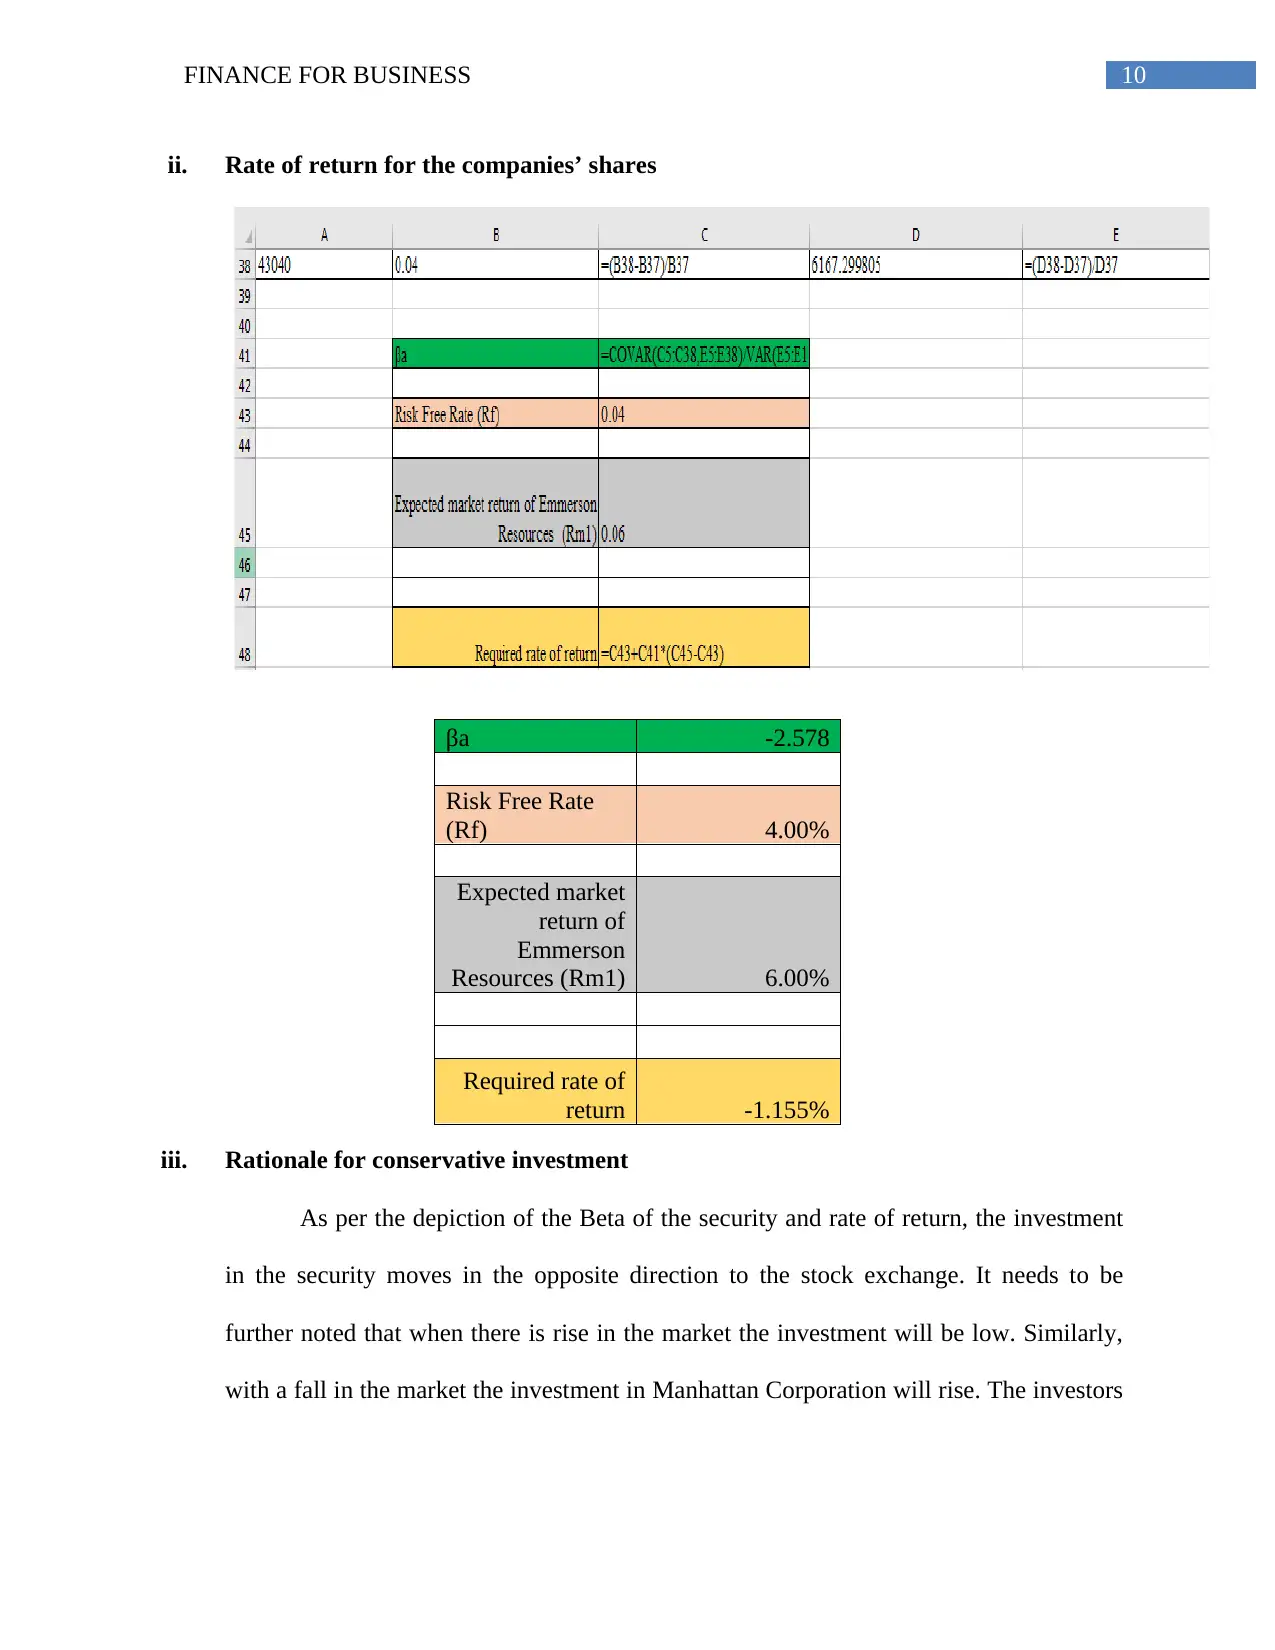
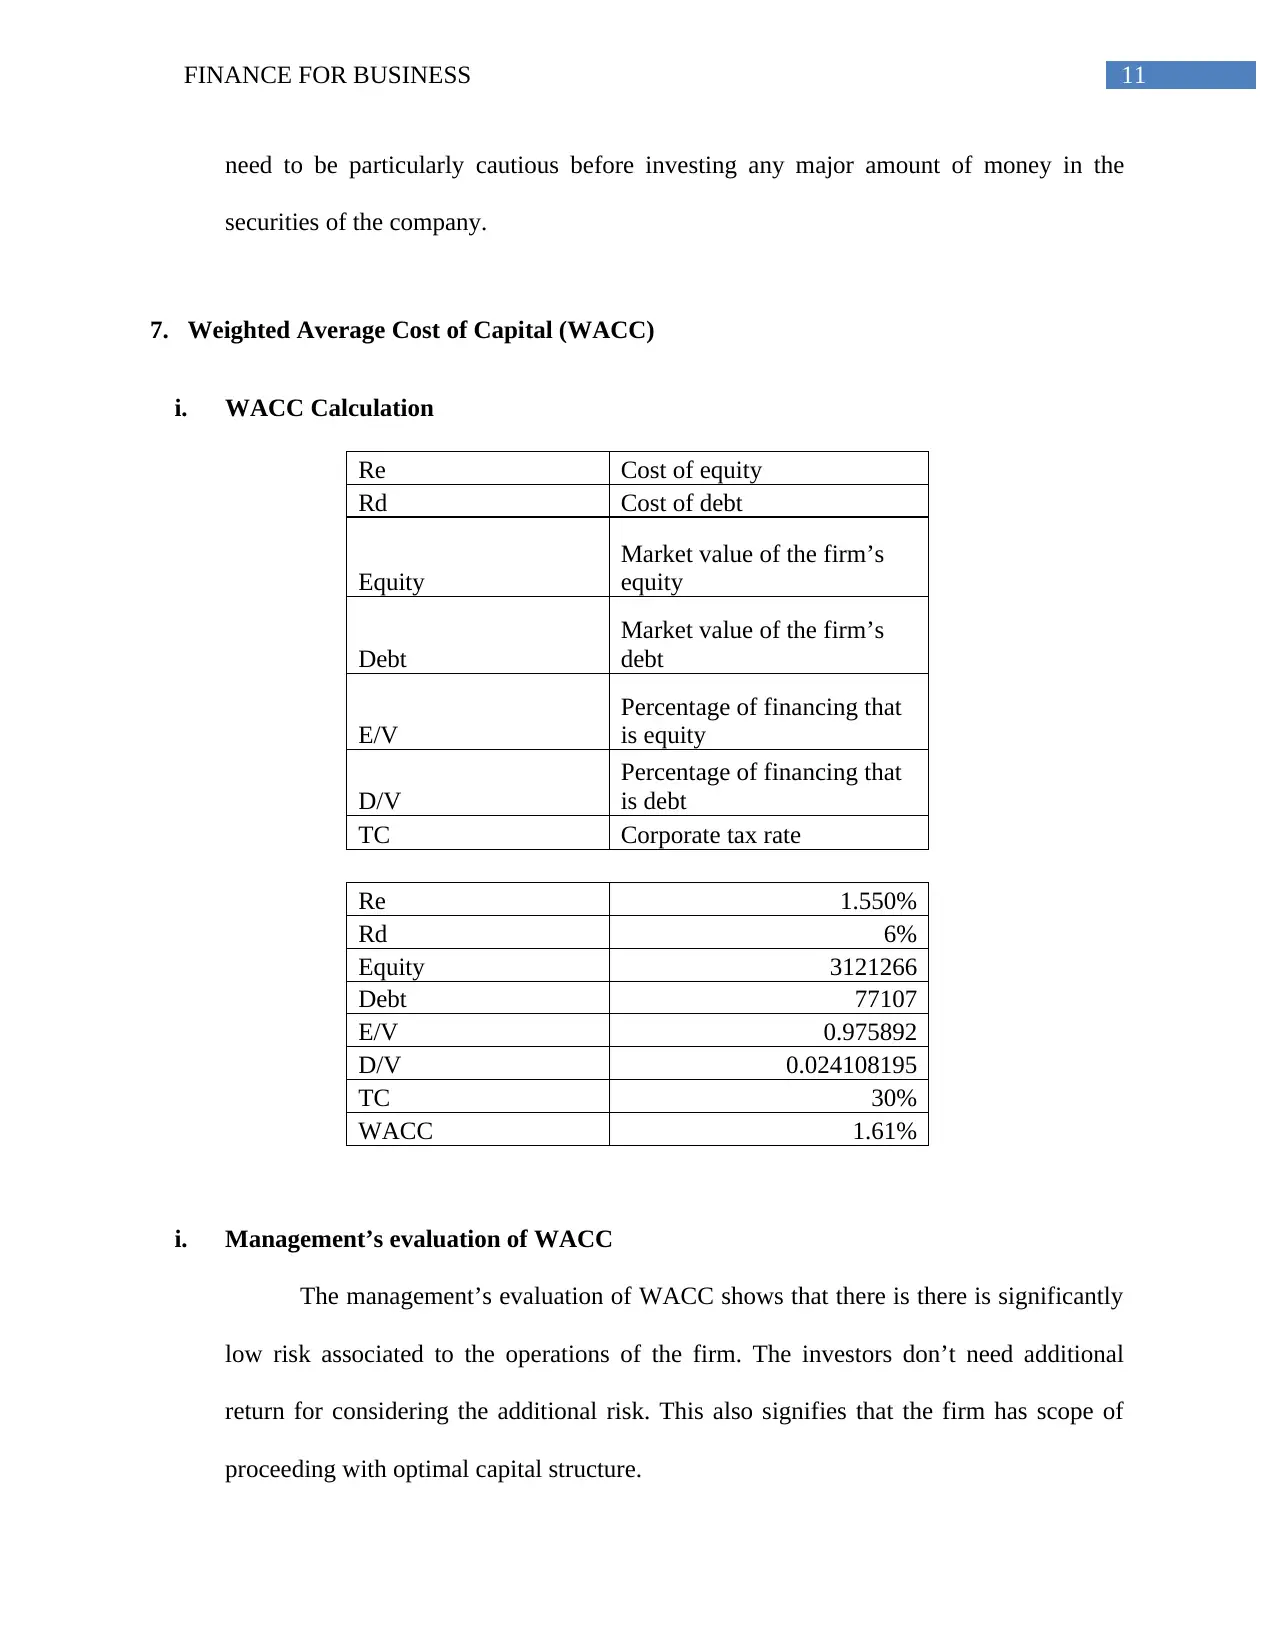
This finance report provides a comprehensive analysis of Manhattan Corporation Limited, examining its financial performance and investment potential. The report begins with a brief company description and an overview of its ownership and governance structure, including substantial shareholders and key personnel. It then delves into the calculation of key financial ratios, such as ROE and ROA, and analyzes their implications. The report further explores the company's share price movements using data from the ASX website, and incorporates findings from internet and financial publications. A significant portion of the report is dedicated to the Capital Asset Pricing Model (CAPM), calculating beta and the required rate of return, followed by a rationale for conservative investment. The Weighted Average Cost of Capital (WACC) is also calculated and evaluated. The report concludes with a discussion on dividend policy and a letter of recommendation to a client. Overall, the report provides a detailed financial assessment of Manhattan Corporation, highlighting its strengths, weaknesses, and investment considerations.
Document Page
Running head: FINANCE FOR BUSINESS
Finance for Business
Name of Student:
Name of University:
Author’s Note:
tabler-icon-diamond-filled.svg

Paraphrase This Document

Need a fresh take? Get an instant paraphrase of this document with our AI Paraphraser
Document Page
1FINANCE FOR BUSINESS
Table of Contents
Introduction......................................................................................................................................3
1. Brief description of the company............................................................................................3
2. Ownership-governance structure.............................................................................................3
i. Substantial shareholders.......................................................................................................3
ii. The main people involved....................................................................................................4
3. Calculation of Key Ratios........................................................................................................4
i. Ratio Calculation..................................................................................................................4
i. TA/OE Impacting on the relationship between ROA and ROE...........................................6
ii. Rationale for ROE significantly greater than ROA..............................................................7
4. Using the information from the ASX website.........................................................................7
i. Graph for movements in the monthly share price over the last two years...........................7
ii. Comparison of movements in the companies’ share price index.........................................7
5. Research via the internet or financial/business publications...................................................8
6. Capital Asset Pricing Model....................................................................................................8
i. Calculated beta (β) for the company.....................................................................................8
ii. Rate of return for the companies’ shares............................................................................10
iii. Rationale for conservative investment............................................................................10
7. Weighted Average Cost of Capital (WACC)........................................................................11
i. WACC Calculation.............................................................................................................11
Document Page
2FINANCE FOR BUSINESS
i. Management’s evaluation of WACC..................................................................................11
i. Amendments on gearing ratio.............................................................................................12
8. Dividend Policy.....................................................................................................................12
9. Letter of recommendation to the client..................................................................................12
Conclusion.....................................................................................................................................13
Document Page
3FINANCE FOR BUSINESS
Introduction
The learnings of the study have considered the essential activities of the operating
market. The application of the financial tools in the report are evident with the evaluation of key
ratio taken from ASX website. The study further discusses on the evaluation of WACC and rate
of return as per the stock price. The latter part of the report has discussed on the amendments on
gearing ratio and maintenance of a preferred optimal capital structure.
1. Brief description of the company
Manhattan Corporation Limited is identified as the flagship Ponton uranium project which is
approximately located 200 Km northeast of Kalgoorie on the edge of the Great Victoria Desert in
WA. The company is seen to be having 100% control for the exploration tenement underlaid by
the tertiary palaeochannels within the Gunbarrel Basin. These are considered as palaeochannels,
which hosts several uranium deposits and drilled uranium. The Mineral resource estimate of the
company is based on the “Manhattan’s air core” and “sonic drilling” of over 788 holes for
55,553 metres of drilling along the palaeochannels immediately to the north of QVSNR from
2009 to 2016 (Manhattancorp.com.au. 2018).
2. Ownership-governance structure
i. Substantial shareholders
The highest substantial security holder of the company is understood with Alan J
Eggers and Associates with 23.74%. “Minvest Securities (New Zealand) Limited” is
identified as one of the substantial shareholders of the company with 17.05%. Some of
the other substantial shareholders has been depicted with “Nicholas P S Olissoff” with
tabler-icon-diamond-filled.svg

Paraphrase This Document

Need a fresh take? Get an instant paraphrase of this document with our AI Paraphraser
Document Page
4FINANCE FOR BUSINESS
7.97%, CQS Asset Management Limited with 5.55%, and “HSBC Custody Nominees
(Australia) Limited” with 5.69%.
ii. The main people involved
Alan Eggers is identified as the executive chairman of the company. Alan Eggers
is a professional geologist and an executive director of Manhattan Corporation Limited.
Alan J Eggers and Associates is seen to hold 23.74% share capital and he also directly
related to the frim governance. Some of the other important non-executive directors
include Marcello Cardaci, John A G Seton and John G Ribbons B.Bus.
3. Calculation of Key Ratios
i. Ratio Calculation
Profitability Ratio Analysis: -
Manhattan Corporation Limited
Particulars 2017 2016 2015 2014
$m $m $m $m
Net Profit/Loss (D)
-
2799651 -407546 -585255
-
4273251
Ordinary shareholders equity(H) 3121266 5780917 5592655 5975275
Total Assets (F) 3198373 5815255 5639655 5997849
Return on Equity (ROE) (A/H) -90% -7% -10.46% -71.52%
Return on assets (ROA) (D/F) -0.875 -0.070 -0.104 -0.712
Document Page
5FINANCE FOR BUSINESS
2017 2016 2015 2014
-100%
-90%
-80%
-70%
-60%
-50%
-40%
-30%
-20%
-10%
0%
-90%
-7% -10%
-72%
Return on Equity
Manhattan
Corporation
Limited
2017 2016 2015 2014
-1.000
-0.900
-0.800
-0.700
-0.600
-0.500
-0.400
-0.300
-0.200
-0.100
0.000
-0.875
-0.070 -0.104
-0.712
Return on assets
Manhattan
Corporation
Limited
Document Page
6FINANCE FOR BUSINESS
Solvency Ratio Analysis: -
Manhattan Corporation Limited
2017 2016 2015 2014
Total Liabilities (D) 77107 34338 47000 22574
Total Assets (E) 3198373 5815255 5639655 5997849
Debt Equity Ratio (D/B) 0.024 0.006 0.008 0.004
“(EBIT/ TA) x (NPAT/EBIT) x (TA/OE) = (NPAT)/(OE)”
“(EBIT/ TA) x (NPAT/EBIT) x (TA/OE) = EBIT x NPAT/EBIT x 1/OE”
“EBIT x (NPAT/EBIT) x (1/OE) = (NPAT)/(OE)”
2017 2016 2015 2014
0.024
0.006 0.008
0.004
Debt Equity Ratio
Manhattan Corporation Limited
i. TA/OE Impacting on the relationship between ROA and ROE
ROE is conducive to the investors in identifying the investment and income. ROA
is defined as the measurement of how the investors are able to measure resources
tabler-icon-diamond-filled.svg

Paraphrase This Document

Need a fresh take? Get an instant paraphrase of this document with our AI Paraphraser
Document Page
7FINANCE FOR BUSINESS
required to generate higher share of income. A greater portion of the assets in compare to
the equity of the shareholder’s equity signifies the extent to which the company uses the
debt leverage required for the capital structure.
ii. Rationale for ROE significantly greater than ROA
ROA of the company is identified with reducing trend in compared to ROE, this
shows the company has a considerable portion in the debt. Both ROE and ROA is not
seen to be in favour of Manhattan Corporation Limited.
4. Using the information from the ASX website
i. Graph for movements in the monthly share price over the last two years
1/1/2015
3/1/2015
5/1/2015
7/1/2015
9/1/2015
11/1/2015
1/1/2016
3/1/2016
5/1/2016
7/1/2016
9/1/2016
11/1/2016
1/1/2017
3/1/2017
5/1/2017
7/1/2017
9/1/2017
11/1/2017
-100.000%
0.000%
100.000%
200.000%
300.000%
Stock Price Movements
Percentage Monthly Change MHTZF
Percentage Monthly Change ^AORD
ii. Comparison of movements in the companies’ share price index
The depictions made as per the price index, the stock price of Manhattan
Corporation Limited is depicted to be highly volatile. This is considered with the data
available in the last two years.
Document Page
8FINANCE FOR BUSINESS
5. Research via the internet or financial/business publications
The company has been able to make significant nature of the publications which is based
on Commodity Prices and Uranium, World Nuclear Power Developments, amendments on
cost competitive nuclear power and Record Nuclear New Build Underway in China. The
global capacity is likely to increase the primary mine production by 83%.
6. Capital Asset Pricing Model
i. Calculated beta (β) for the company
Calculation of Required Rate of Return and Beta
Date
Closing Price of
Manhattan
Corporation
Limited
Percentage
Monthly
Change
MHTZF
Closing Price Of
^AORD
Percentage
Monthly
Change
^AORD
1/1/2015 0.05 5898.5
2/1/2015 0.05 0.000% 5861.899902 -0.620%
3/1/2015 0.05 0.000% 5773.700195 -1.505%
4/1/2015 0.05 0.000% 5774.899902 0.021%
5/1/2015 0.04 -20.000% 5451.200195 -5.605%
6/1/2015 0.04 0.000% 5681.700195 4.228%
7/1/2015 0.02 -50.000% 5222.100098 -8.089%
8/1/2015 0.02 0.000% 5058.600098 -3.131%
9/1/2015 0.02 0.000% 5288.600098 4.547%
10/1/2015 0.03 50.000% 5218.200195 -1.331%
11/1/2015 0.01 -66.667% 5344.600098 2.422%
12/1/2015 0.04 300.000% 5056.600098 -5.389%
1/1/2016 0.03 -25.000% 4947.899902 -2.150%
2/1/2016 0.02 -33.333% 5151.799805 4.121%
3/1/2016 0.02 0.000% 5316 3.187%
4/1/2016 0.03 50.000% 5447.799805 2.479%
5/1/2016 0.03 0.000% 5310.399902 -2.522%
6/1/2016 0.04 33.333% 5644 6.282%
7/1/2016 0.02 -50.000% 5529.399902 -2.030%
Document Page
9FINANCE FOR BUSINESS
8/1/2016 0.02 0.000% 5525.200195 -0.076%
9/1/2016 0.05 150.000% 5402.399902 -2.223%
10/1/2016 0.05 0.000% 5502.399902 1.851%
11/1/2016 0.03 -40.000% 5719.100098 3.938%
12/1/2016 0.07 133.333% 5675 -0.771%
1/1/2017 0.05 -28.571% 5761 1.515%
2/1/2017 0.04 -20.000% 5903.799805 2.479%
3/1/2017 0.05 25.000% 5947.600098 0.742%
4/1/2017 0.03 -40.000% 5761.299805 -3.132%
5/1/2017 0.03 0.000% 5764 0.047%
6/1/2017 0.03 0.000% 5773.899902 0.172%
7/1/2017 0.04 33.333% 5776.299805 0.042%
8/1/2017 0.02 -50.000% 5744.899902 -0.544%
9/1/2017 0.02 0.000% 5976.399902 4.030%
10/1/2017 0.03 50.000% 6023.5 0.788%
11/1/2017 0.04 33.333% 6167.299805 2.387%
The beta value is computed with the covariance of Percentage monthly change of stock
prices of Manhattan Corporation Limited and ^AORD index. This value is further divided
with Percentage monthly change of stock prices of ^AORD index. The beta value of the
company is depicted with a negative value of -2.578.
tabler-icon-diamond-filled.svg

Paraphrase This Document

Need a fresh take? Get an instant paraphrase of this document with our AI Paraphraser
Document Page
10FINANCE FOR BUSINESS
ii. Rate of return for the companies’ shares
βa -2.578
Risk Free Rate
(Rf) 4.00%
Expected market
return of
Emmerson
Resources (Rm1) 6.00%
Required rate of
return -1.155%
iii. Rationale for conservative investment
As per the depiction of the Beta of the security and rate of return, the investment
in the security moves in the opposite direction to the stock exchange. It needs to be
further noted that when there is rise in the market the investment will be low. Similarly,
with a fall in the market the investment in Manhattan Corporation will rise. The investors
Document Page
11FINANCE FOR BUSINESS
need to be particularly cautious before investing any major amount of money in the
securities of the company.
7. Weighted Average Cost of Capital (WACC)
i. WACC Calculation
Re Cost of equity
Rd Cost of debt
Equity
Market value of the firm’s
equity
Debt
Market value of the firm’s
debt
E/V
Percentage of financing that
is equity
D/V
Percentage of financing that
is debt
TC Corporate tax rate
Re 1.550%
Rd 6%
Equity 3121266
Debt 77107
E/V 0.975892
D/V 0.024108195
TC 30%
WACC 1.61%
i. Management’s evaluation of WACC
The management’s evaluation of WACC shows that there is there is significantly
low risk associated to the operations of the firm. The investors don’t need additional
return for considering the additional risk. This also signifies that the firm has scope of
proceeding with optimal capital structure.
chevron_up_icon
1 out of 16
circle_padding
hide_on_mobile
zoom_out_icon
[object Object]