Financial Analysis of Portfolio Companies: 2015-2016 Performance

Verified

Added on  2020/04/13

|24
|3925
|29
Report
AI Summary
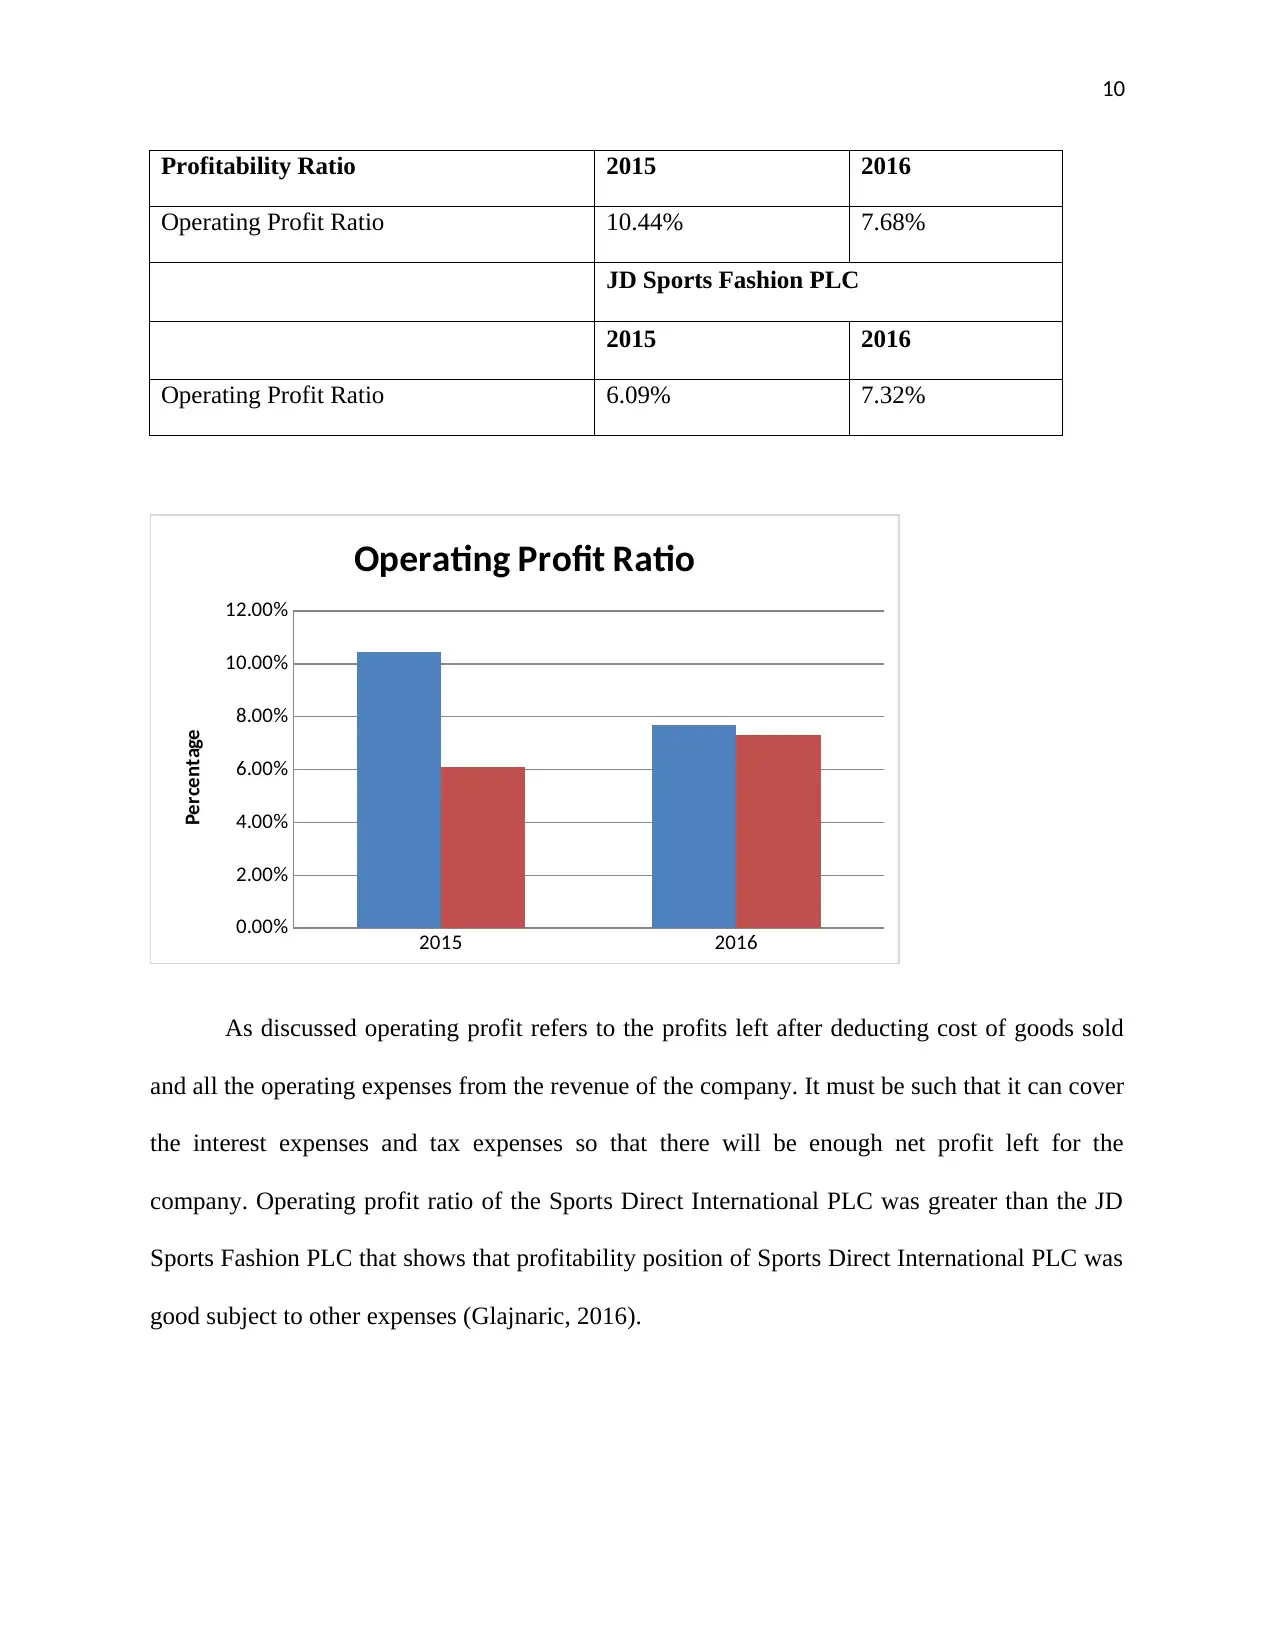
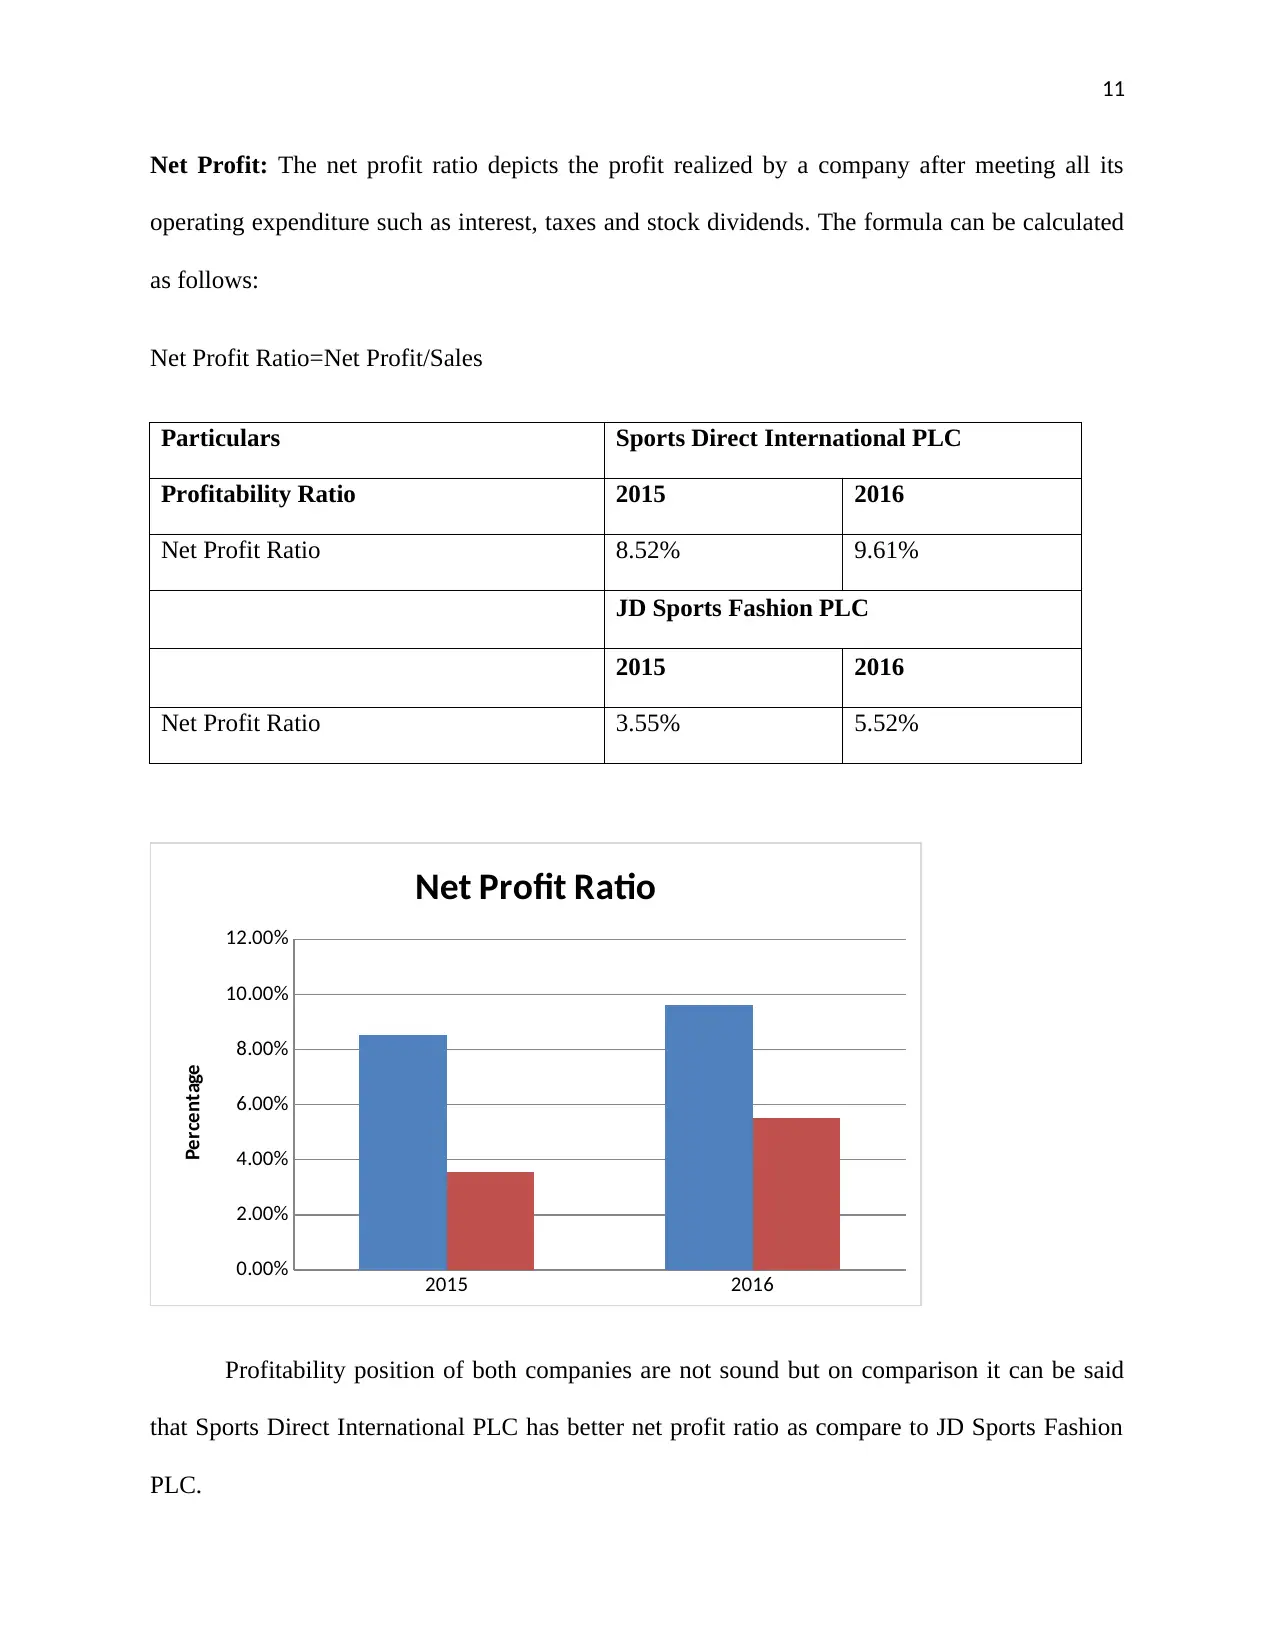
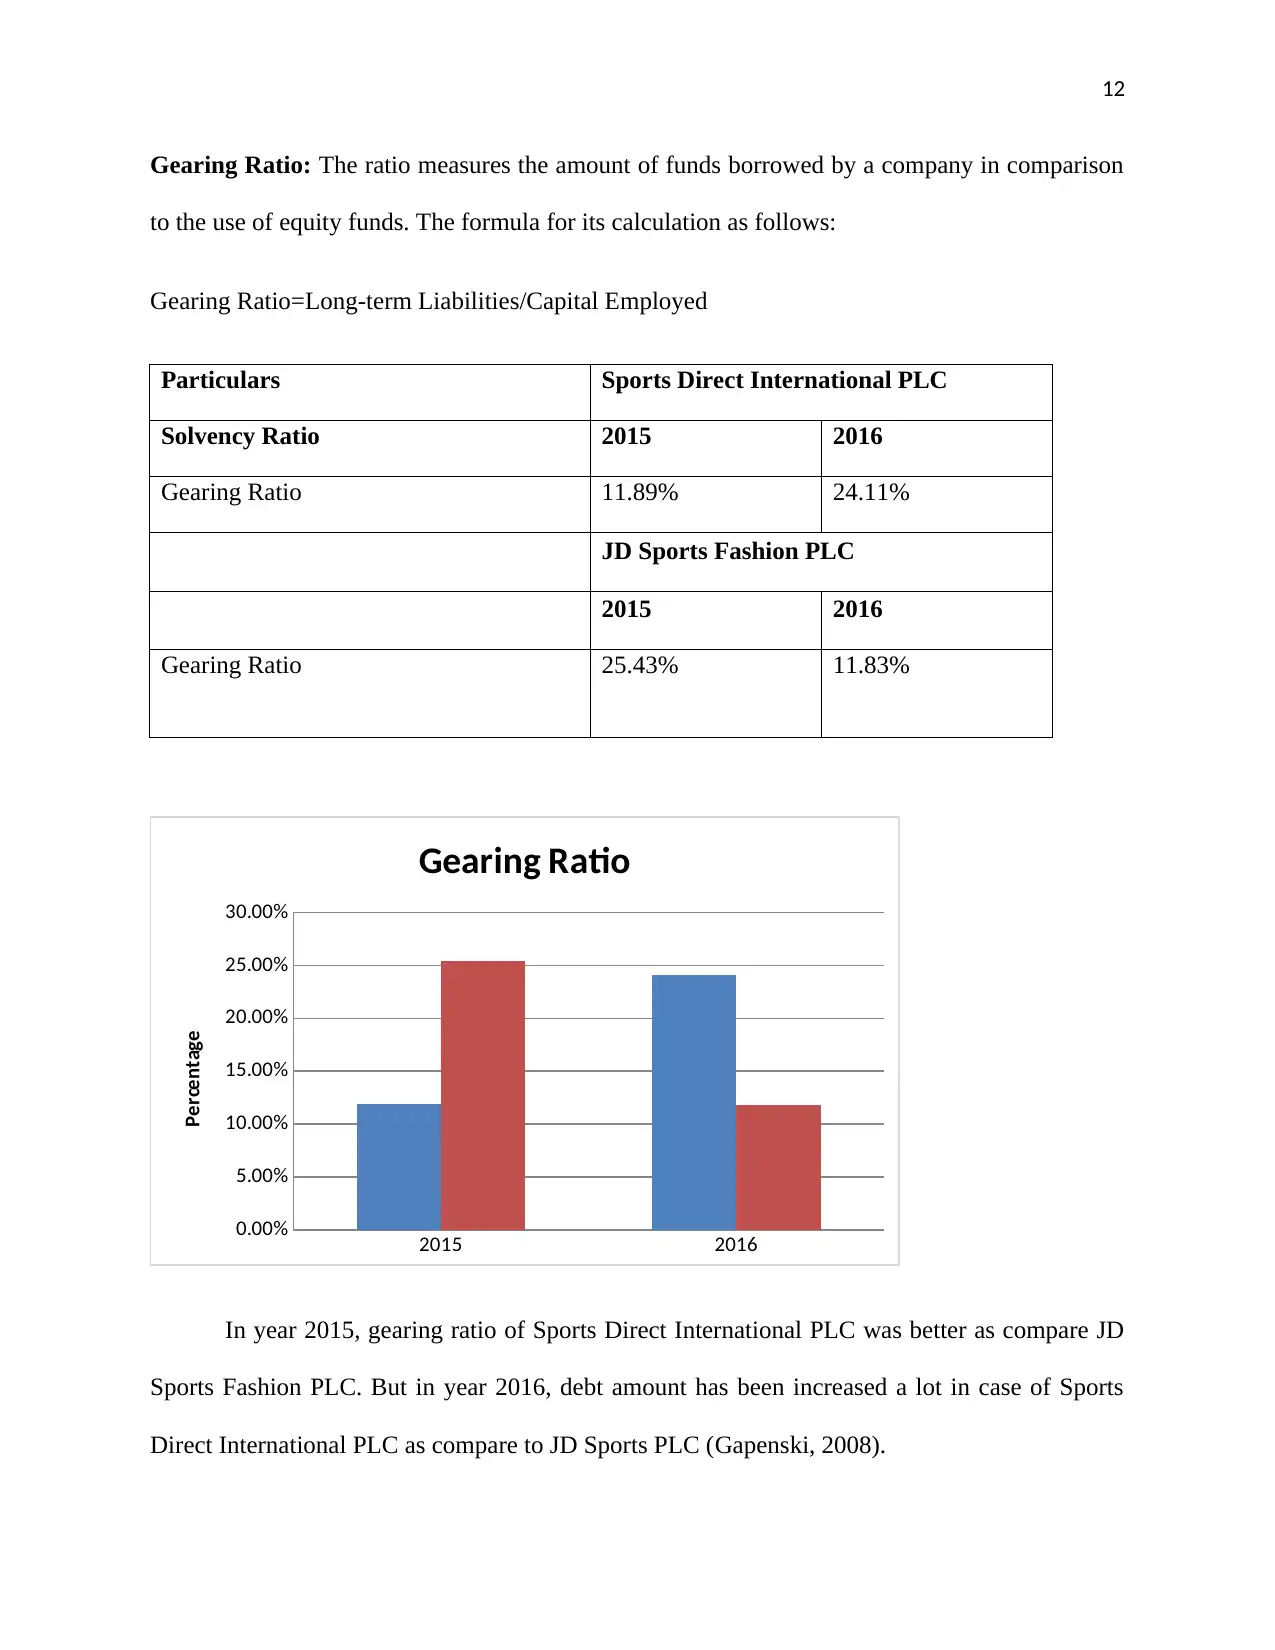
This report presents a comprehensive financial analysis of two companies, Sports Direct International PLC and JD Sports Fashion PLC, using financial ratios for the years 2015 and 2016. The analysis, conducted from the perspective of a financial manager, assesses liquidity, profitability, solvency, and market performance. The report calculates and interprets various financial ratios, including current ratio, quick ratio, gross profit margin, operating profit margin, net profit margin, gearing ratio, earnings per share, return on capital employed, inventory turnover ratio, and dividend payout ratio. Additionally, the report includes an investment appraisal of two capital investment projects, using techniques like NPV, ARR, and payback period. The findings aim to aid investment decisions, offering recommendations and acknowledging limitations of the financial ratio analysis.
Document Page
1
Financial Analysis of the Portfolio
tabler-icon-diamond-filled.svg

Paraphrase This Document

Need a fresh take? Get an instant paraphrase of this document with our AI Paraphraser
Document Page
2
Contents
Introduction......................................................................................................................................3
Portfolio 1........................................................................................................................................3
Calculation of Financial Ratio of both the companies (2015 and 2016) and Analyzing the
Performance, Financial Position and Investment Potential of both Companies..............................4
Different Ratios and their graphs.....................................................................................................5
Further Research on the performance of both companies.............................................................13
Recommendations..........................................................................................................................14
Limitations of Relying on Financial Ratios to Interpret Firm Performance..................................14
Portfolio 2: Capital investment appraisal......................................................................................15
Part A: Payback, Account rate of return and NPV........................................................................15
Payback Period..............................................................................................................................15
Accounting Rate of Return............................................................................................................16
Net Present Value..........................................................................................................................17
Part B: Limitations of using investment appraisal techniques to aid long-term decision-making 18
Conclusion.....................................................................................................................................19
References......................................................................................................................................20
Document Page
3
Introduction
The present report is developed for providing an understanding of the accounting and
finance techniques that can be used by the investors for analyzing the financial performance of a
company. In this context, the report aims to construct two portfolios for the investors to aid their
decision-making processes by analyzing the financial performance of the companies. The first
portfolio is developed to present an analysis of the financial information of the two companies,
that are, Sports Direct International PLC and JD Sports Fashion PLC on the perspective of the
financial manger of Madhouse Retail Ltd. The analysis is aimed to assist the financial director of
the company for buying shares of the two companies. The evaluations of the financial position of
both the companies are carried out through the use of ratio analysis technique. The second
portfolio is developed for analyzing the potential worth of the two capital investment projects in
order to recommend the best option for capital investment for a local manufacturing company.
The investment appraisal techniques used to analyze the potential worth of both the projects are
NPV, ARR and payback.
Portfolio 1
The portfolio is developed for analyzing the investment worth of the following two
companies:
Sports Direct International PLC
The company is a recognized retailing group of the UK established in the year 1982. It is
attributed to be the largest sports-goods retailer company of the UK operating about 670 stores
across the world. The company carried out its operations through the four segments that are, UK
Document Page
4
Sports Retail, International Sports Retail, Brands and Premium Lifestyle. In addition to this, the
company is also involved in wholesale distribution and sale of sports, leisure, clothing, footwear
and equipment under its brand name (Sports Direct International PLC, 2016).
JD Sports Fashion PLC
The company is the recognized retailer of the UK involved in retailing and distribution of
branded sports and fashion wear products. The company since its establishment in 1982 is
involved in retailing of branded sports fashion wear, clothing, leisure, footwear and sports
products. The company has about 800 stores across the world involved in providing branded
products in the category of sports and clothing. The company has also acquired First Sport in the
year 2002 that further supported its plans of geographical expansion (JD Sports Fashion PLC,
2016).
Calculation of Financial Ratio of both the companies (2015 and 2016) and Analyzing the
Performance, Financial Position and Investment Potential of both Companies
In this section financial ratios of the Sports Direct International PLC and JD Sports
Fashion PLC have been calculated for years 2015 and 2016. In all about 10 financial have been
calculated. All the detailed calculation is presented below. Financial Data used to interpret the
financial Ratio of both the companies (Kaplan and Atkinson, 2015).
Particulars Sports Direct International PLC
2015 2016
Current Assets £ 878,297.00 £ 1,311,437.00
Current Liabilities £ 382,621.00 £ 540,608.00
Inventories £ 517,054.00 £ 702,158.00
tabler-icon-diamond-filled.svg

Paraphrase This Document

Need a fresh take? Get an instant paraphrase of this document with our AI Paraphraser
Document Page
5
Gross Profit £ 1,240,812.00 £ 1,284,644.00
Net Revenue/Sales £ 2,832,560.00 £ 2,904,325.00
Operating Profit Margin £ 295,581.00 £ 223,178.00
Net Profit Margin £ 241,353.00 £ 278,981.00
Debts (ALL) £ 138,053.00 £ 333,832.00
Shareholders’ Equity £ 1,161,551.00 £ 1,384,728.00
Total Assets £ 1,773,683.00 £ 2,359,856.00
Capital Employed £ 1,391,062.00 £ 1,819,248.00
Average Inventory £ 517,054.00 £ 609,606.00
Dividend Payments £ - £ -
EPS £ 0.40 £ 0.46
Particulars JD Sports Fashion PLC
2015 2016
Current Assets £ 400,259.00 £ 510,695.00
Current Liabilities £ 326,748.00 £ 348,154.00
Inventories £ 225,020.00 £ 238,324.00
Gross Profit £ 739,550.00 £ 884,221.00
Net Revenue/Sales £ 1,522,253.00 £ 1,821,652.00
Operating Profit Margin £ 92,646.00 £ 133,406.00
Net Profit Margin £ 53,971.00 £ 100,630.00
Debts (ALL) £ 78,820.00 £ 47,409.00
Shareholders’ Equity £ 309,991.00 £ 400,825.00
Document Page
6
Total Assets £ 681,670.00 £ 791,296.00
Capital Employed £ 354,922.00 £ 443,142.00
Average Inventory £ 225,020.00 £ 231,672.00
Dividend Payments £ 0.07 £ 0.07
EPS £ 0.35 £ 0.50
Different Ratios and their graphs
Current Ratio: The current ratio measures the ability of a company to meet its short and long-
term obligations with its current asset resources. The formula used for calculating the current
ratio is depicted as:
Current Ratio=Current Assets/Current Liabilities
Particulars Sports Direct International PLC
Liquidity Ratios 2015 2016
Current Ratio 2.30 2.43
JD Sports Fashion PLC
Current Ratio 2015 2016
1.22 1.47
Document Page
7
2015 2016
0.00
0.50
1.00
1.50
2.00
2.50
3.00
Current Ratio
Times
On the basis of the above graph it can be analyzed that Sports Direct International Plc
maintain more current assets as compare to JD Sports Fashion PLC that indicates that liquidity
performance of Sports Direct International Plc is much better than JD Sports Fashion PLC in
year 2015 as well as in year 2016 (Horngren, 2009).
Quick Ratio: The quick ratio measures the ability of the companies to meet the financial
obligations from the current assets that can be quickly converted into cash resources. The
formula for its calculation is as follows:
Quick Ratio= (Cash+ Marketable Securities+ Accounts Receivable)/Current Liabilities
Particulars Sports Direct International PLC
Liquidity Ratios 2015 2016
Quick Ratio 0.94 1.13
JD Sports Fashion PLC
2015 2016
Quick Ratio 0.54 0.78
tabler-icon-diamond-filled.svg

Paraphrase This Document

Need a fresh take? Get an instant paraphrase of this document with our AI Paraphraser
Document Page
8
Quick ratio tells liquidity performance of the company in more precise way as it does not
take inventory into accounts while making calculation of current assets. The quick ratio of Sports
Direct International Plc was 0.94 times in year 2015 while it was 0.54 times in case of JD Sports
Fashion. In year 2016, quick ratio was 1.13 times for Sports Direct while it was 0.78 times for JD
Sports Fashion PLC. So, on the basis of analysis it can be said that Sports Direct International
Plc keeps more liquid assets as compare to JD Sports Fashion.
2015 2016
0.00
0.20
0.40
0.60
0.80
1.00
1.20
Quick Ratio
Times
Particulars Sports Direct International PLC
Profitability Ratio 2015 2016
Gross Profit 43.81% 44.23%
JD Sports Fashion PLC
2015 2016
Gross Profit 48.58% 48.54%
Document Page
9
Gross Profit: It is the profitability ratio that depicts the relation between gross profit and the
total sales realized depicting the operational performance of a company. It can be calculated as
follows:
Gross Profit Ratio=Gross Profit/Net Sales
2015 2016
41.00%
42.00%
43.00%
44.00%
45.00%
46.00%
47.00%
48.00%
49.00%
Gross Profit Ratio
Percentage
Gross profit means revenue left after deducting the cost of goods sold. So every company
wants to keep higher gross profit in order to cover the operating expenses and earn very good net
profits. There were no major fluctuations in gross profits of both the company in last two years
but JD Sports Fashion has able to earn more gross profits as compare to Sports Direct
International PL C (Higgins, 2012).
Operating Profit: The ratio depicts the profit realized by a company after meeting all its
variable expenses. The ratio can be calculated as follows:
Operating Profit=Operating Profit/Sales
Particulars Sports Direct International PLC
Document Page
10
Profitability Ratio 2015 2016
Operating Profit Ratio 10.44% 7.68%
JD Sports Fashion PLC
2015 2016
Operating Profit Ratio 6.09% 7.32%
2015 2016
0.00%
2.00%
4.00%
6.00%
8.00%
10.00%
12.00%
Operating Profit Ratio
Percentage
As discussed operating profit refers to the profits left after deducting cost of goods sold
and all the operating expenses from the revenue of the company. It must be such that it can cover
the interest expenses and tax expenses so that there will be enough net profit left for the
company. Operating profit ratio of the Sports Direct International PLC was greater than the JD
Sports Fashion PLC that shows that profitability position of Sports Direct International PLC was
good subject to other expenses (Glajnaric, 2016).
tabler-icon-diamond-filled.svg

Paraphrase This Document

Need a fresh take? Get an instant paraphrase of this document with our AI Paraphraser
Document Page
11
Net Profit: The net profit ratio depicts the profit realized by a company after meeting all its
operating expenditure such as interest, taxes and stock dividends. The formula can be calculated
as follows:
Net Profit Ratio=Net Profit/Sales
Particulars Sports Direct International PLC
Profitability Ratio 2015 2016
Net Profit Ratio 8.52% 9.61%
JD Sports Fashion PLC
2015 2016
Net Profit Ratio 3.55% 5.52%
2015 2016
0.00%
2.00%
4.00%
6.00%
8.00%
10.00%
12.00%
Net Profit Ratio
Percentage
Profitability position of both companies are not sound but on comparison it can be said
that Sports Direct International PLC has better net profit ratio as compare to JD Sports Fashion
PLC.
Document Page
12
Gearing Ratio: The ratio measures the amount of funds borrowed by a company in comparison
to the use of equity funds. The formula for its calculation as follows:
Gearing Ratio=Long-term Liabilities/Capital Employed
Particulars Sports Direct International PLC
Solvency Ratio 2015 2016
Gearing Ratio 11.89% 24.11%
JD Sports Fashion PLC
2015 2016
Gearing Ratio 25.43% 11.83%
2015 2016
0.00%
5.00%
10.00%
15.00%
20.00%
25.00%
30.00%
Gearing Ratio
Percentage
In year 2015, gearing ratio of Sports Direct International PLC was better as compare JD
Sports Fashion PLC. But in year 2016, debt amount has been increased a lot in case of Sports
Direct International PLC as compare to JD Sports PLC (Gapenski, 2008).
chevron_up_icon
1 out of 24
circle_padding
hide_on_mobile
zoom_out_icon
[object Object]