Financial Statement Analysis Report: M&S vs. Sports Direct (2014-2016)
VerifiedAdded on 2020/01/23
|16
|3258
|131
Report
AI Summary
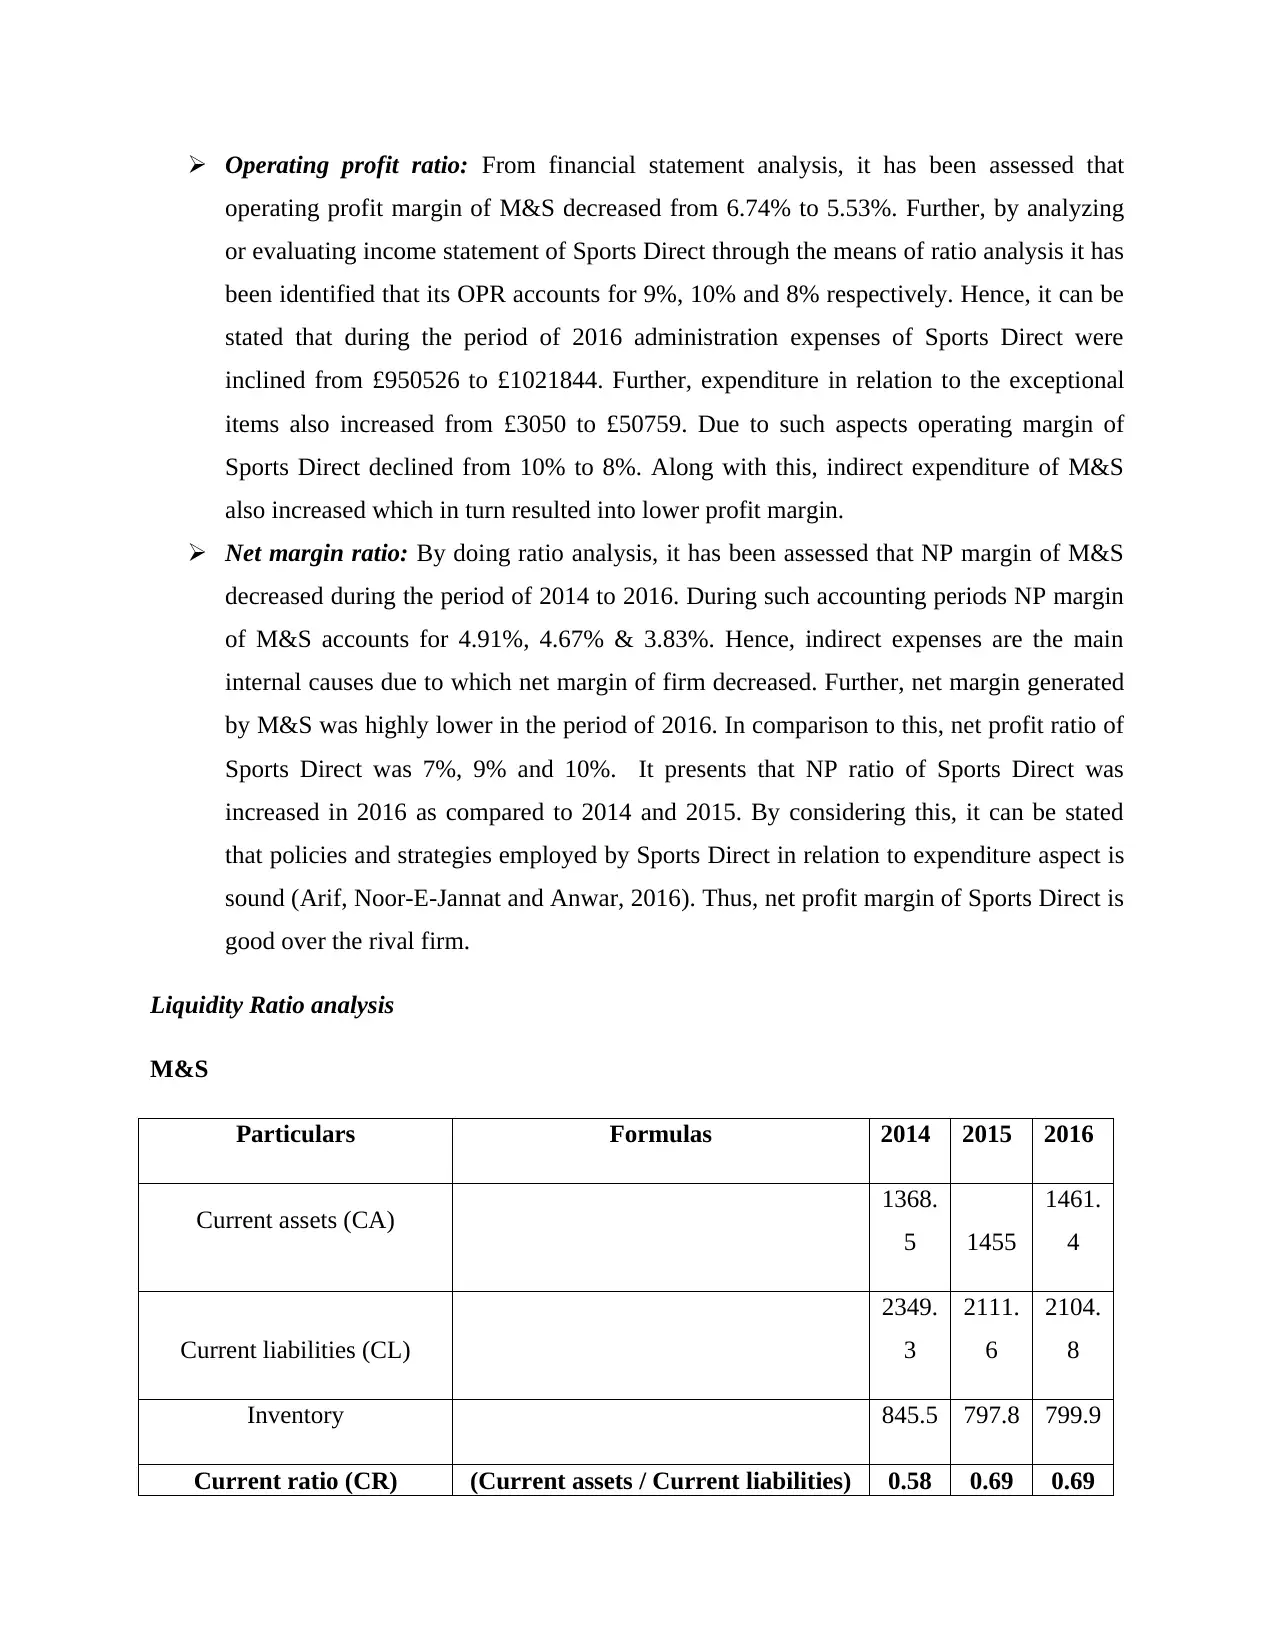
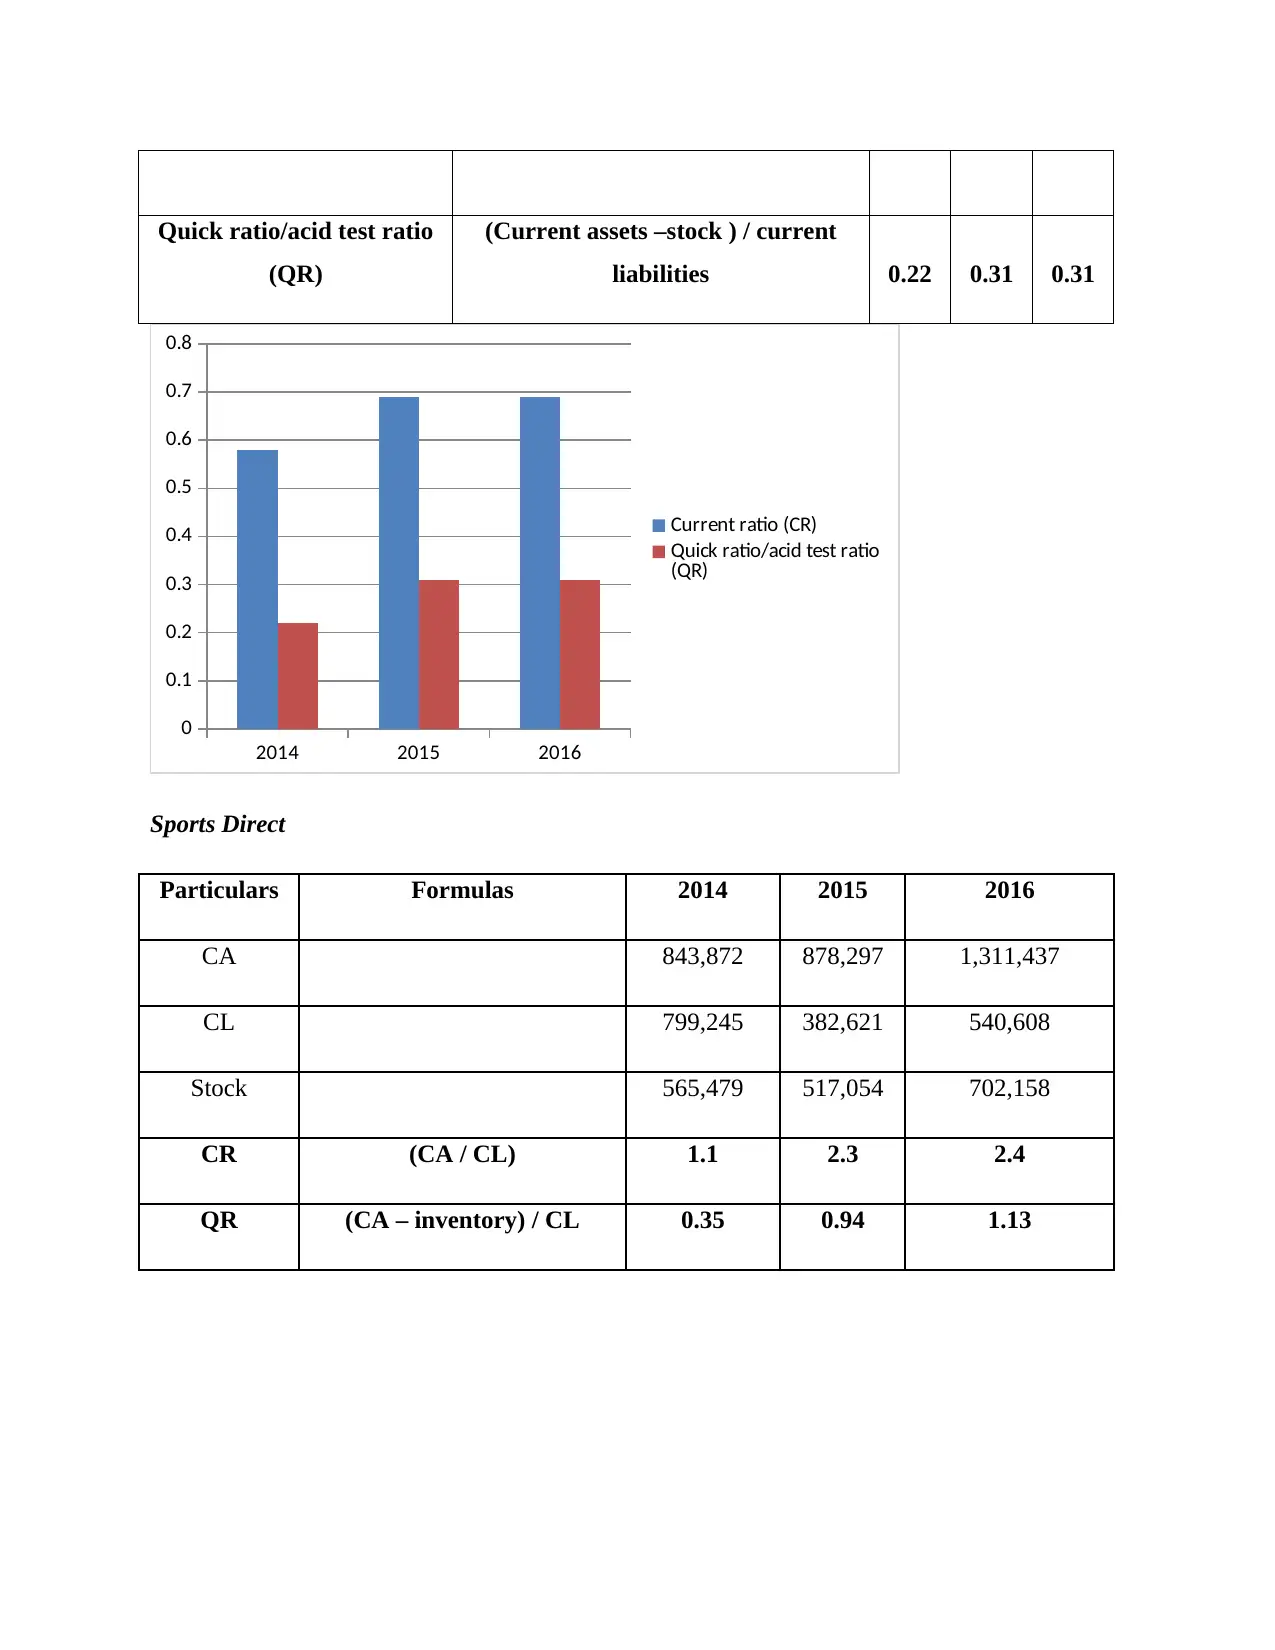
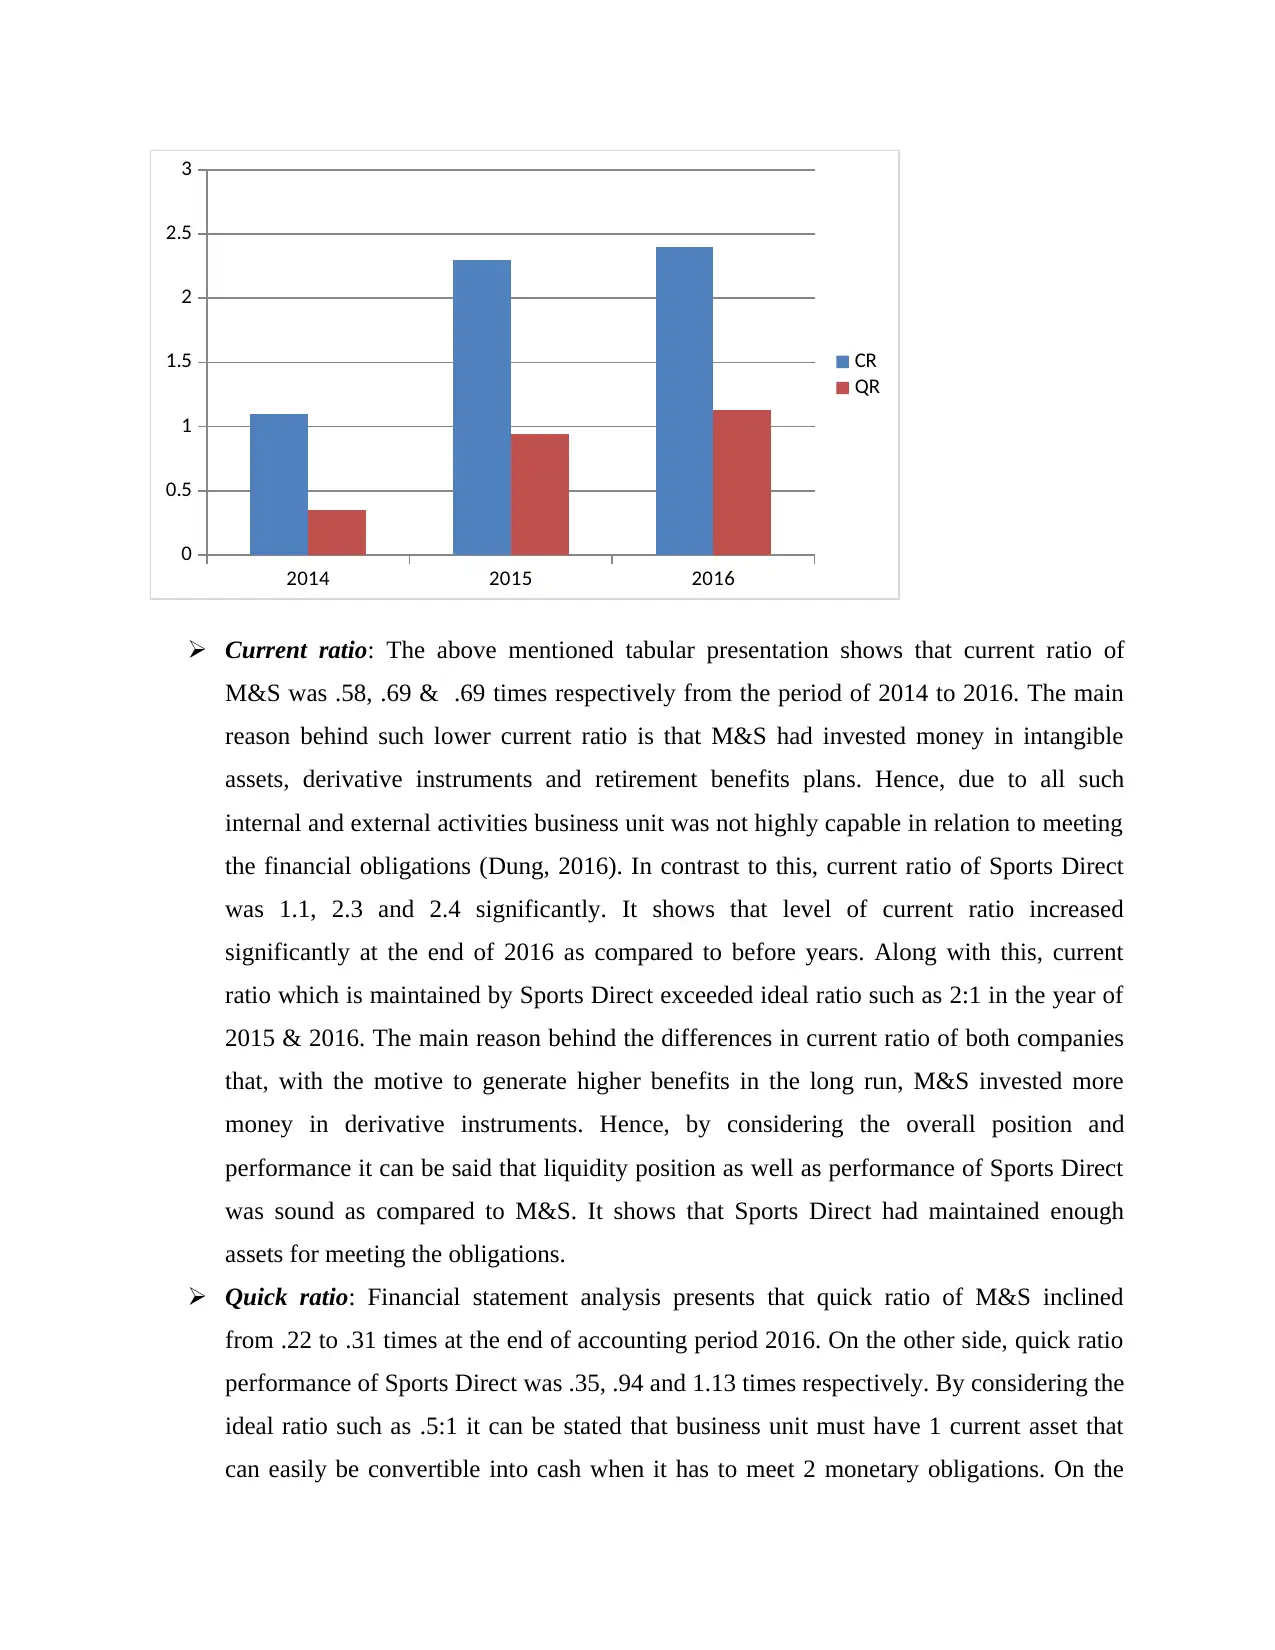
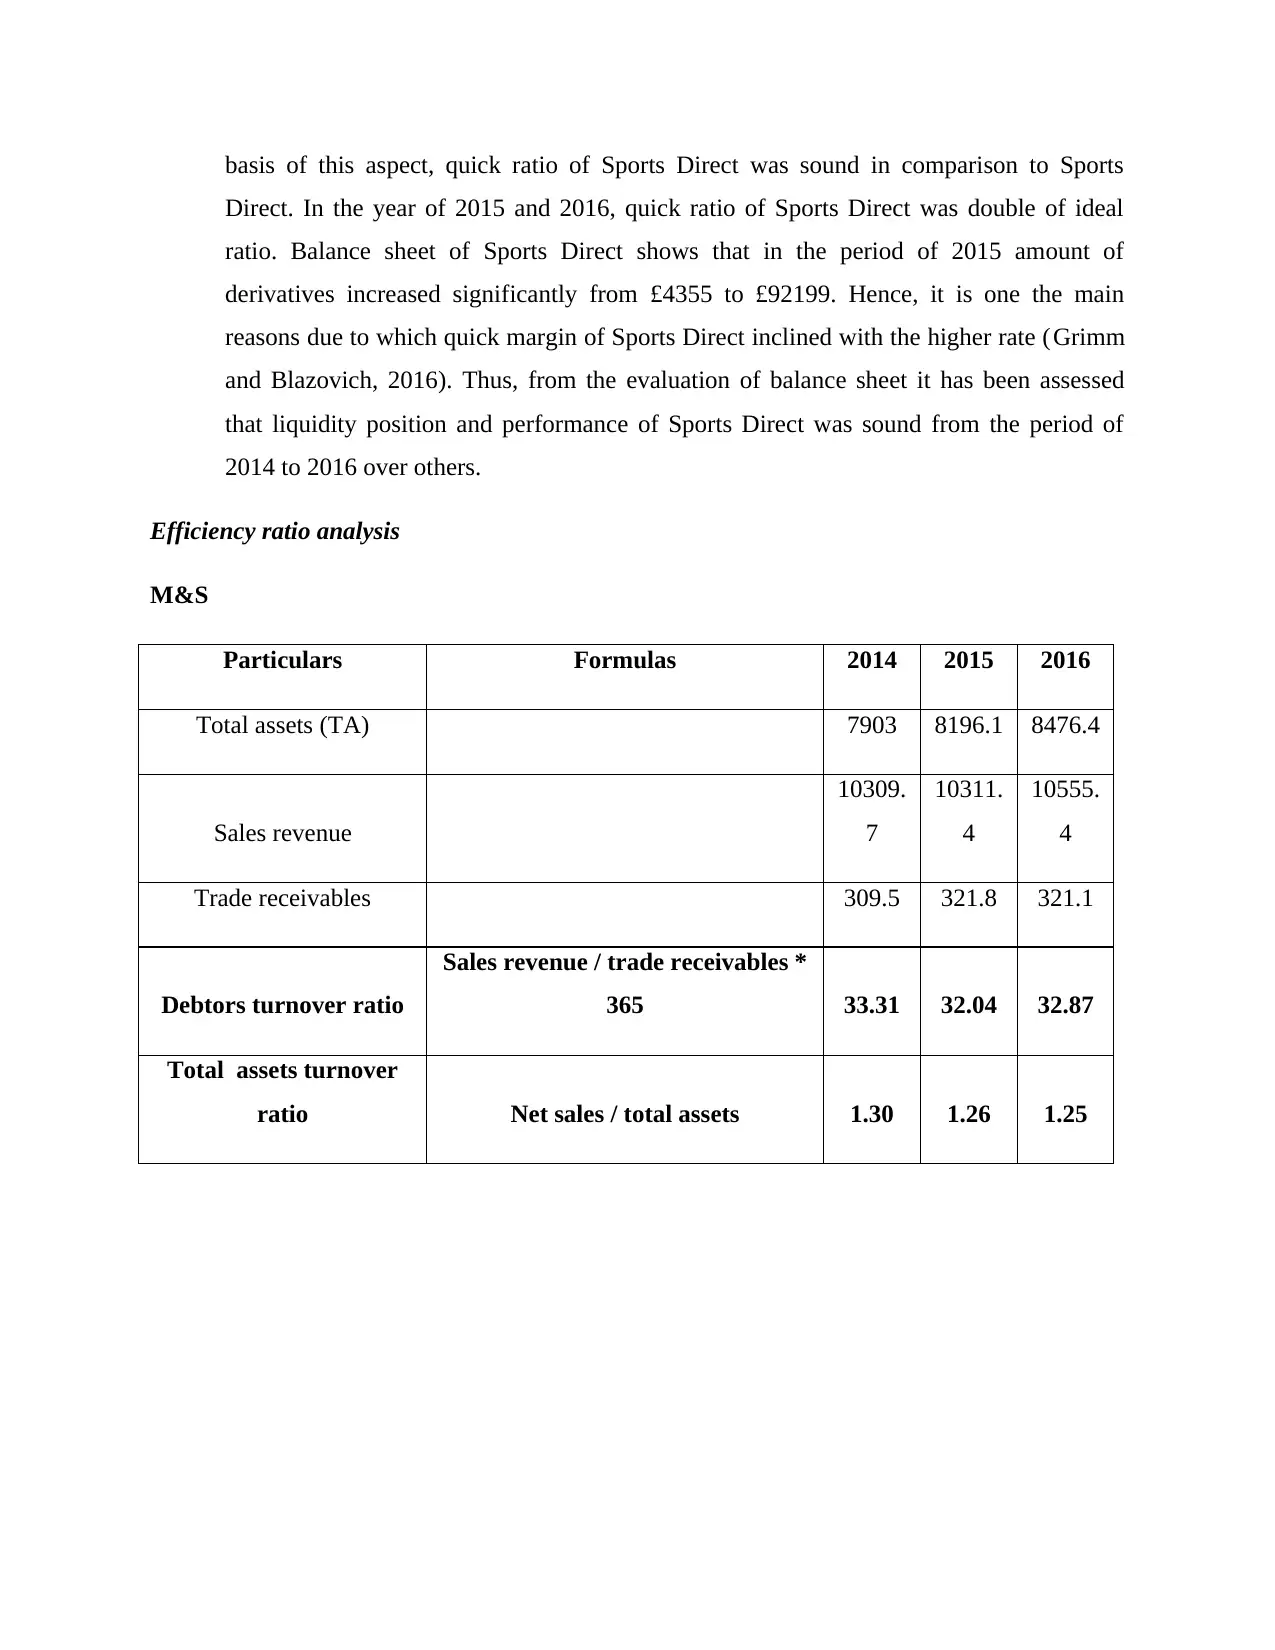
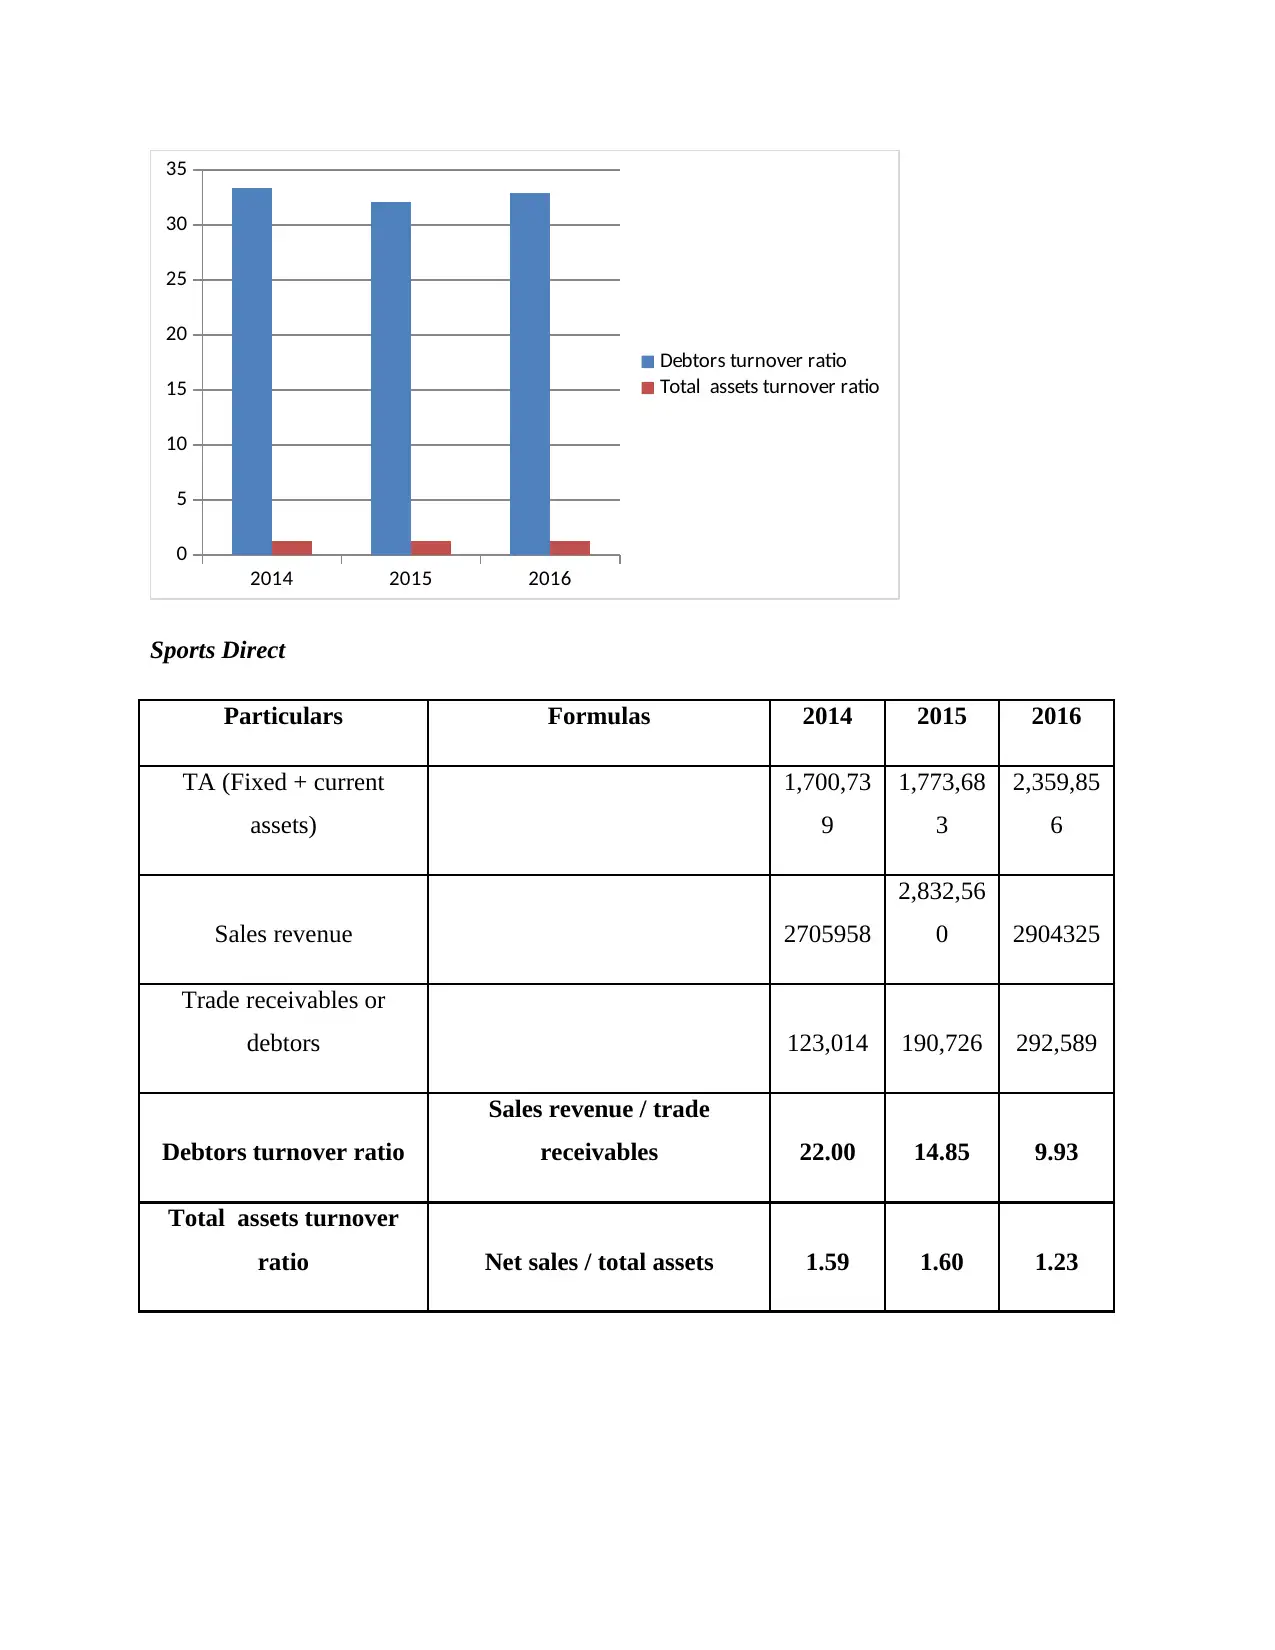
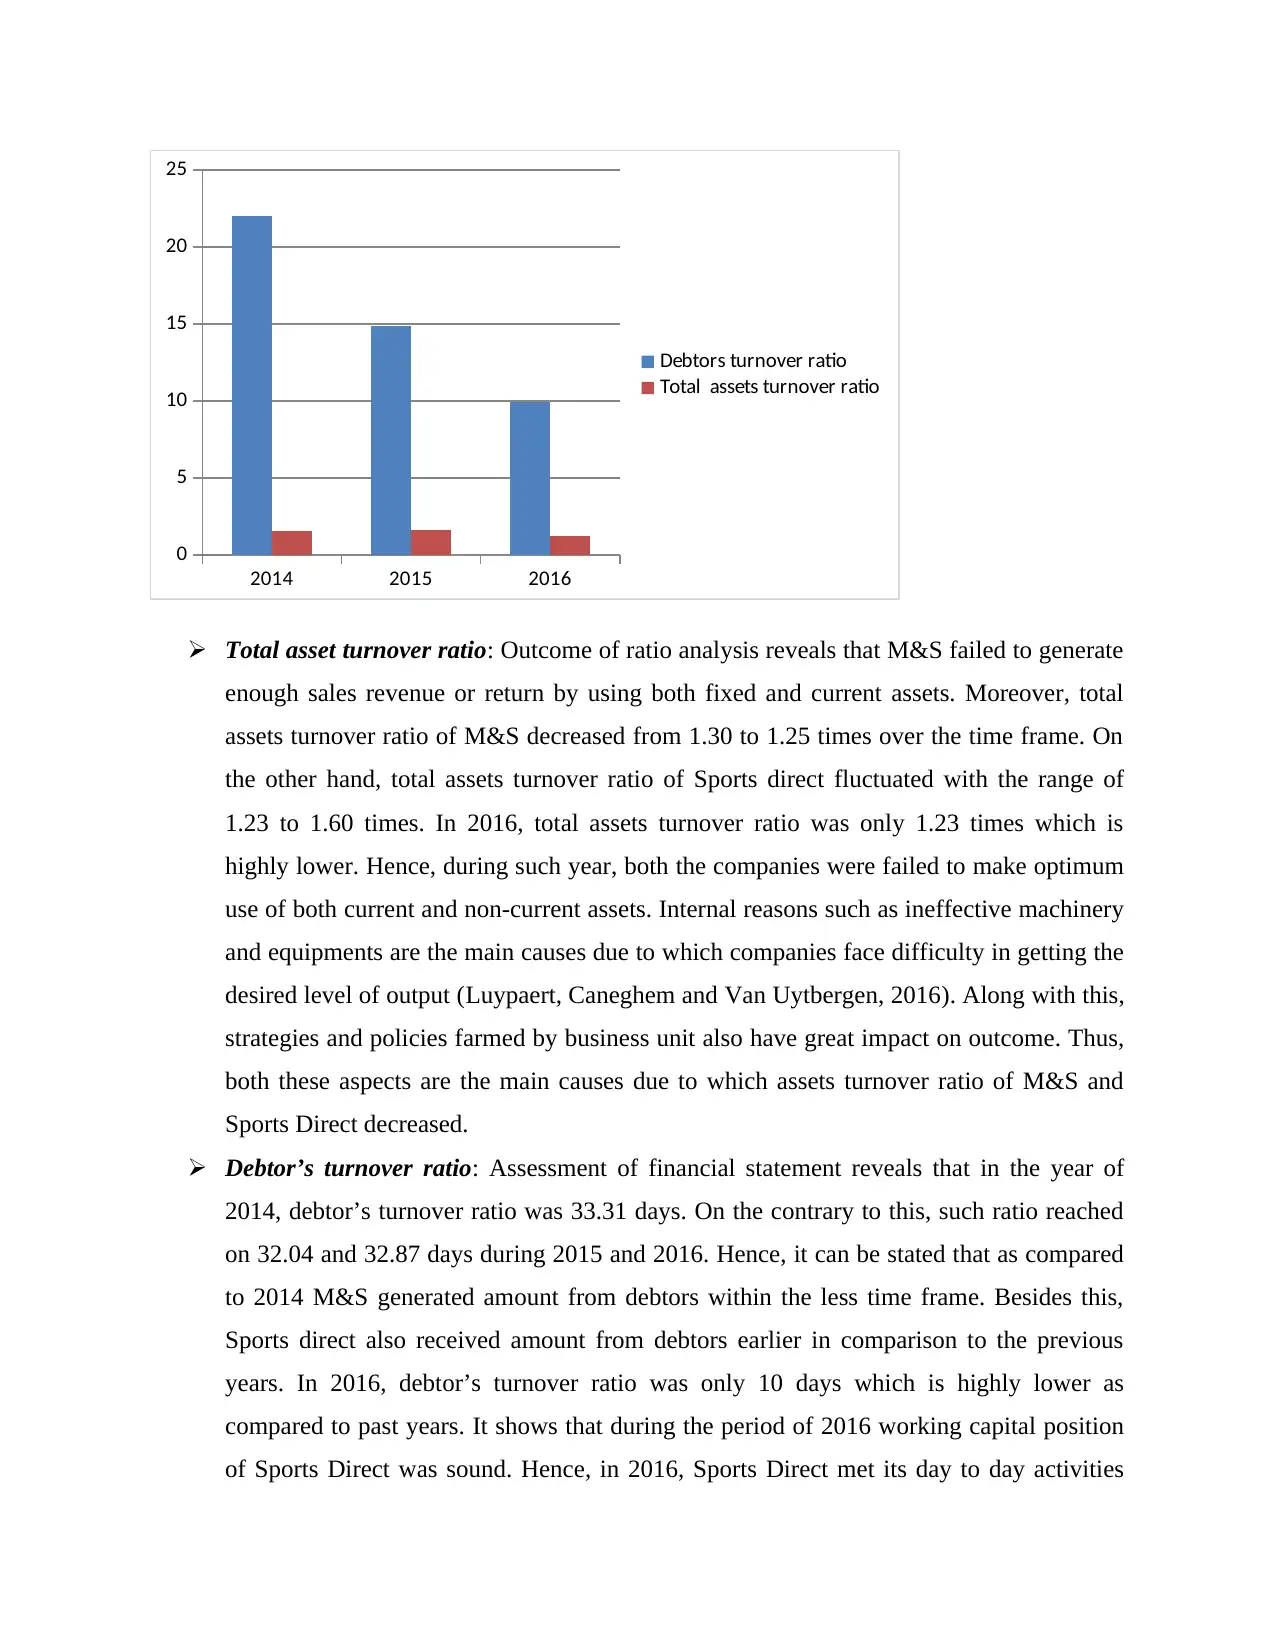
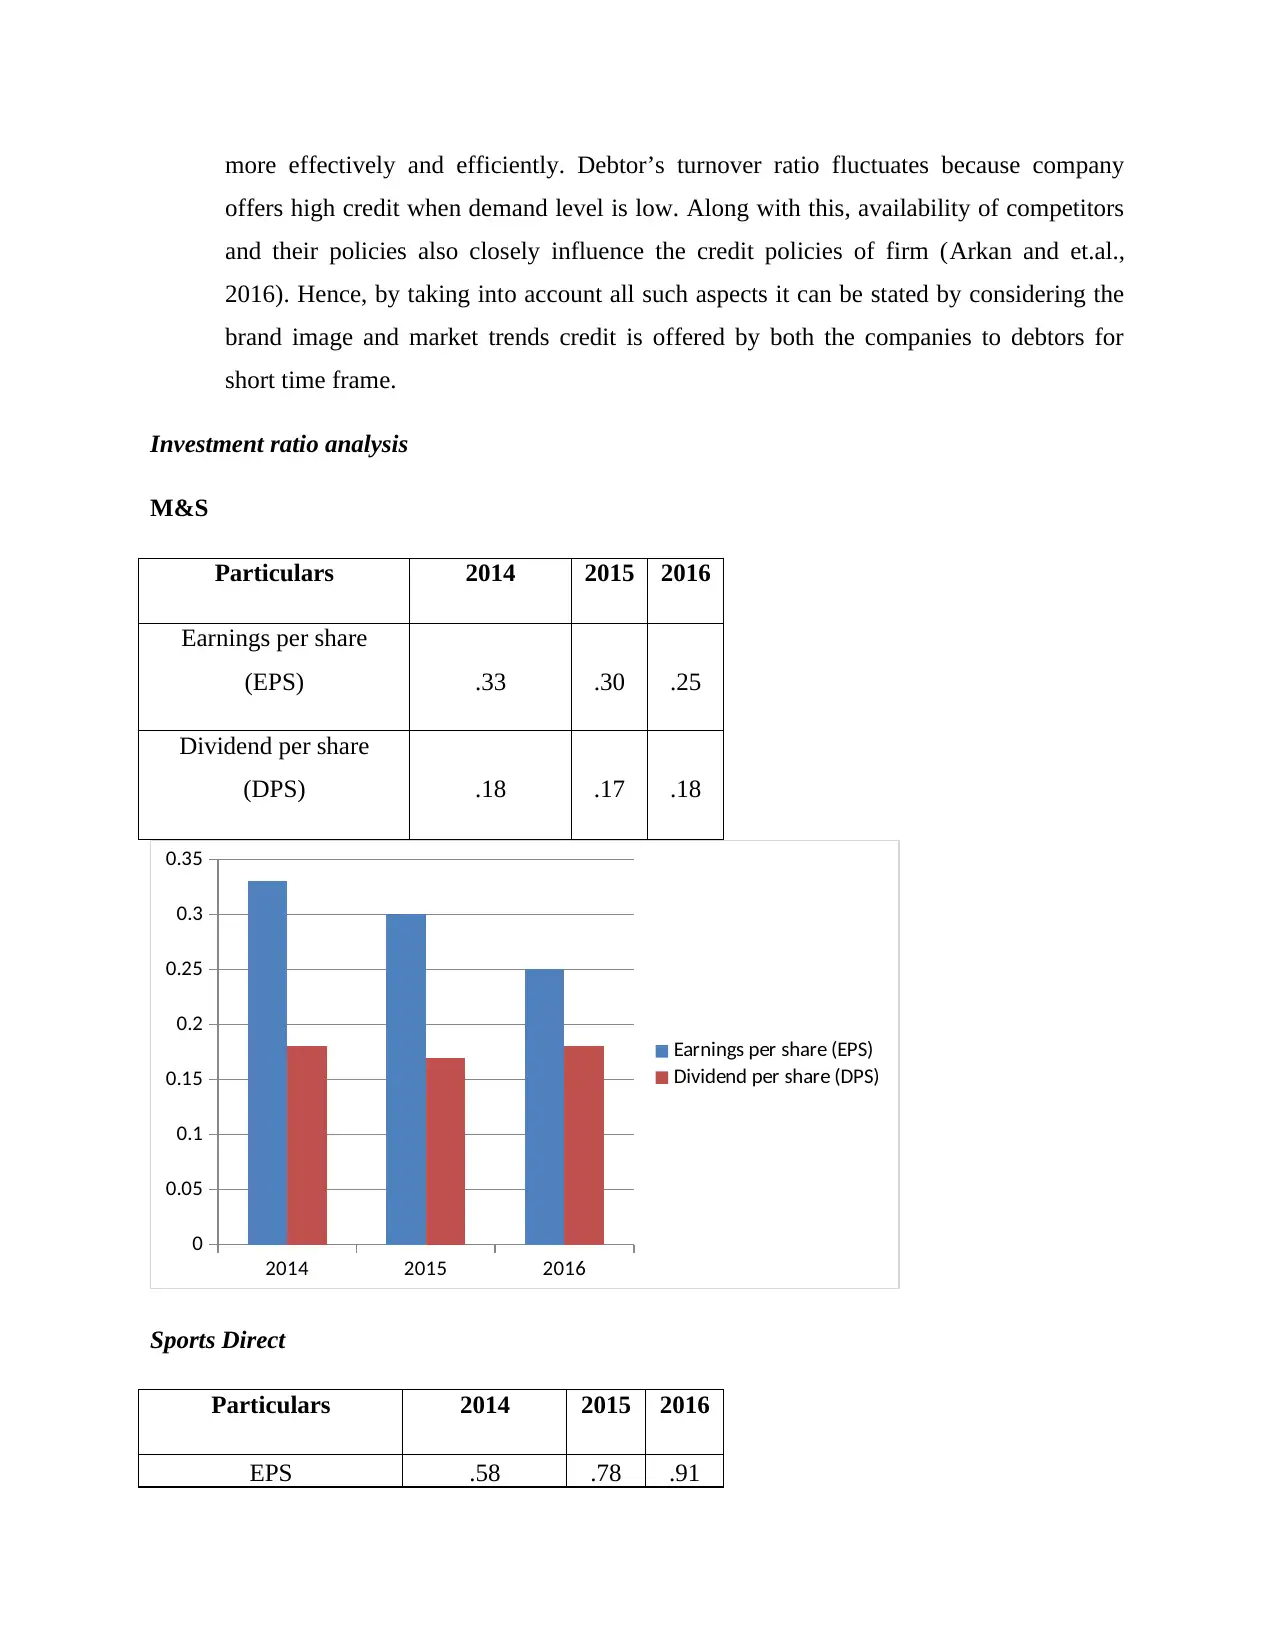
This report presents a financial statement analysis comparing Marks & Spencer (M&S) and Sports Direct from 2014 to 2016. The analysis focuses on key financial ratios, including profitability (gross profit ratio, net profit margin, operating profit margin), liquidity (current ratio, quick ratio), efficiency (debtors turnover ratio, total assets turnover ratio), and investment ratios (earnings per share, dividend per share). The report highlights the financial performance of both companies, offering insights into their strengths and weaknesses based on the calculated ratios. Sports Direct generally demonstrates stronger financial health across several metrics, particularly in liquidity and profitability. The report provides a detailed assessment of each ratio, its implications, and a comparative overview of the two companies' financial positions, supported by graphical presentations and references to relevant literature.

Financial Statement Analysis
Paraphrase This Document
Need a fresh take? Get an instant paraphrase of this document with our AI Paraphraser

Table of Contents
INTRODUCTION...........................................................................................................................3
Ratio analysis of M&S and Sports Direct for the period of 3 years are as follows.....................3
CONCLUSION..............................................................................................................................14
RECOMMENDATIONS...............................................................................................................14
REFERENCES..............................................................................................................................16

INTRODUCTION
Financial statement analysis is the process which is undertaken by higher management
for reviewing the monetary performance of firm that supports better economic decisions. Such
analysis and its outcome provide Board of Directors with effectual framework for decision
making. Hence, by considering the outcome of ratio analysis help managers in developing highly
competent strategic and policy framework for the upcoming time period. The present report is
based on Marks and Spencer M&S and its competitors such as Sports Direct. M&S is one of the
leading retail business organizations of UK which places emphasis on offering high quality
products to the customers at affordable prices. Besides this, Sports Direct is one of the leading
sports retailers of UK. Hence, the present report will shed light on the extent to which
profitability and liquidity position of M&S is sound in against to the rival firm. Besides this, it
will shed light on how efficiently company made use of its assets from the period of 2014 ton
2016.
Ratio analysis of M&S and Sports Direct for the period of 3 years are as follows
Profitability ratio analysis
M&S
Particulars Formulas
Amount (In SGD
Million)
2014 2015 2016
Net profits (NP) 506 481.7 404.4
Operating profit (OP) 694.5 701.3 584.1
Sales revenues
10309.
7
10311.
4
10555.
4
Gross profit ratio (GPR) (Gross profit / Total sales) * 100 37.5% 38.7% 39.1%
4.67% 3.83%
⊘ This is a preview!⊘
Do you want full access?
Subscribe today to unlock all pages.

Trusted by 1+ million students worldwide

operating profit margin
(OPR)
(operating profit / Total sales) *
100 6.74% 6.80% 5.53%
2014 2015 2016
0.00%
5.00%
10.00%
15.00%
20.00%
25.00%
30.00%
35.00%
40.00%
45.00%
Gross profit ratio (GPR)
Net profit margin (NPR)
operating profit margin
(OPR)
Sports Direct
Particulars Formulas
Amount (In SGD Million)
2014 2015 2016
GP 1,154,922 1,240,812 1,284,644
NP 179,613 241,353 278,981
OP 249,131 295,581 223,178
Sales
revenues 2705958 2,832,560 2904325
GPR (GP / Total sales) * 100 43% 44% 44%
NPR (NP / Total sales) * 100 7% 9% 10%
(OPR)
(operating profit / Total sales) *
100 6.74% 6.80% 5.53%
2014 2015 2016
0.00%
5.00%
10.00%
15.00%
20.00%
25.00%
30.00%
35.00%
40.00%
45.00%
Gross profit ratio (GPR)
Net profit margin (NPR)
operating profit margin
(OPR)
Sports Direct
Particulars Formulas
Amount (In SGD Million)
2014 2015 2016
GP 1,154,922 1,240,812 1,284,644
NP 179,613 241,353 278,981
OP 249,131 295,581 223,178
Sales
revenues 2705958 2,832,560 2904325
GPR (GP / Total sales) * 100 43% 44% 44%
NPR (NP / Total sales) * 100 7% 9% 10%
Paraphrase This Document
Need a fresh take? Get an instant paraphrase of this document with our AI Paraphraser

OPR (OP / Total sales) * 100 9% 10% 8%
2014 2015 2016
0%
5%
10%
15%
20%
25%
30%
35%
40%
45%
50%
GPR
NPR
OPR
Gross profit ratio: Graphical presentation shows that GP ratio of Sports Direct is highly
sound as compared to M&S. Sales revenue and gross profit of both the organizations
increased in each year. However, GP margin or ratio entails that M&S failed to generate
higher sales and exert effective control on expenses over the rival firm. Moreover, GP
ratio of M&S was 37.5%, 38.7% & 39.1%, whereas the same of Sports Direct accounts
for 43%, 44% and 44. Outcome of such margin is highly influenced from both internal
and external factors.
Moreover, changes which take place in the customer’s needs, want and expectation has
direct impact on the sales revenue of firm. In addition to this, price at which materials is
supplied by the suppliers also have great impact on cost level (Perri and Shuli, 2016). By
considering such fact it can be stated that large number of people prefer to purchase
sportswear and other products from Sports Direct rather than M&S. It shows that Sports
Direct attained success in satisfying the needs, wants and expectations of people to a great
extent in comparison to rival firm. It is the main reasons due to which sales revenue
generated by Sports Direct is lower. Further, high margin of Sports Direct shows that
business unit has exerted effectual control on the level of direct expenses.

Operating profit ratio: From financial statement analysis, it has been assessed that
operating profit margin of M&S decreased from 6.74% to 5.53%. Further, by analyzing
or evaluating income statement of Sports Direct through the means of ratio analysis it has
been identified that its OPR accounts for 9%, 10% and 8% respectively. Hence, it can be
stated that during the period of 2016 administration expenses of Sports Direct were
inclined from £950526 to £1021844. Further, expenditure in relation to the exceptional
items also increased from £3050 to £50759. Due to such aspects operating margin of
Sports Direct declined from 10% to 8%. Along with this, indirect expenditure of M&S
also increased which in turn resulted into lower profit margin.
Net margin ratio: By doing ratio analysis, it has been assessed that NP margin of M&S
decreased during the period of 2014 to 2016. During such accounting periods NP margin
of M&S accounts for 4.91%, 4.67% & 3.83%. Hence, indirect expenses are the main
internal causes due to which net margin of firm decreased. Further, net margin generated
by M&S was highly lower in the period of 2016. In comparison to this, net profit ratio of
Sports Direct was 7%, 9% and 10%. It presents that NP ratio of Sports Direct was
increased in 2016 as compared to 2014 and 2015. By considering this, it can be stated
that policies and strategies employed by Sports Direct in relation to expenditure aspect is
sound (Arif, Noor-E-Jannat and Anwar, 2016). Thus, net profit margin of Sports Direct is
good over the rival firm.
Liquidity Ratio analysis
M&S
Particulars Formulas 2014 2015 2016
Current assets (CA) 1368.
5 1455
1461.
4
Current liabilities (CL)
2349.
3
2111.
6
2104.
8
Inventory 845.5 797.8 799.9
Current ratio (CR) (Current assets / Current liabilities) 0.58 0.69 0.69
⊘ This is a preview!⊘
Do you want full access?
Subscribe today to unlock all pages.

Trusted by 1+ million students worldwide

Quick ratio/acid test ratio
(QR)
(Current assets –stock ) / current
liabilities 0.22 0.31 0.31
2014 2015 2016
0
0.1
0.2
0.3
0.4
0.5
0.6
0.7
0.8
Current ratio (CR)
Quick ratio/acid test ratio
(QR)
Sports Direct
Particulars Formulas 2014 2015 2016
CA 843,872 878,297 1,311,437
CL 799,245 382,621 540,608
Stock 565,479 517,054 702,158
CR (CA / CL) 1.1 2.3 2.4
QR (CA – inventory) / CL 0.35 0.94 1.13
(QR)
(Current assets –stock ) / current
liabilities 0.22 0.31 0.31
2014 2015 2016
0
0.1
0.2
0.3
0.4
0.5
0.6
0.7
0.8
Current ratio (CR)
Quick ratio/acid test ratio
(QR)
Sports Direct
Particulars Formulas 2014 2015 2016
CA 843,872 878,297 1,311,437
CL 799,245 382,621 540,608
Stock 565,479 517,054 702,158
CR (CA / CL) 1.1 2.3 2.4
QR (CA – inventory) / CL 0.35 0.94 1.13
Paraphrase This Document
Need a fresh take? Get an instant paraphrase of this document with our AI Paraphraser

2014 2015 2016
0
0.5
1
1.5
2
2.5
3
CR
QR
Current ratio: The above mentioned tabular presentation shows that current ratio of
M&S was .58, .69 & .69 times respectively from the period of 2014 to 2016. The main
reason behind such lower current ratio is that M&S had invested money in intangible
assets, derivative instruments and retirement benefits plans. Hence, due to all such
internal and external activities business unit was not highly capable in relation to meeting
the financial obligations (Dung, 2016). In contrast to this, current ratio of Sports Direct
was 1.1, 2.3 and 2.4 significantly. It shows that level of current ratio increased
significantly at the end of 2016 as compared to before years. Along with this, current
ratio which is maintained by Sports Direct exceeded ideal ratio such as 2:1 in the year of
2015 & 2016. The main reason behind the differences in current ratio of both companies
that, with the motive to generate higher benefits in the long run, M&S invested more
money in derivative instruments. Hence, by considering the overall position and
performance it can be said that liquidity position as well as performance of Sports Direct
was sound as compared to M&S. It shows that Sports Direct had maintained enough
assets for meeting the obligations.
Quick ratio: Financial statement analysis presents that quick ratio of M&S inclined
from .22 to .31 times at the end of accounting period 2016. On the other side, quick ratio
performance of Sports Direct was .35, .94 and 1.13 times respectively. By considering the
ideal ratio such as .5:1 it can be stated that business unit must have 1 current asset that
can easily be convertible into cash when it has to meet 2 monetary obligations. On the

basis of this aspect, quick ratio of Sports Direct was sound in comparison to Sports
Direct. In the year of 2015 and 2016, quick ratio of Sports Direct was double of ideal
ratio. Balance sheet of Sports Direct shows that in the period of 2015 amount of
derivatives increased significantly from £4355 to £92199. Hence, it is one the main
reasons due to which quick margin of Sports Direct inclined with the higher rate (Grimm
and Blazovich, 2016). Thus, from the evaluation of balance sheet it has been assessed
that liquidity position and performance of Sports Direct was sound from the period of
2014 to 2016 over others.
Efficiency ratio analysis
M&S
Particulars Formulas 2014 2015 2016
Total assets (TA) 7903 8196.1 8476.4
Sales revenue
10309.
7
10311.
4
10555.
4
Trade receivables 309.5 321.8 321.1
Debtors turnover ratio
Sales revenue / trade receivables *
365 33.31 32.04 32.87
Total assets turnover
ratio Net sales / total assets 1.30 1.26 1.25
⊘ This is a preview!⊘
Do you want full access?
Subscribe today to unlock all pages.

Trusted by 1+ million students worldwide

2014 2015 2016
0
5
10
15
20
25
30
35
Debtors turnover ratio
Total assets turnover ratio
Sports Direct
Particulars Formulas 2014 2015 2016
TA (Fixed + current
assets)
1,700,73
9
1,773,68
3
2,359,85
6
Sales revenue 2705958
2,832,56
0 2904325
Trade receivables or
debtors 123,014 190,726 292,589
Debtors turnover ratio
Sales revenue / trade
receivables 22.00 14.85 9.93
Total assets turnover
ratio Net sales / total assets 1.59 1.60 1.23
Paraphrase This Document
Need a fresh take? Get an instant paraphrase of this document with our AI Paraphraser

2014 2015 2016
0
5
10
15
20
25
Debtors turnover ratio
Total assets turnover ratio
Total asset turnover ratio: Outcome of ratio analysis reveals that M&S failed to generate
enough sales revenue or return by using both fixed and current assets. Moreover, total
assets turnover ratio of M&S decreased from 1.30 to 1.25 times over the time frame. On
the other hand, total assets turnover ratio of Sports direct fluctuated with the range of
1.23 to 1.60 times. In 2016, total assets turnover ratio was only 1.23 times which is
highly lower. Hence, during such year, both the companies were failed to make optimum
use of both current and non-current assets. Internal reasons such as ineffective machinery
and equipments are the main causes due to which companies face difficulty in getting the
desired level of output (Luypaert, Caneghem and Van Uytbergen, 2016). Along with this,
strategies and policies farmed by business unit also have great impact on outcome. Thus,
both these aspects are the main causes due to which assets turnover ratio of M&S and
Sports Direct decreased.
Debtor’s turnover ratio: Assessment of financial statement reveals that in the year of
2014, debtor’s turnover ratio was 33.31 days. On the contrary to this, such ratio reached
on 32.04 and 32.87 days during 2015 and 2016. Hence, it can be stated that as compared
to 2014 M&S generated amount from debtors within the less time frame. Besides this,
Sports direct also received amount from debtors earlier in comparison to the previous
years. In 2016, debtor’s turnover ratio was only 10 days which is highly lower as
compared to past years. It shows that during the period of 2016 working capital position
of Sports Direct was sound. Hence, in 2016, Sports Direct met its day to day activities

more effectively and efficiently. Debtor’s turnover ratio fluctuates because company
offers high credit when demand level is low. Along with this, availability of competitors
and their policies also closely influence the credit policies of firm (Arkan and et.al.,
2016). Hence, by taking into account all such aspects it can be stated by considering the
brand image and market trends credit is offered by both the companies to debtors for
short time frame.
Investment ratio analysis
M&S
Particulars 2014 2015 2016
Earnings per share
(EPS) .33 .30 .25
Dividend per share
(DPS) .18 .17 .18
2014 2015 2016
0
0.05
0.1
0.15
0.2
0.25
0.3
0.35
Earnings per share (EPS)
Dividend per share (DPS)
Sports Direct
Particulars 2014 2015 2016
EPS .58 .78 .91
⊘ This is a preview!⊘
Do you want full access?
Subscribe today to unlock all pages.

Trusted by 1+ million students worldwide
1 out of 16
Related Documents

Your All-in-One AI-Powered Toolkit for Academic Success.
+13062052269
info@desklib.com
Available 24*7 on WhatsApp / Email
Unlock your academic potential
Copyright © 2020–2025 A2Z Services. All Rights Reserved. Developed and managed by ZUCOL.