Financial Economics Report: Financial Analysis and Decision Making
VerifiedAdded on 2020/11/12
|17
|4487
|449
Report
AI Summary
This report on financial economics delves into various critical aspects of financial decision-making. It begins with the calculation of corporate tax liability, explaining the components and application of surtax. The report then explores investment decisions, comparing the risk and return of different stock options, and emphasizes the impact of diversification on mitigating investment risk. Furthermore, it addresses the estimation of financing requirements, including net funding calculations, and provides a forecasted balance sheet. The report also conducts a thorough ratio analysis, comparing key financial metrics such as current ratio, inventory turnover, debt ratio, and return on common equity against industry norms. Additionally, it covers capital budgeting decisions, outlining their features and importance. Finally, the report analyzes financial statements, including income statements and balance sheets, and discusses the functions of a finance department.

Financial Economics
Paraphrase This Document
Need a fresh take? Get an instant paraphrase of this document with our AI Paraphraser
Table of Contents
Introduction......................................................................................................................................1
QUESTION 1...................................................................................................................................1
a) Calculation of corporations tax liability..................................................................................1
b) Objective of federal government for taxing income................................................................2
QUESTION 2...................................................................................................................................3
a) Investment decision.................................................................................................................3
b) Impact on risk with diversity in investment............................................................................4
QUESTION 3...................................................................................................................................5
a) Estimation of financing requirements and its net funding.......................................................5
b) Summary of forecasting to determine additional funding.......................................................6
QUESTION 4...................................................................................................................................6
a) Ratio calculations.....................................................................................................................6
b) Advantages and Limitation of ratio analysis...........................................................................8
QUESTION 5...................................................................................................................................9
a) Capital Budgeting Decision.....................................................................................................9
b) Features of capital budgeting decision..................................................................................11
QUESTION 6.................................................................................................................................11
a) Income statement and Balance sheet ....................................................................................11
b) Functions of finance department...........................................................................................12
CONCLUSION..............................................................................................................................13
REFERENCES..............................................................................................................................15
Introduction
Economics is expanded to various fields and financial economics is one of its branch
helps to analyse the use and distribution of resources in markets in which decisions are made
under uncertainty. Financial decision are very critical for business success and must take into
account various future events, whether those are related to individual stocks, portfolios or the
market as a whole. Financial economics concentrates on decision making when consideration are
particularly important, first for which outcomes are risky and second the outcomes may occurs
different results. In this project report to understand the concept of financial economics various
tasks are performed such as calculation of tax liability, income statement with enough
explanation (Aggarwal, 2014). For arranging finances investment decision will be taken and
diversity in investment will be analysed. Net funding and additional funding requirement in the
business will be calculated. Together with this incomes statement and balance sheet will be
prepared with ratio analysis and budgeting decision.
QUESTION 1
a) Calculation of corporations tax liability
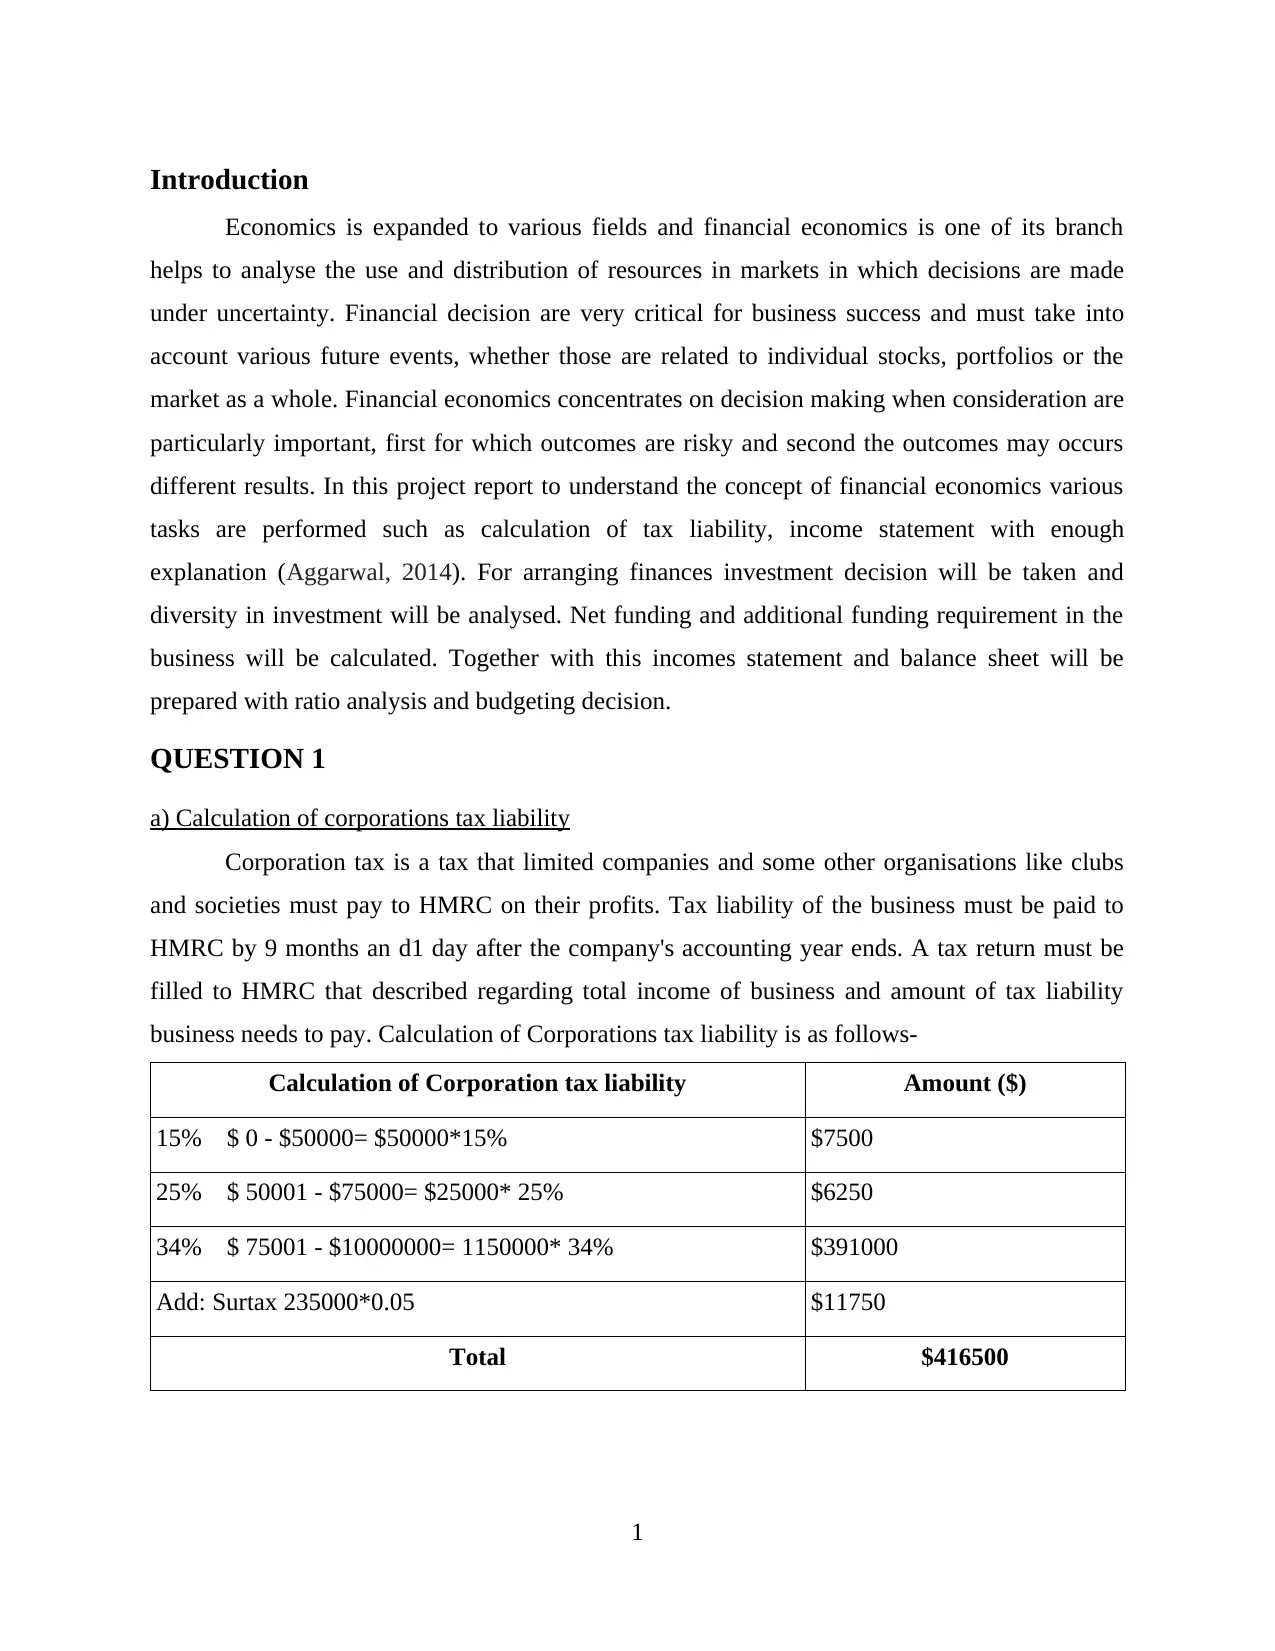
Corporation tax is a tax that limited companies and some other organisations like clubs
and societies must pay to HMRC on their profits. Tax liability of the business must be paid to
HMRC by 9 months an d1 day after the company's accounting year ends. A tax return must be
filled to HMRC that described regarding total income of business and amount of tax liability
business needs to pay. Calculation of Corporations tax liability is as follows-
Calculation of Corporation tax liability Amount ($)
15% $ 0 - $50000= $50000*15% $7500
25% $ 50001 - $75000= $25000* 25% $6250
34% $ 75001 - $10000000= 1150000* 34% $391000
Add: Surtax 235000*0.05 $11750
Total $416500
1
Economics is expanded to various fields and financial economics is one of its branch
helps to analyse the use and distribution of resources in markets in which decisions are made
under uncertainty. Financial decision are very critical for business success and must take into
account various future events, whether those are related to individual stocks, portfolios or the
market as a whole. Financial economics concentrates on decision making when consideration are
particularly important, first for which outcomes are risky and second the outcomes may occurs
different results. In this project report to understand the concept of financial economics various
tasks are performed such as calculation of tax liability, income statement with enough
explanation (Aggarwal, 2014). For arranging finances investment decision will be taken and
diversity in investment will be analysed. Net funding and additional funding requirement in the
business will be calculated. Together with this incomes statement and balance sheet will be
prepared with ratio analysis and budgeting decision.
QUESTION 1
a) Calculation of corporations tax liability
Corporation tax is a tax that limited companies and some other organisations like clubs
and societies must pay to HMRC on their profits. Tax liability of the business must be paid to
HMRC by 9 months an d1 day after the company's accounting year ends. A tax return must be
filled to HMRC that described regarding total income of business and amount of tax liability
business needs to pay. Calculation of Corporations tax liability is as follows-
Calculation of Corporation tax liability Amount ($)
15% $ 0 - $50000= $50000*15% $7500
25% $ 50001 - $75000= $25000* 25% $6250
34% $ 75001 - $10000000= 1150000* 34% $391000
Add: Surtax 235000*0.05 $11750
Total $416500
1
⊘ This is a preview!⊘
Do you want full access?
Subscribe today to unlock all pages.
Trusted by 1+ million students worldwide
Note: Total income of Sandersen, Inc is $1225000 and the applicability of tax named as surtax is
as-
5% on income between $100000 and $335000.
3% on income between $15000000 and $18333333.
For Sandersen, Inc surtax will be applicable when the income is between $100000 and
$335000. Surcharge tax will be calculated on $235000 with 5% rate and will be added to the
amount of total tax.
b) Objective of federal government for taxing income
Government of each country plays important in performing various functions that helps
each sector of economy to perform well and developed on recurrent basis. Government performs
various functions and for this various departments are established all around the nation. To run
all these departments and introducing new development requires huge amount of expenditures.
To met these expense revenues are required that are generated by performing various business
activities by government but this is not sufficient (Berger and Bouwman, 2013). A tax on income
earned by various financial institutions and all the small and large businesses form a important
part of revenues for government. Imposing taxes on the businesses for generating revenue to
meet government expenditure is not the sole motive. Along with this purpose social and
economical objectives have been added to this.
This can be proved as it prevent concentration of wealth in a few hands as tax is imposed
on organisations and individuals according to their income level. This prevents concentration of
wealth in a few hands of the rich. So that gap between rich and poor can be narrowed. Tax
collected by government is used in many welfare activities in this way wealth of rich is
redistributed to the whole community. Tax serves as an instrument for promoting economic
growth, stability and efficiency. The government controls or expands the economic activities of
the country by providing various concessions, rebates and other facilities. Amount generated
through tax is used for developing employment generated activities and problem of
unemployment can be reduced. Through all these benefits of imposing tax by the government it
is clear that taxes are not only used to met expenditures but also helps in social and economic
benefits (Bourkhis and Nabi, 2013).
2
Paraphrase This Document
Need a fresh take? Get an instant paraphrase of this document with our AI Paraphraser
QUESTION 2
a) Investment decision
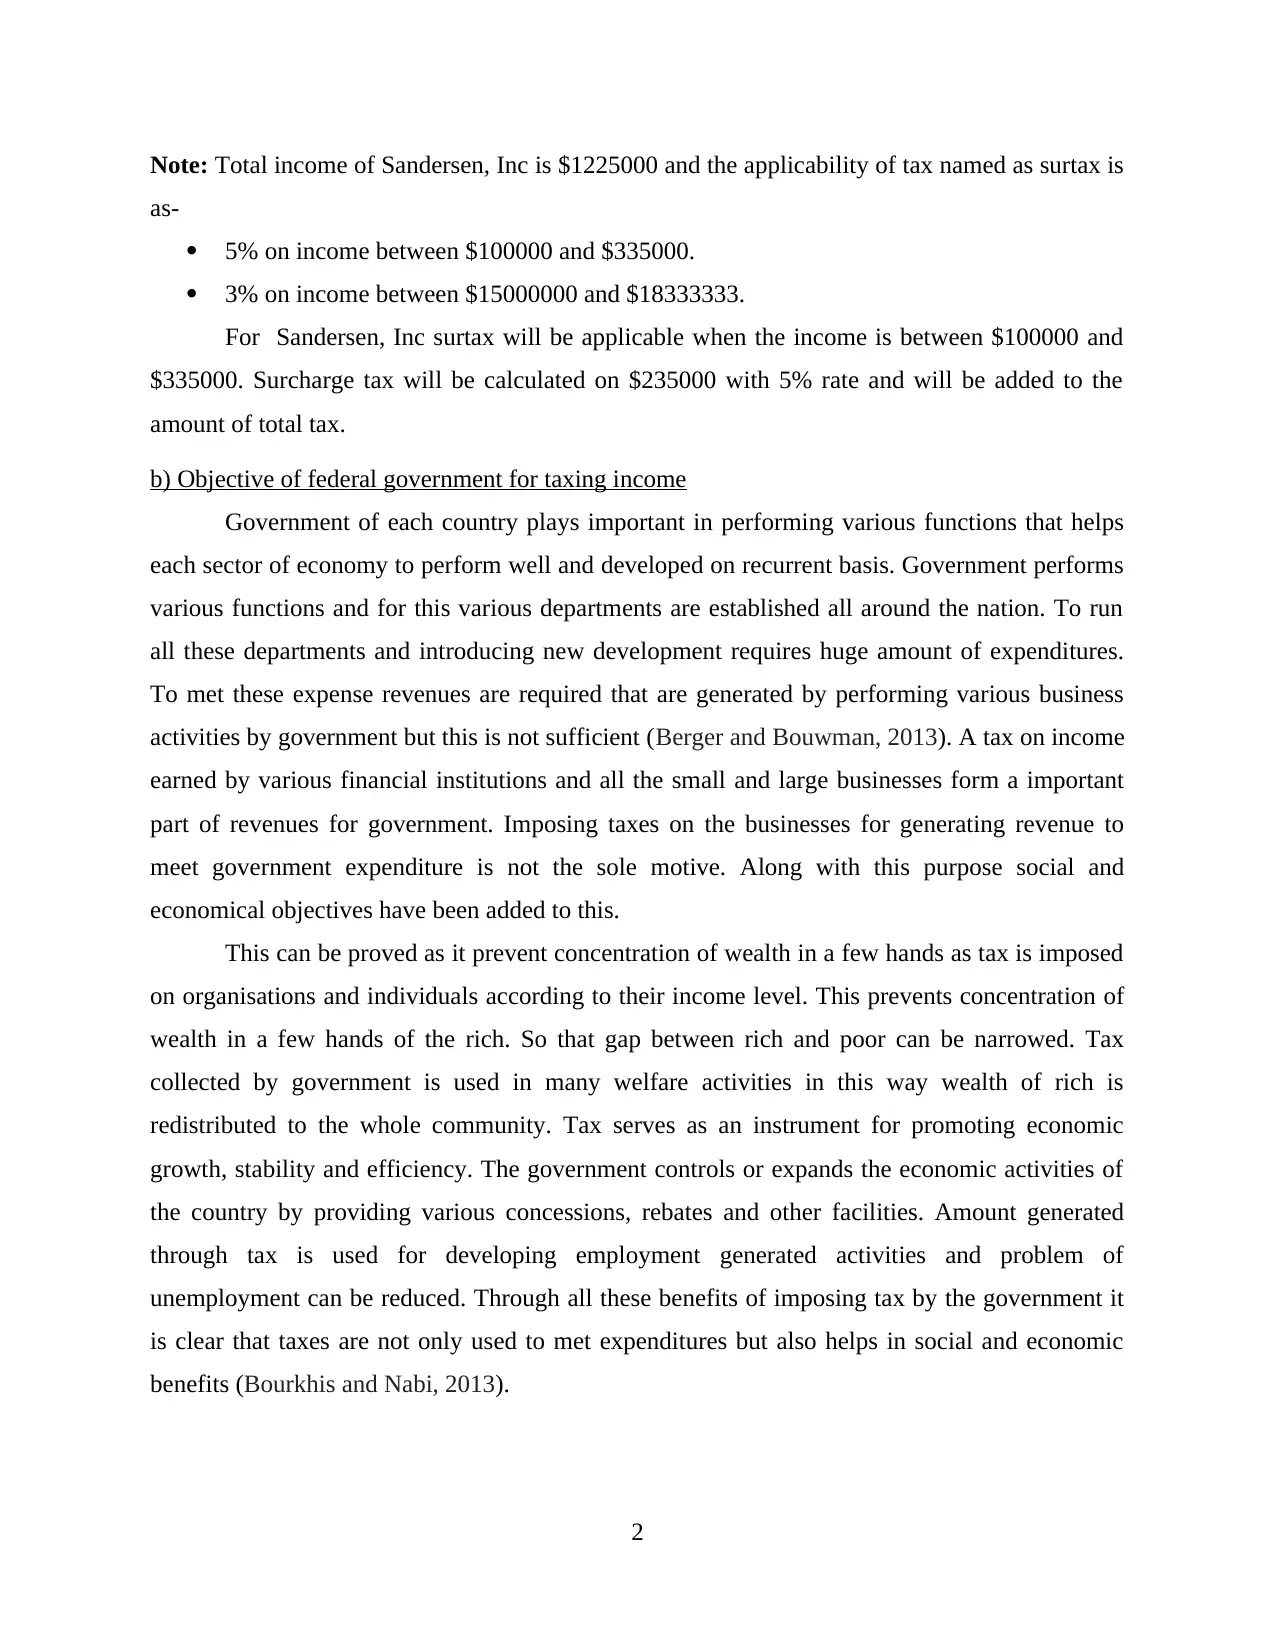
Fair INC is considering an investment and two options are available with the business but
one needs to be considered and this decision will be made on the basis of risk involved and
return of the investment. Calculations are as follows-
Common Stock A
Calculation of Risk:
Probability (P) Return (X) (P*X) (X-15.3) (X-15.3)2 P*(X-15.3)2
0.3 12 3.6 -3.3 10.89 3.267
0.4 15 6 -0.3 0.09 0.036
0.3 19 5.7 3.7 13.69 4.107
15.3 7.41
In this mean is 15.3.
Variance= Σ (X- x̅ )2*P / n-1
= 7.41/3-1
=3.705
Standard Deviation (Risk)= √variance
= √3.705
= 1.924
Calculation of return= P1*R1+P2*R2+P3*R3
=0.3*12+0.4*15+0.3*19
=15.3%
Common Stock B
Calculation of Risk:
Probability (P) Return (X) (P*X) (X-13.4) (X-13.4)2 P*(X-15.3)2
0.2 15 3 1.6 2.56 0.512
0.3 6 1.8 -7.4 54.76 16.428
0.3 14 4.2 0.6 0.36 0.108
3
a) Investment decision
Fair INC is considering an investment and two options are available with the business but
one needs to be considered and this decision will be made on the basis of risk involved and
return of the investment. Calculations are as follows-
Common Stock A
Calculation of Risk:
Probability (P) Return (X) (P*X) (X-15.3) (X-15.3)2 P*(X-15.3)2
0.3 12 3.6 -3.3 10.89 3.267
0.4 15 6 -0.3 0.09 0.036
0.3 19 5.7 3.7 13.69 4.107
15.3 7.41
In this mean is 15.3.
Variance= Σ (X- x̅ )2*P / n-1
= 7.41/3-1
=3.705
Standard Deviation (Risk)= √variance
= √3.705
= 1.924
Calculation of return= P1*R1+P2*R2+P3*R3
=0.3*12+0.4*15+0.3*19
=15.3%
Common Stock B
Calculation of Risk:
Probability (P) Return (X) (P*X) (X-13.4) (X-13.4)2 P*(X-15.3)2
0.2 15 3 1.6 2.56 0.512
0.3 6 1.8 -7.4 54.76 16.428
0.3 14 4.2 0.6 0.36 0.108
3
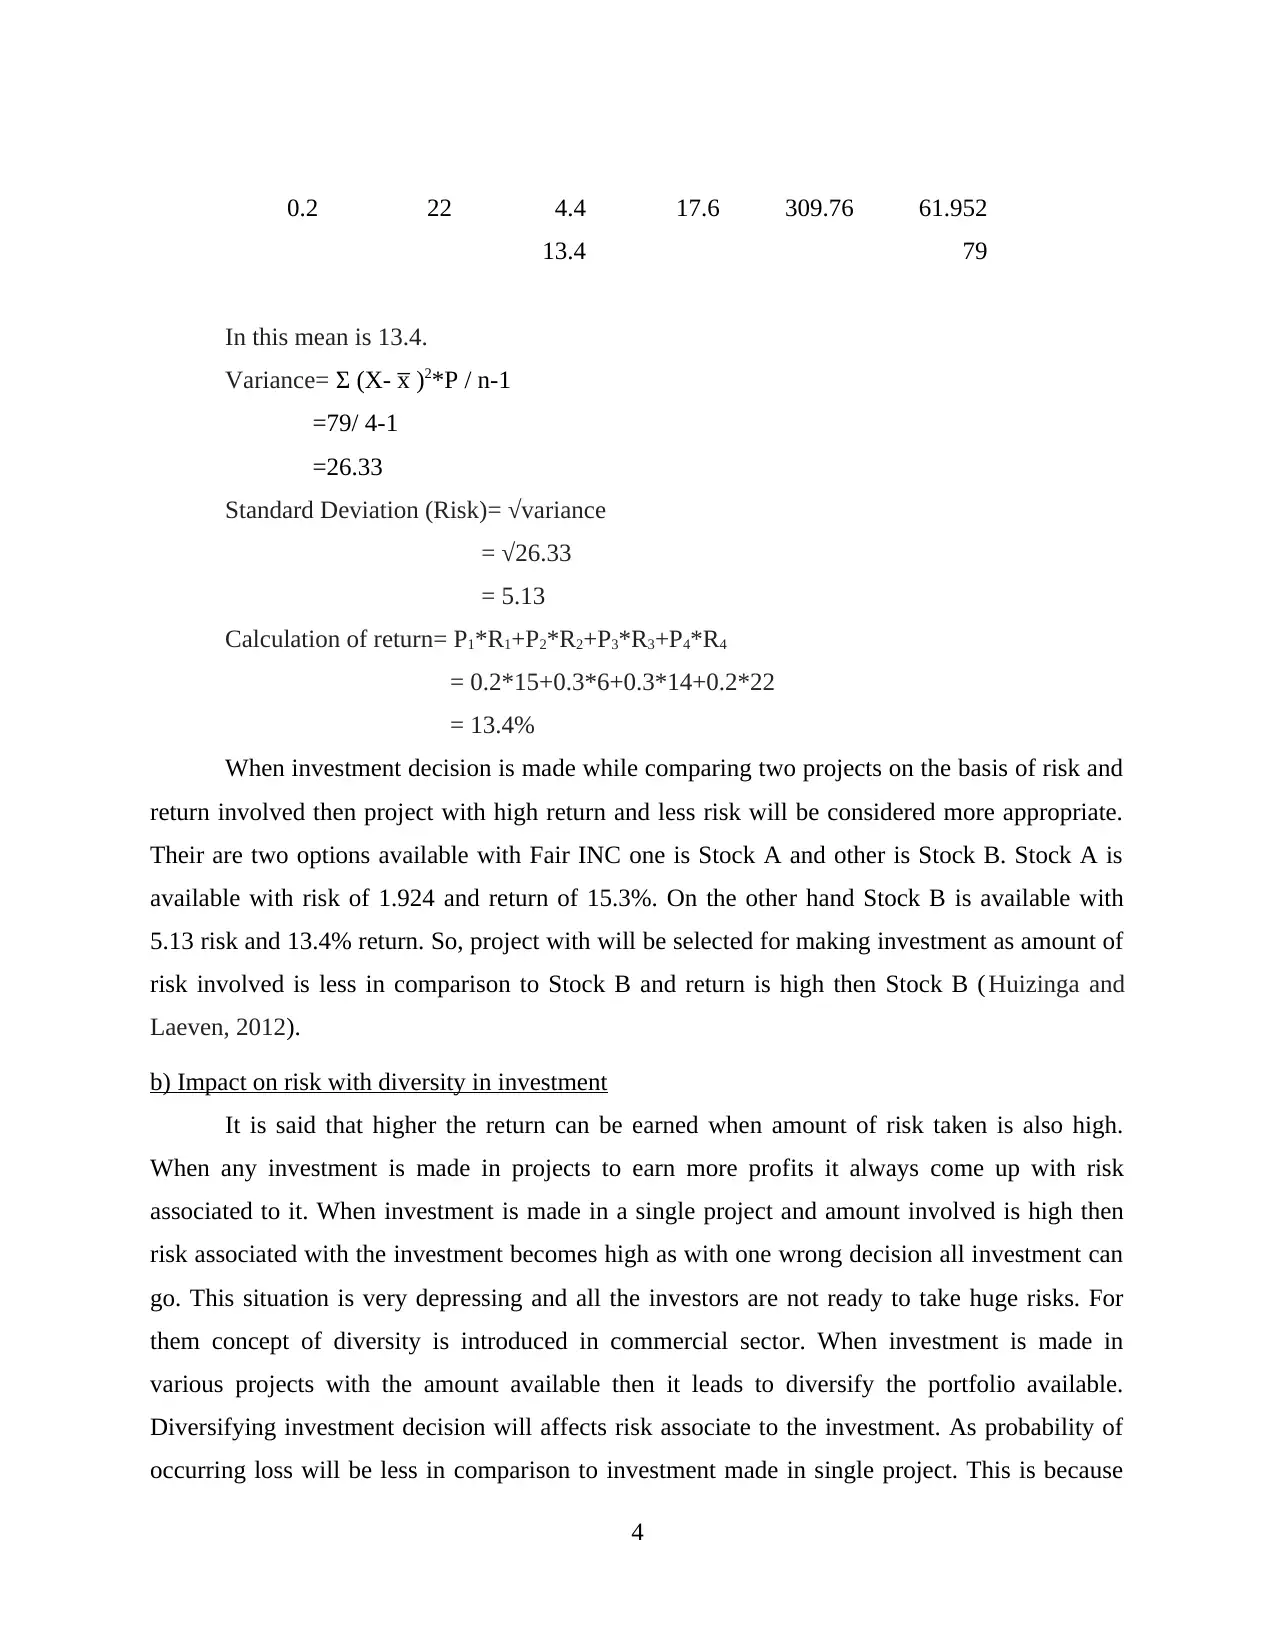
0.2 22 4.4 17.6 309.76 61.952
13.4 79
In this mean is 13.4.
Variance= Σ (X- x̅ )2*P / n-1
=79/ 4-1
=26.33
Standard Deviation (Risk)= √variance
= √26.33
= 5.13
Calculation of return= P1*R1+P2*R2+P3*R3+P4*R4
= 0.2*15+0.3*6+0.3*14+0.2*22
= 13.4%
When investment decision is made while comparing two projects on the basis of risk and
return involved then project with high return and less risk will be considered more appropriate.
Their are two options available with Fair INC one is Stock A and other is Stock B. Stock A is
available with risk of 1.924 and return of 15.3%. On the other hand Stock B is available with
5.13 risk and 13.4% return. So, project with will be selected for making investment as amount of
risk involved is less in comparison to Stock B and return is high then Stock B (Huizinga and
Laeven, 2012).
b) Impact on risk with diversity in investment
It is said that higher the return can be earned when amount of risk taken is also high.
When any investment is made in projects to earn more profits it always come up with risk
associated to it. When investment is made in a single project and amount involved is high then
risk associated with the investment becomes high as with one wrong decision all investment can
go. This situation is very depressing and all the investors are not ready to take huge risks. For
them concept of diversity is introduced in commercial sector. When investment is made in
various projects with the amount available then it leads to diversify the portfolio available.
Diversifying investment decision will affects risk associate to the investment. As probability of
occurring loss will be less in comparison to investment made in single project. This is because
4
⊘ This is a preview!⊘
Do you want full access?
Subscribe today to unlock all pages.
Trusted by 1+ million students worldwide
when funds are invested in different projects chances success and failure of business also gets
diversified (Jovanovic and Schinckus, 2013). Risk is segregated into two nature one is positive
and other one is negative. Positive risk is regarded as an opportunity and proactive measures are
taken to increase them. On the other hand negative risk can compromise the success of the
project therefore the team and project manager must make efforts to minimise these risks.
Diversified investment helps in increasing positive risk in the business and helps in earning more
and more funds.
QUESTION 3
a) Estimation of financing requirements and its net funding
Financing requirements: Finance is most important for any business organisation as to
survive and carry out its operation finance is need. Financing requirements can be of two types
Working capital and fixed capital. Working capital helps organisation to carry out its operation
fluently and fixed capital is a amount invested by shareholders in an organisation. It can be used
to manage its working capital also and for the purchase of fixed assets or any other important
investment (Jovanovic and Schinckus, 2017).
Net Funding: It is a amount which is hold back by an organisation temporarily from total
loan amount. It is also called as a temporary set off of an account which has to be paid later.
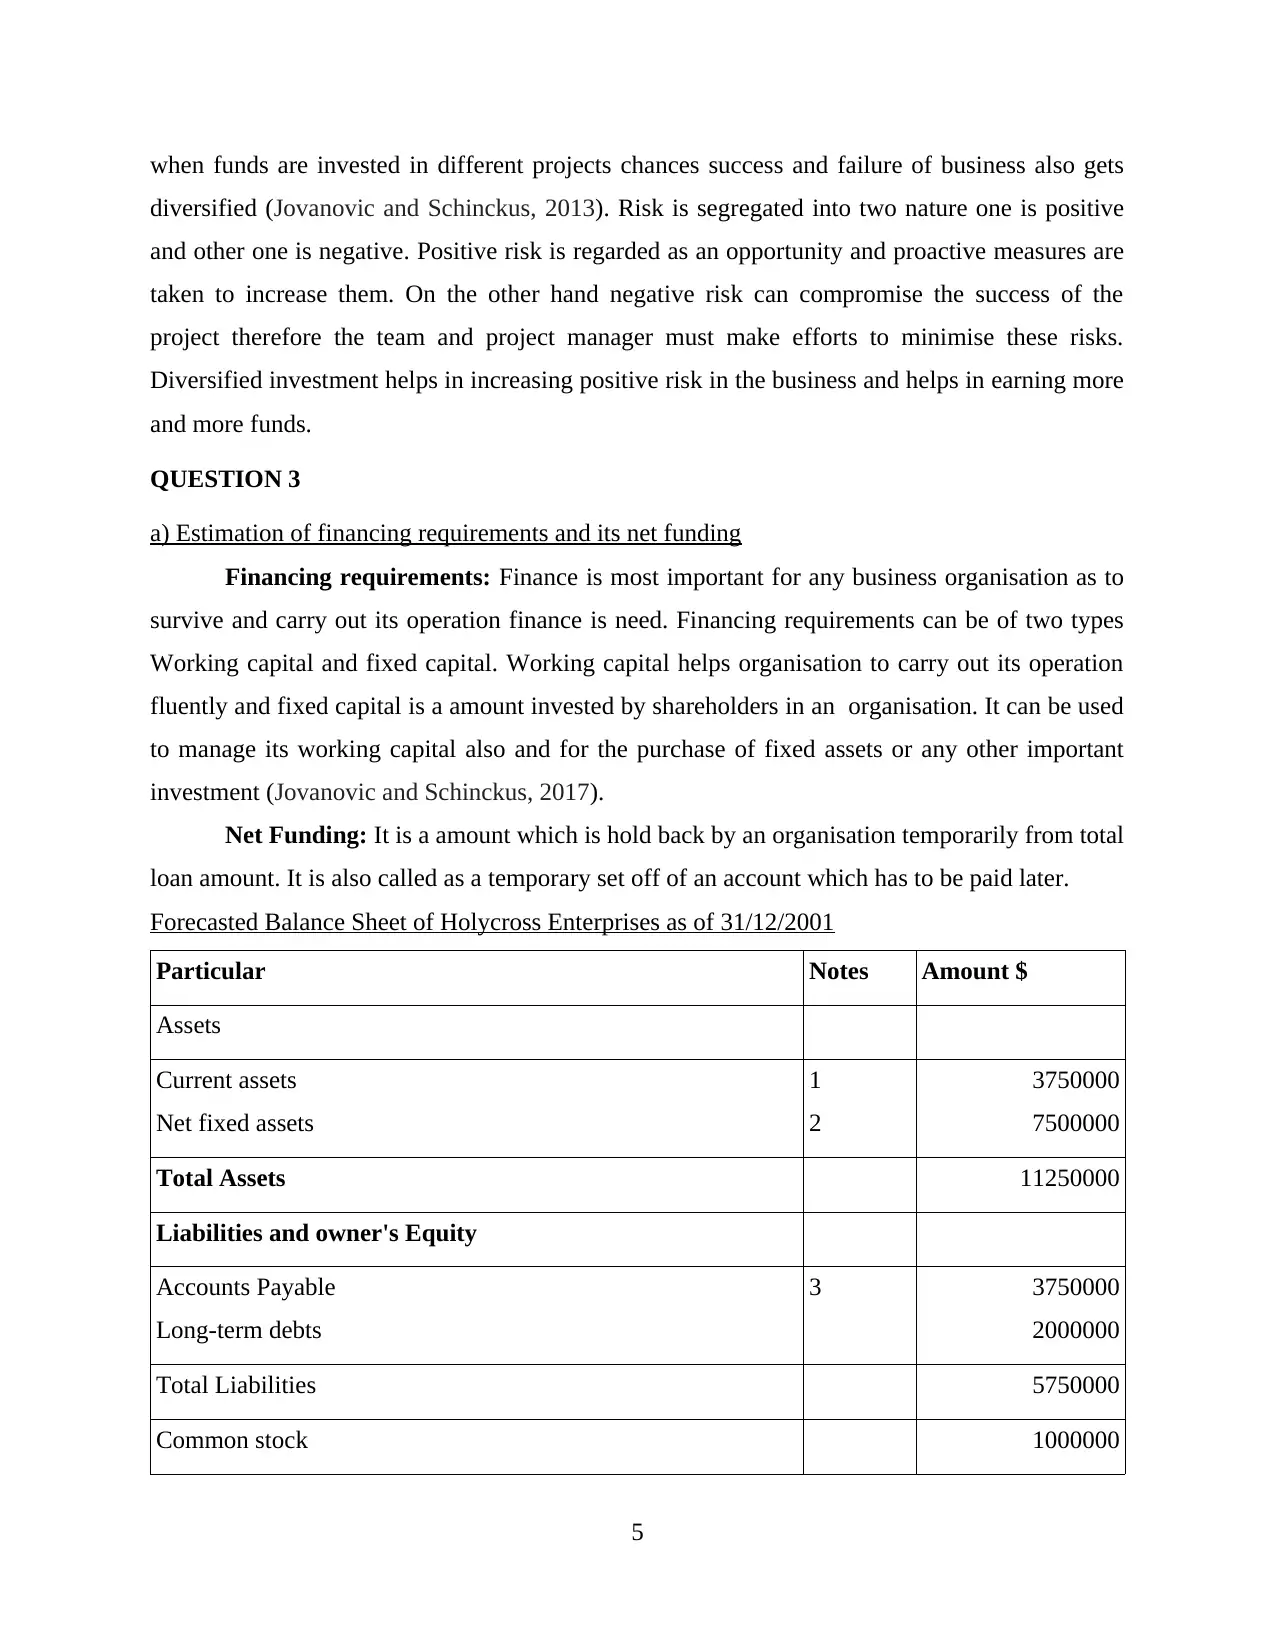
Forecasted Balance Sheet of Holycross Enterprises as of 31/12/2001
Particular Notes Amount $
Assets
Current assets
Net fixed assets
1
2
3750000
7500000
Total Assets 11250000
Liabilities and owner's Equity
Accounts Payable
Long-term debts
3 3750000
2000000
Total Liabilities 5750000
Common stock 1000000
5
diversified (Jovanovic and Schinckus, 2013). Risk is segregated into two nature one is positive
and other one is negative. Positive risk is regarded as an opportunity and proactive measures are
taken to increase them. On the other hand negative risk can compromise the success of the
project therefore the team and project manager must make efforts to minimise these risks.
Diversified investment helps in increasing positive risk in the business and helps in earning more
and more funds.
QUESTION 3
a) Estimation of financing requirements and its net funding
Financing requirements: Finance is most important for any business organisation as to
survive and carry out its operation finance is need. Financing requirements can be of two types
Working capital and fixed capital. Working capital helps organisation to carry out its operation
fluently and fixed capital is a amount invested by shareholders in an organisation. It can be used
to manage its working capital also and for the purchase of fixed assets or any other important
investment (Jovanovic and Schinckus, 2017).
Net Funding: It is a amount which is hold back by an organisation temporarily from total
loan amount. It is also called as a temporary set off of an account which has to be paid later.
Forecasted Balance Sheet of Holycross Enterprises as of 31/12/2001
Particular Notes Amount $
Assets
Current assets
Net fixed assets
1
2
3750000
7500000
Total Assets 11250000
Liabilities and owner's Equity
Accounts Payable
Long-term debts
3 3750000
2000000
Total Liabilities 5750000
Common stock 1000000
5
Paraphrase This Document
Need a fresh take? Get an instant paraphrase of this document with our AI Paraphraser
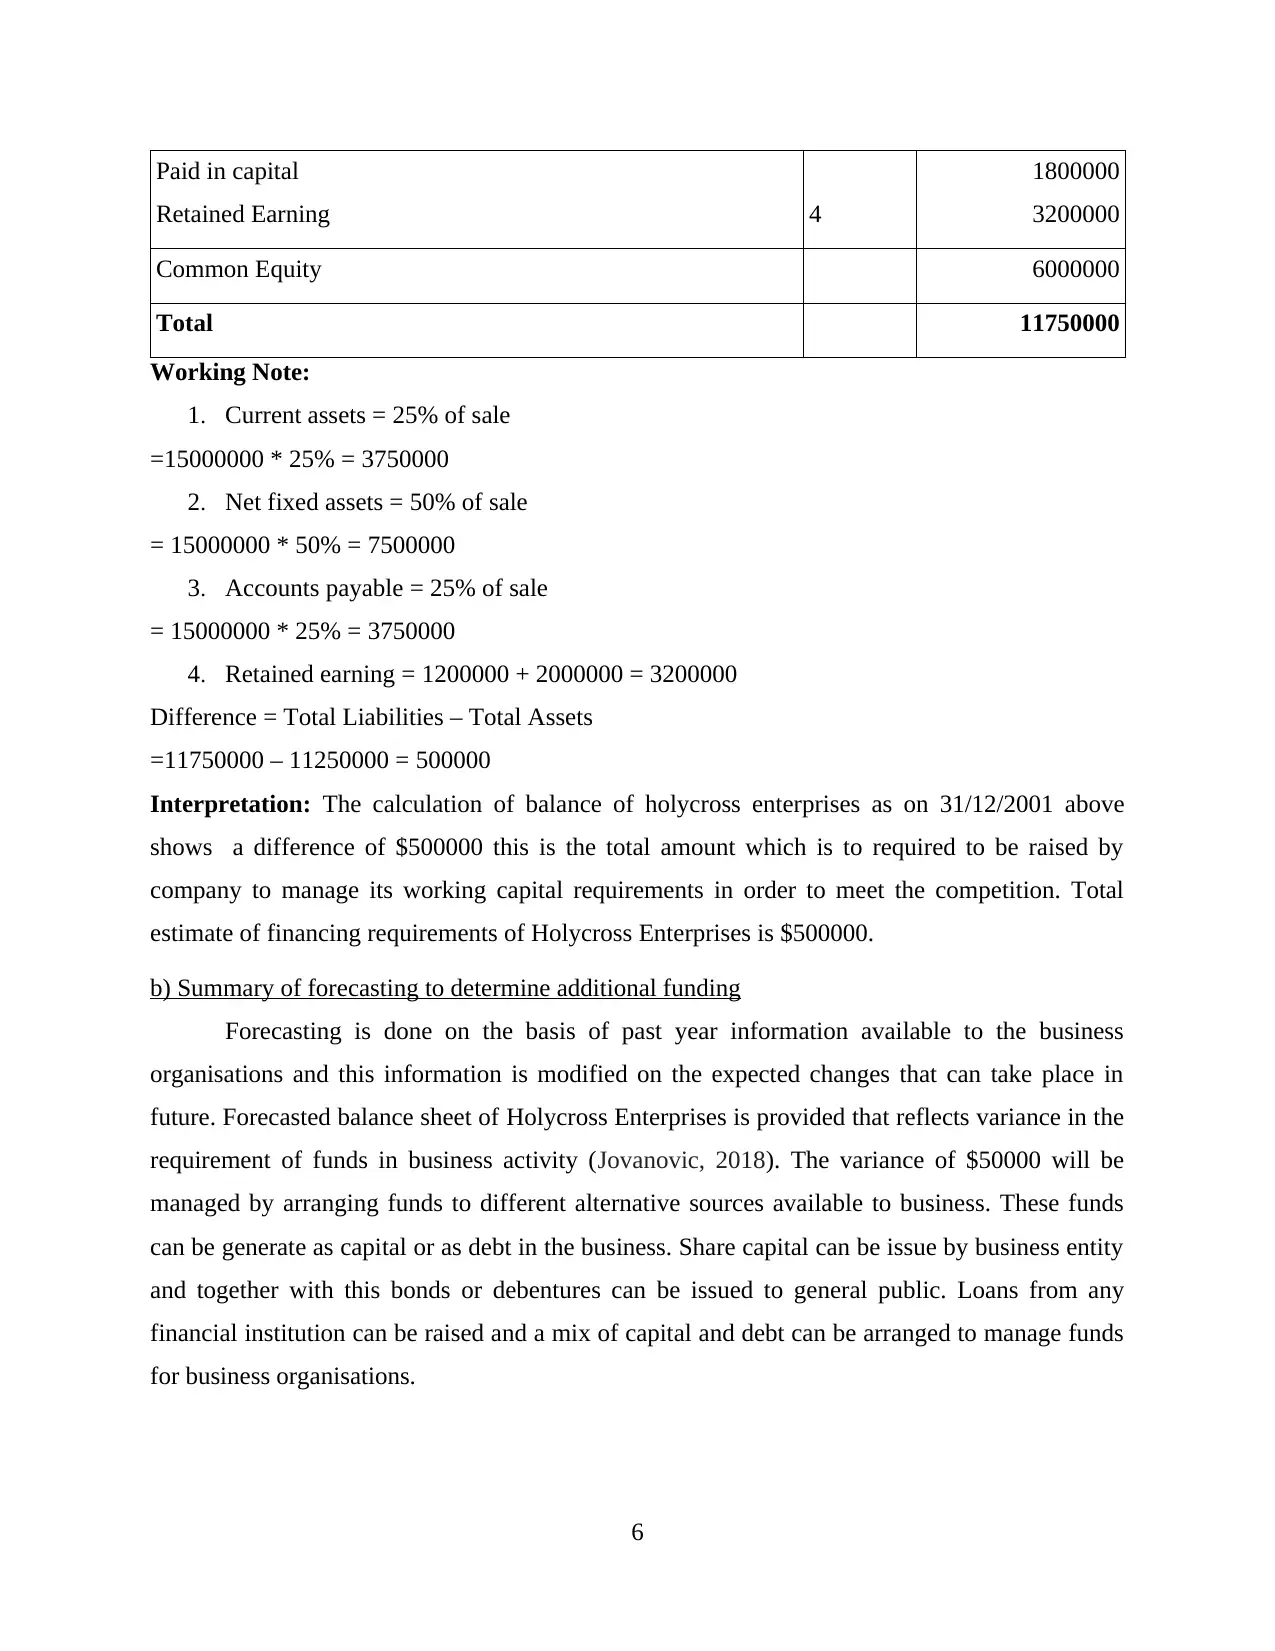
Paid in capital
Retained Earning 4
1800000
3200000
Common Equity 6000000
Total 11750000
Working Note:
1. Current assets = 25% of sale
=15000000 * 25% = 3750000
2. Net fixed assets = 50% of sale
= 15000000 * 50% = 7500000
3. Accounts payable = 25% of sale
= 15000000 * 25% = 3750000
4. Retained earning = 1200000 + 2000000 = 3200000
Difference = Total Liabilities – Total Assets
=11750000 – 11250000 = 500000
Interpretation: The calculation of balance of holycross enterprises as on 31/12/2001 above
shows a difference of $500000 this is the total amount which is to required to be raised by
company to manage its working capital requirements in order to meet the competition. Total
estimate of financing requirements of Holycross Enterprises is $500000.
b) Summary of forecasting to determine additional funding
Forecasting is done on the basis of past year information available to the business
organisations and this information is modified on the expected changes that can take place in
future. Forecasted balance sheet of Holycross Enterprises is provided that reflects variance in the
requirement of funds in business activity (Jovanovic, 2018). The variance of $50000 will be
managed by arranging funds to different alternative sources available to business. These funds
can be generate as capital or as debt in the business. Share capital can be issue by business entity
and together with this bonds or debentures can be issued to general public. Loans from any
financial institution can be raised and a mix of capital and debt can be arranged to manage funds
for business organisations.
6
QUESTION 4
a) Ratio calculations
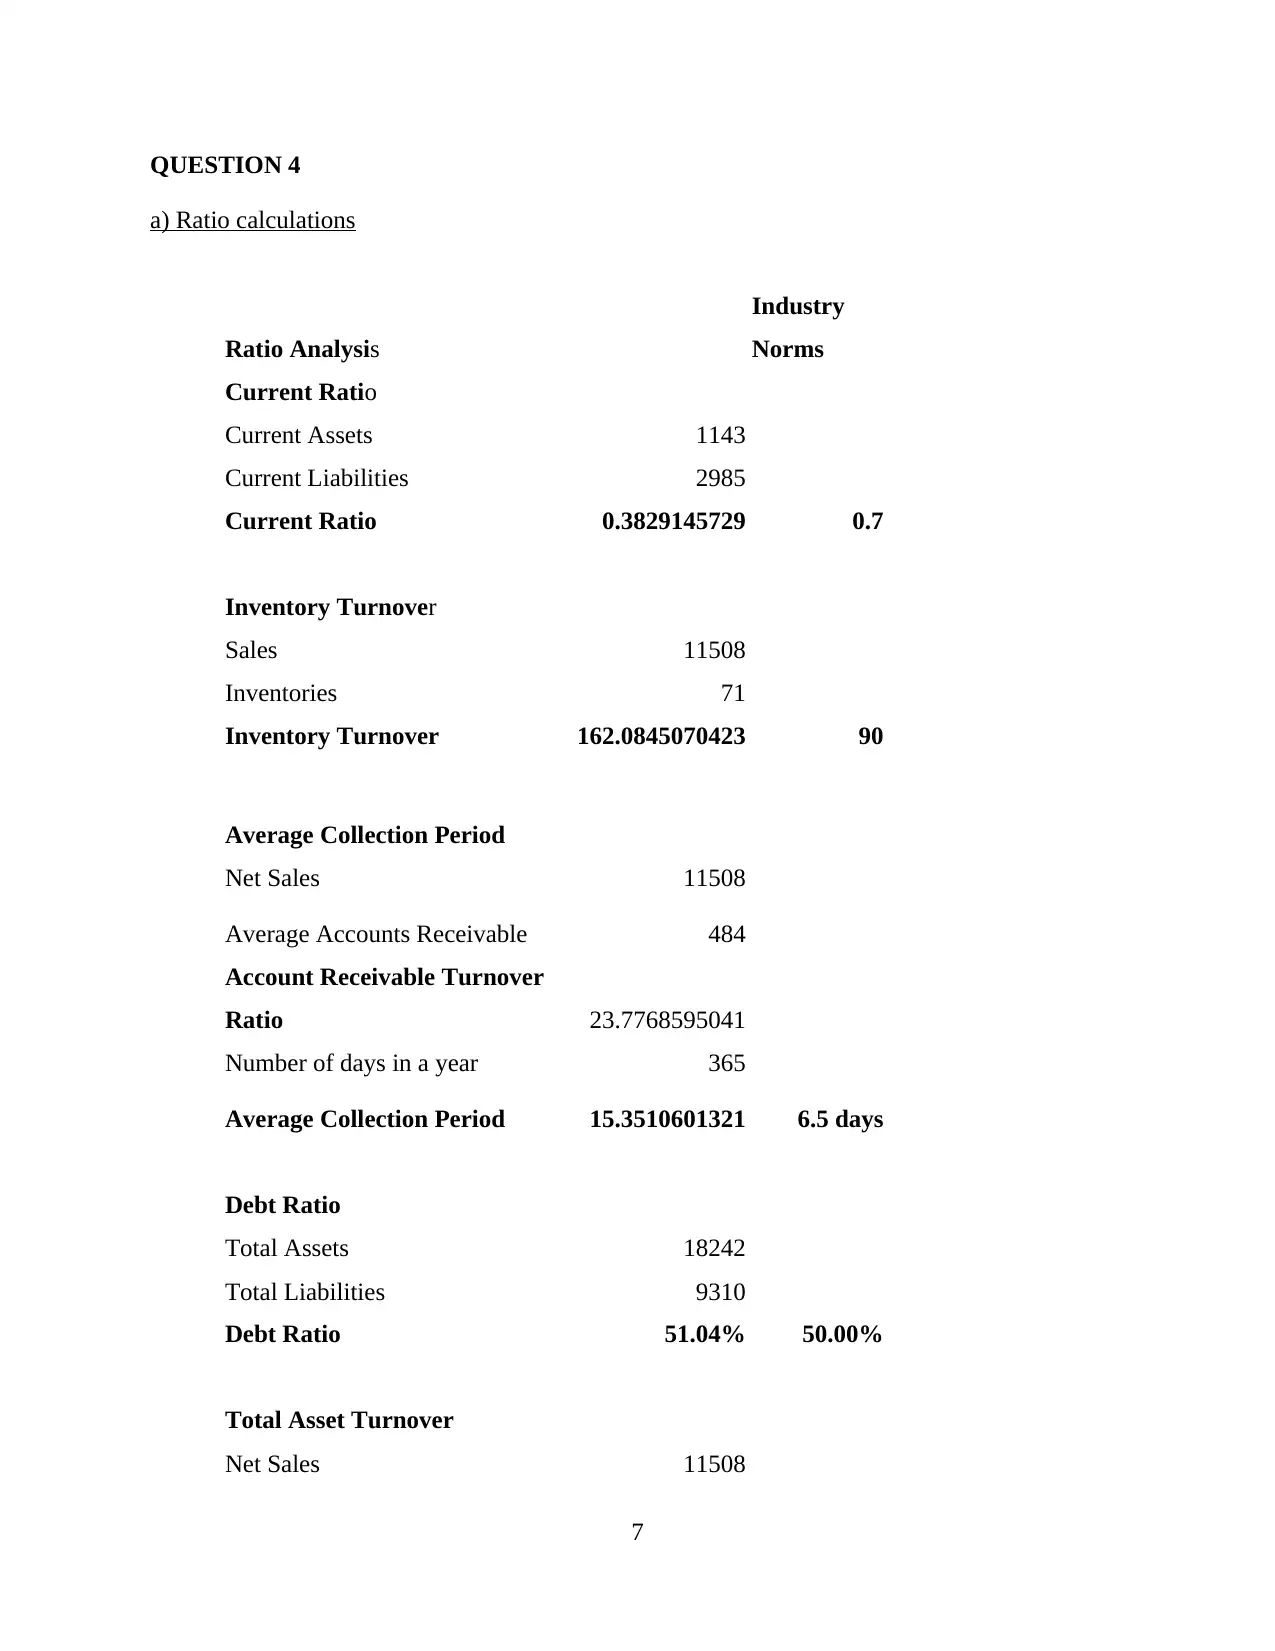
Ratio Analysis
Industry
Norms
Current Ratio
Current Assets 1143
Current Liabilities 2985
Current Ratio 0.3829145729 0.7
Inventory Turnover
Sales 11508
Inventories 71
Inventory Turnover 162.0845070423 90
Average Collection Period
Net Sales 11508
Average Accounts Receivable 484
Account Receivable Turnover
Ratio 23.7768595041
Number of days in a year 365
Average Collection Period 15.3510601321 6.5 days
Debt Ratio
Total Assets 18242
Total Liabilities 9310
Debt Ratio 51.04% 50.00%
Total Asset Turnover
Net Sales 11508
7
a) Ratio calculations
Ratio Analysis
Industry
Norms
Current Ratio
Current Assets 1143
Current Liabilities 2985
Current Ratio 0.3829145729 0.7
Inventory Turnover
Sales 11508
Inventories 71
Inventory Turnover 162.0845070423 90
Average Collection Period
Net Sales 11508
Average Accounts Receivable 484
Account Receivable Turnover
Ratio 23.7768595041
Number of days in a year 365
Average Collection Period 15.3510601321 6.5 days
Debt Ratio
Total Assets 18242
Total Liabilities 9310
Debt Ratio 51.04% 50.00%
Total Asset Turnover
Net Sales 11508
7
⊘ This is a preview!⊘
Do you want full access?
Subscribe today to unlock all pages.
Trusted by 1+ million students worldwide
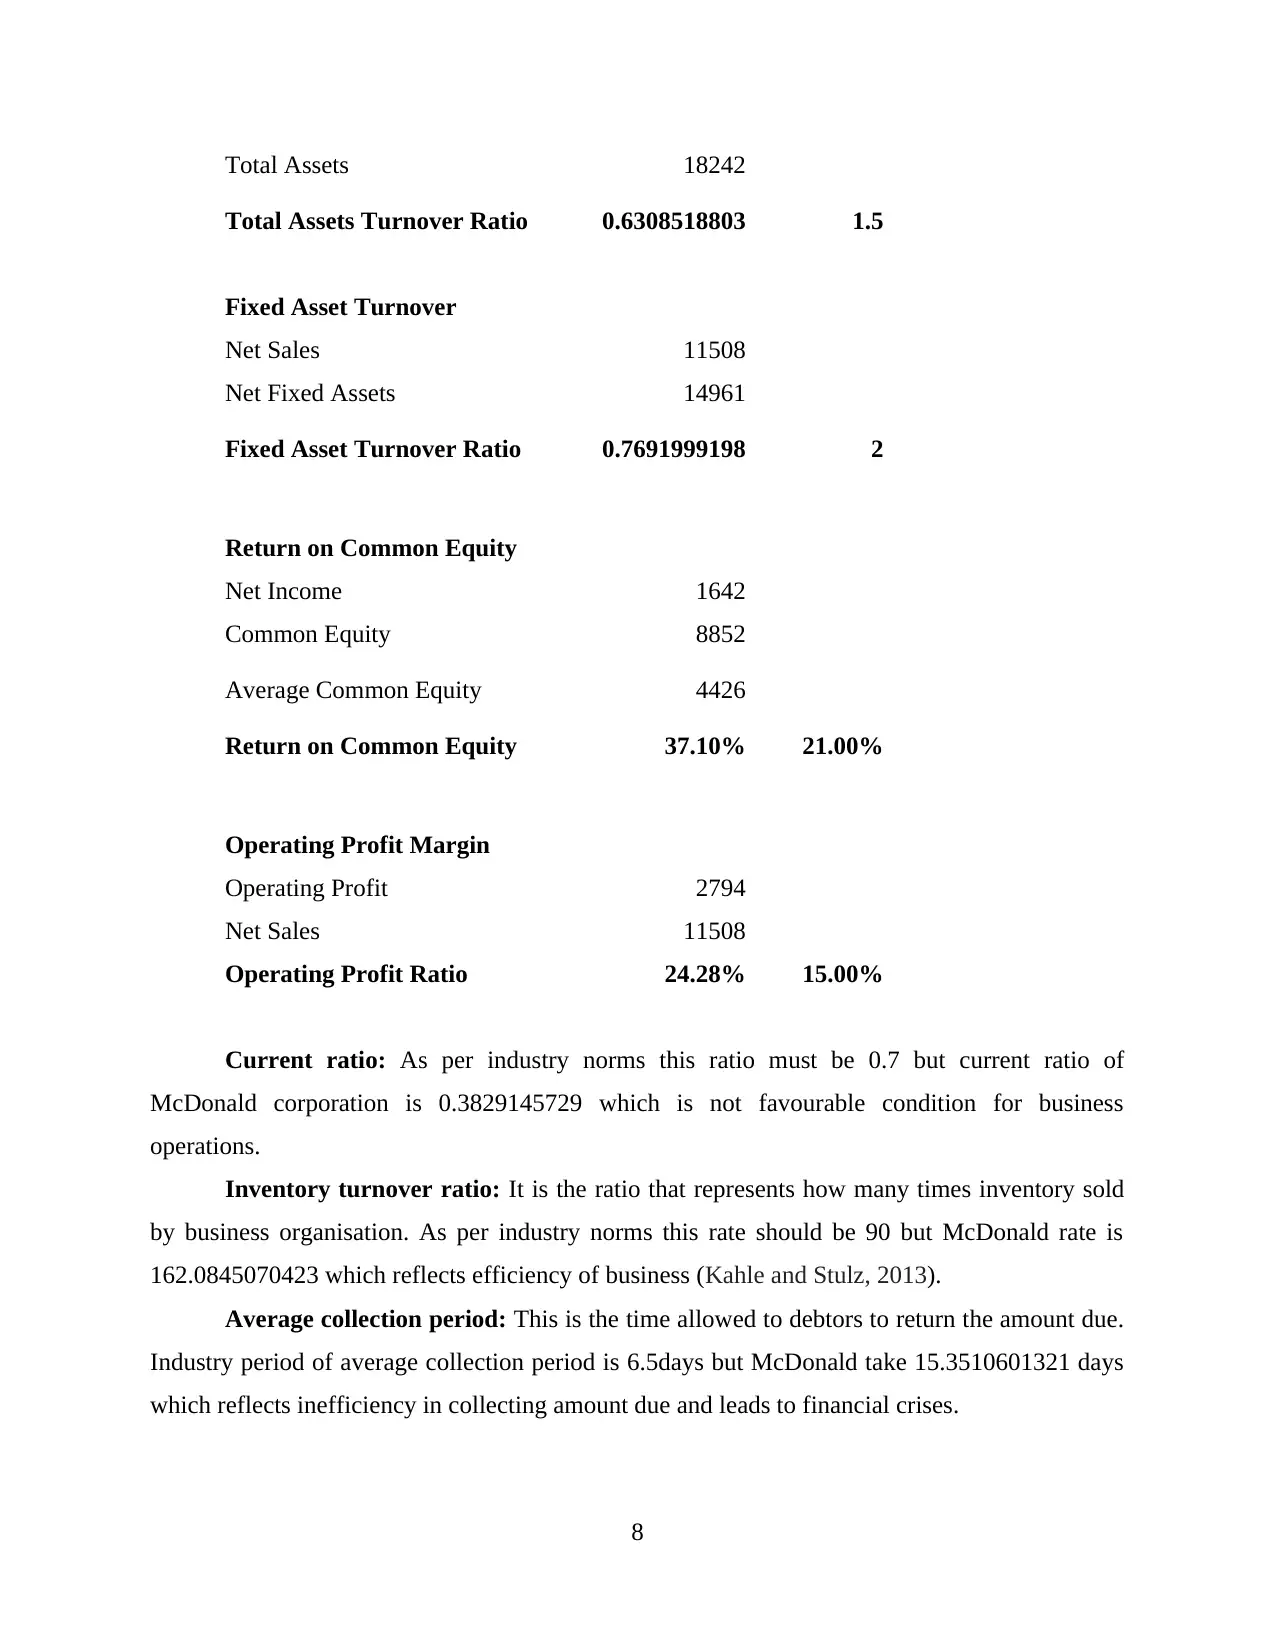
Total Assets 18242
Total Assets Turnover Ratio 0.6308518803 1.5
Fixed Asset Turnover
Net Sales 11508
Net Fixed Assets 14961
Fixed Asset Turnover Ratio 0.7691999198 2
Return on Common Equity
Net Income 1642
Common Equity 8852
Average Common Equity 4426
Return on Common Equity 37.10% 21.00%
Operating Profit Margin
Operating Profit 2794
Net Sales 11508
Operating Profit Ratio 24.28% 15.00%
Current ratio: As per industry norms this ratio must be 0.7 but current ratio of
McDonald corporation is 0.3829145729 which is not favourable condition for business
operations.
Inventory turnover ratio: It is the ratio that represents how many times inventory sold
by business organisation. As per industry norms this rate should be 90 but McDonald rate is
162.0845070423 which reflects efficiency of business (Kahle and Stulz, 2013).
Average collection period: This is the time allowed to debtors to return the amount due.
Industry period of average collection period is 6.5days but McDonald take 15.3510601321 days
which reflects inefficiency in collecting amount due and leads to financial crises.
8
Paraphrase This Document
Need a fresh take? Get an instant paraphrase of this document with our AI Paraphraser
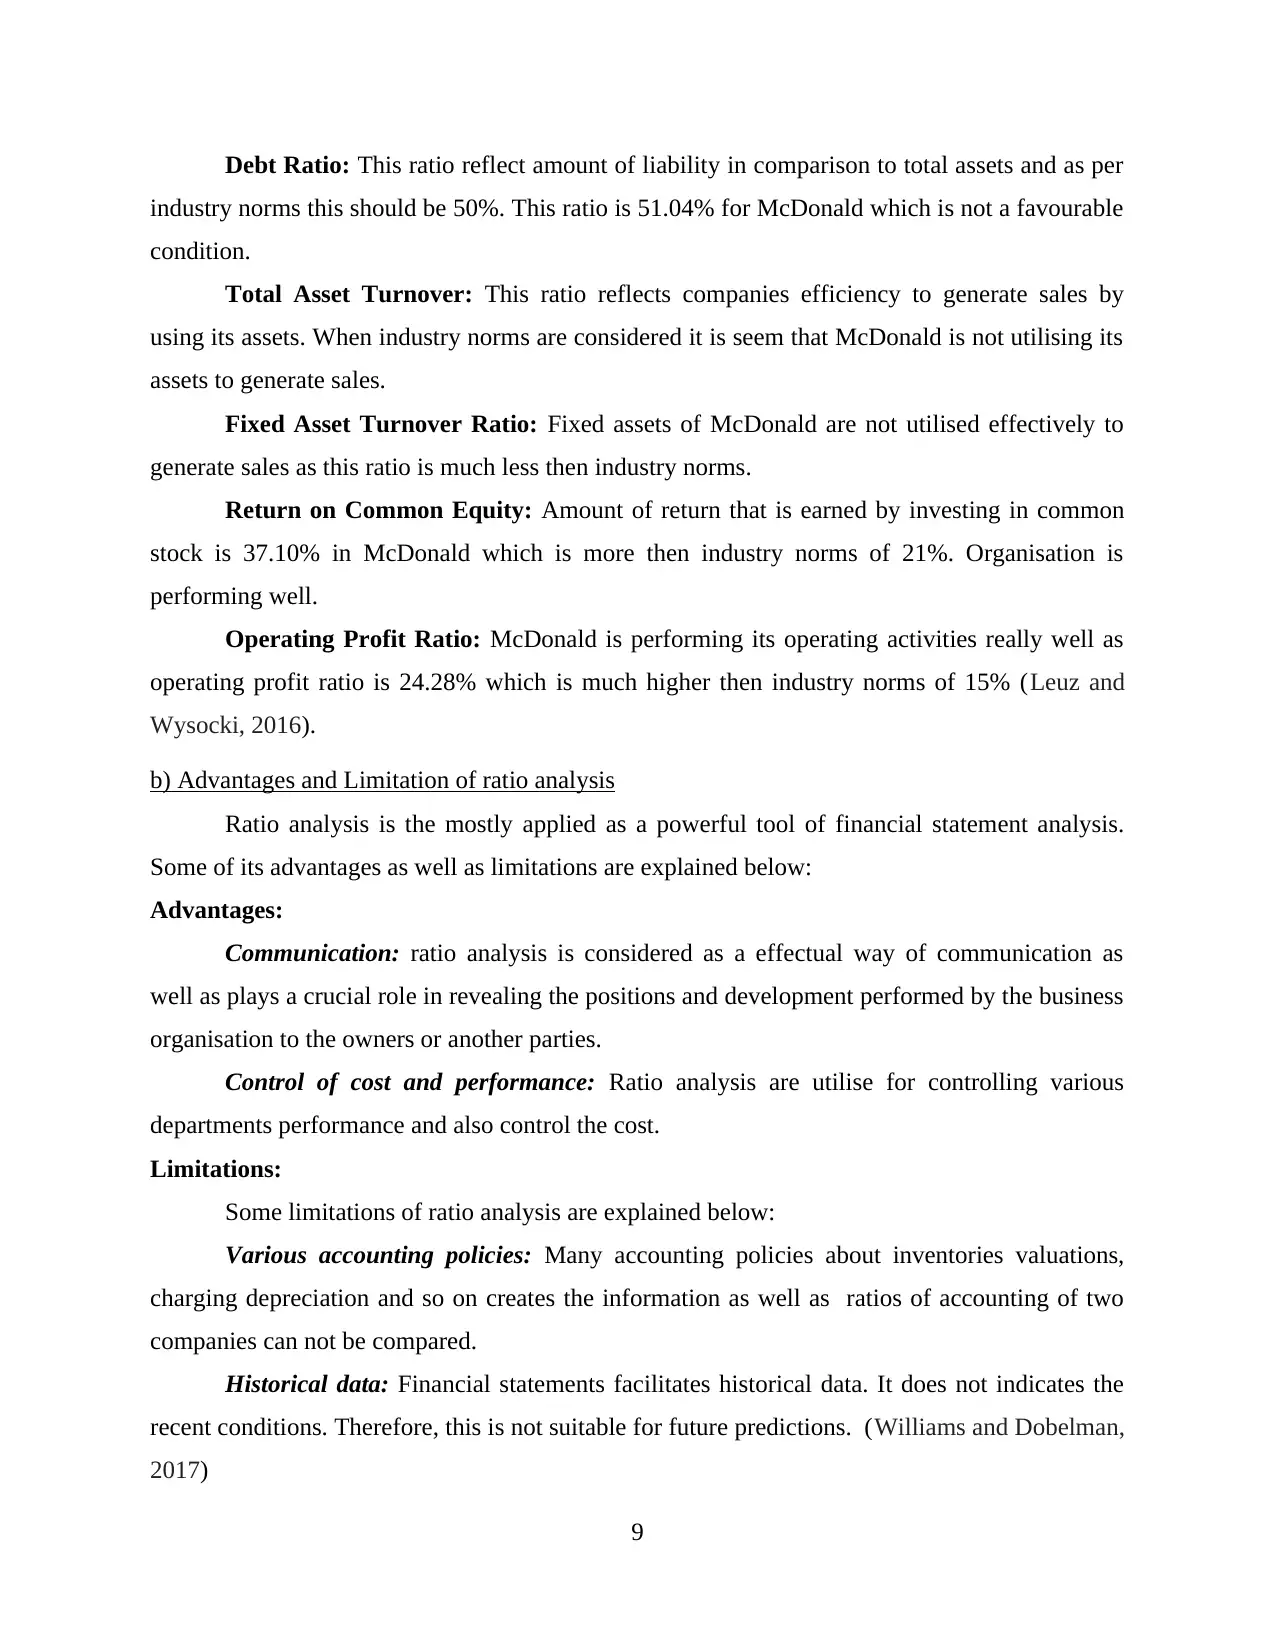
Debt Ratio: This ratio reflect amount of liability in comparison to total assets and as per
industry norms this should be 50%. This ratio is 51.04% for McDonald which is not a favourable
condition.
Total Asset Turnover: This ratio reflects companies efficiency to generate sales by
using its assets. When industry norms are considered it is seem that McDonald is not utilising its
assets to generate sales.
Fixed Asset Turnover Ratio: Fixed assets of McDonald are not utilised effectively to
generate sales as this ratio is much less then industry norms.
Return on Common Equity: Amount of return that is earned by investing in common
stock is 37.10% in McDonald which is more then industry norms of 21%. Organisation is
performing well.
Operating Profit Ratio: McDonald is performing its operating activities really well as
operating profit ratio is 24.28% which is much higher then industry norms of 15% (Leuz and
Wysocki, 2016).
b) Advantages and Limitation of ratio analysis
Ratio analysis is the mostly applied as a powerful tool of financial statement analysis.
Some of its advantages as well as limitations are explained below:
Advantages:
Communication: ratio analysis is considered as a effectual way of communication as
well as plays a crucial role in revealing the positions and development performed by the business
organisation to the owners or another parties.
Control of cost and performance: Ratio analysis are utilise for controlling various
departments performance and also control the cost.
Limitations:
Some limitations of ratio analysis are explained below:
Various accounting policies: Many accounting policies about inventories valuations,
charging depreciation and so on creates the information as well as ratios of accounting of two
companies can not be compared.
Historical data: Financial statements facilitates historical data. It does not indicates the
recent conditions. Therefore, this is not suitable for future predictions. (Williams and Dobelman,
2017)
9
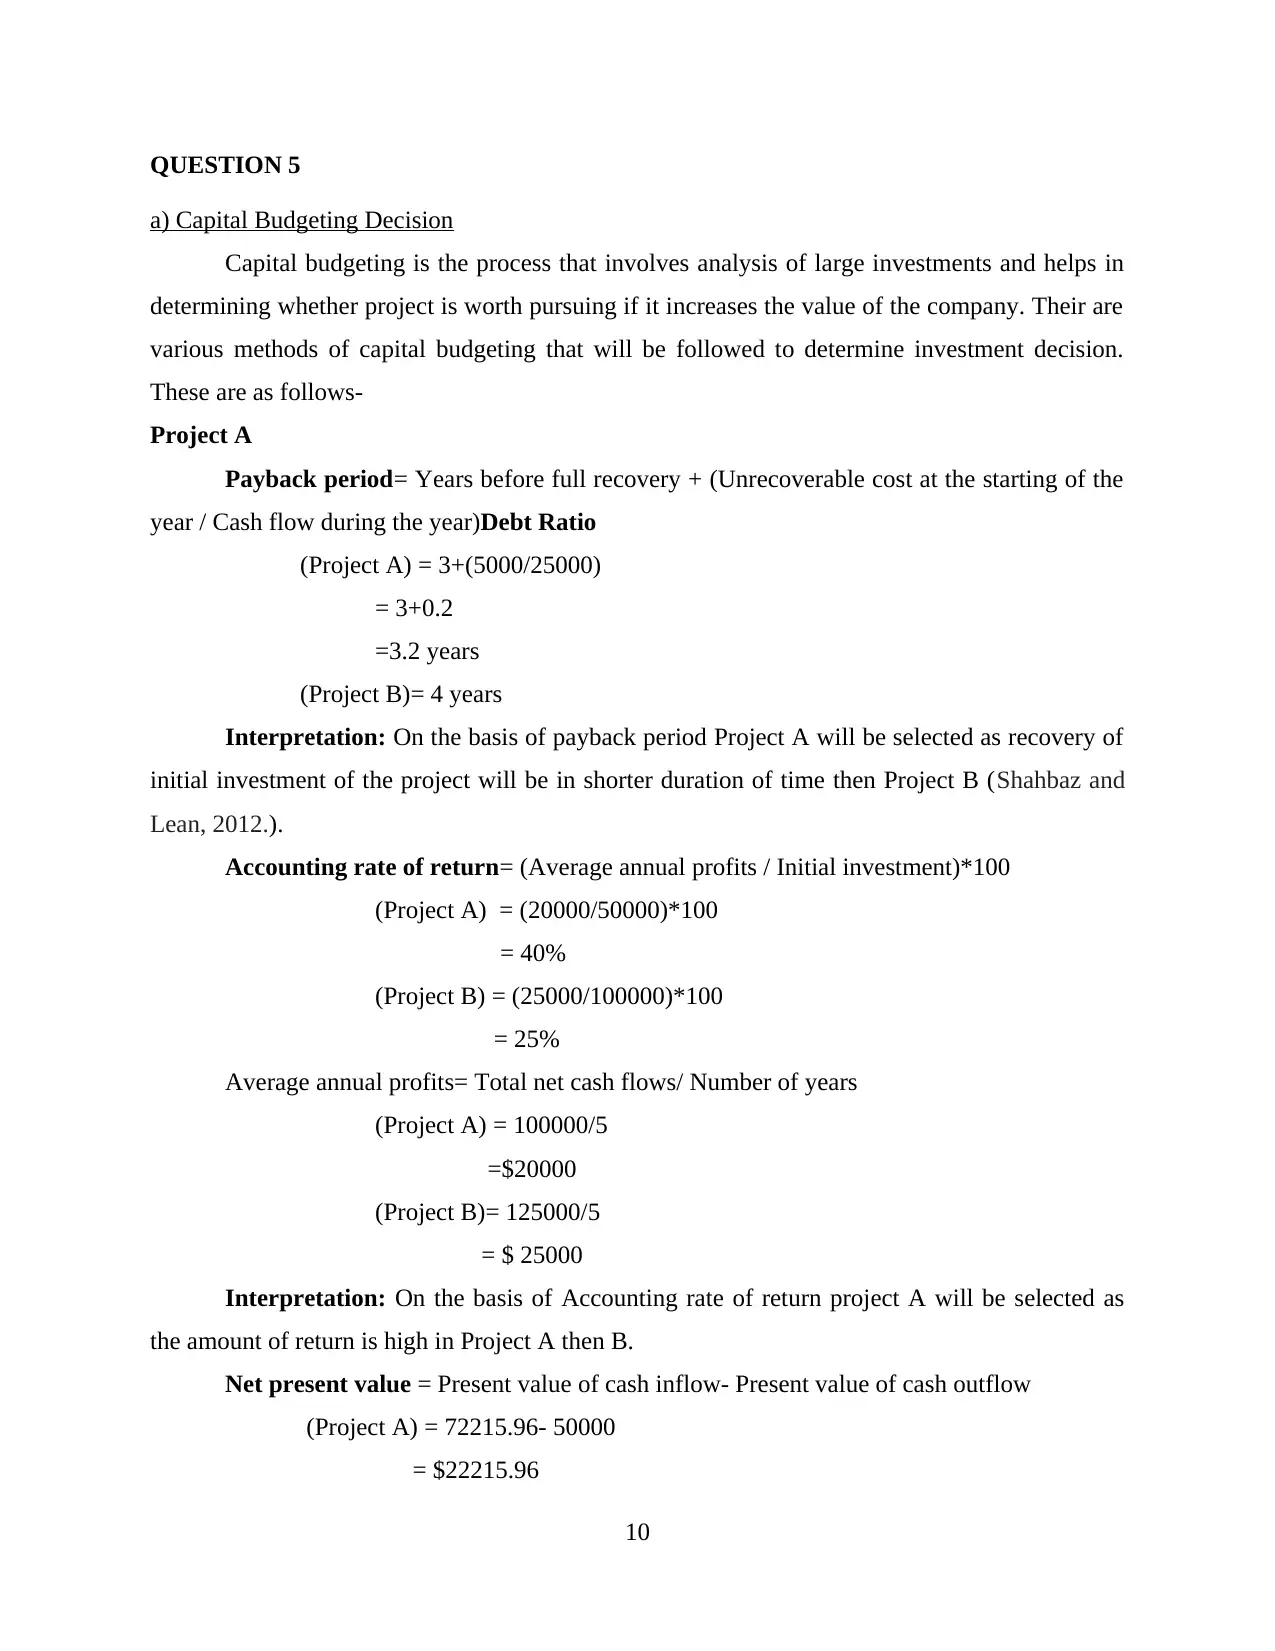
QUESTION 5
a) Capital Budgeting Decision
Capital budgeting is the process that involves analysis of large investments and helps in
determining whether project is worth pursuing if it increases the value of the company. Their are
various methods of capital budgeting that will be followed to determine investment decision.
These are as follows-
Project A
Payback period= Years before full recovery + (Unrecoverable cost at the starting of the
year / Cash flow during the year)Debt Ratio
(Project A) = 3+(5000/25000)
= 3+0.2
=3.2 years
(Project B)= 4 years
Interpretation: On the basis of payback period Project A will be selected as recovery of
initial investment of the project will be in shorter duration of time then Project B (Shahbaz and
Lean, 2012.).
Accounting rate of return= (Average annual profits / Initial investment)*100
(Project A) = (20000/50000)*100
= 40%
(Project B) = (25000/100000)*100
= 25%
Average annual profits= Total net cash flows/ Number of years
(Project A) = 100000/5
=$20000
(Project B)= 125000/5
= $ 25000
Interpretation: On the basis of Accounting rate of return project A will be selected as
the amount of return is high in Project A then B.
Net present value = Present value of cash inflow- Present value of cash outflow
(Project A) = 72215.96- 50000
= $22215.96
10
⊘ This is a preview!⊘
Do you want full access?
Subscribe today to unlock all pages.
Trusted by 1+ million students worldwide
1 out of 17
Related Documents


Your All-in-One AI-Powered Toolkit for Academic Success.
+13062052269
info@desklib.com
Available 24*7 on WhatsApp / Email
![[object Object]](/_next/static/media/star-bottom.7253800d.svg)
Unlock your academic potential
Copyright © 2020–2026 A2Z Services. All Rights Reserved. Developed and managed by ZUCOL.