Finance Report: Financial Analysis, Risk Assessment and Strategy
VerifiedAdded on 2020/04/21
|14
|1716
|51
Report
AI Summary
This finance report presents a detailed analysis of a company's financial performance, encompassing various aspects such as cash flow, net present value (NPV), asset management efficiency, short-term solvency, financial leverage, profitability, and share market performance. The report includes calculations for NPV, Weighted Average Cost of Capital (WACC), and stock valuation, offering insights into the viability of investments and the pricing of stocks. It also assesses risks, including currency exchange rate fluctuations, and recommends hedging strategies to mitigate potential losses. Furthermore, the report evaluates different financing options, including bank loans and share investments, and provides critical assessments of financial statements and corporate capital structures. The analysis covers key financial ratios, solvency conditions, and share market performance metrics, providing a comprehensive overview of the company's financial health and strategic recommendations.
Running head: FINANCE
Finance
Name of the Student:
Name of the University:
Authors Note:
Finance
Name of the Student:
Name of the University:
Authors Note:
Paraphrase This Document
Need a fresh take? Get an instant paraphrase of this document with our AI Paraphraser
1
FINANCE
Table of Contents
Question 1:.................................................................................................................................3
a. Cash flow of the project:........................................................................................................3
b. Calculating NPV of the project:.............................................................................................4
c. Depicting viability of the purchase of new ship:....................................................................4
Question 2:.................................................................................................................................5
a. Commenting the performance of each company in relation to the category analysis:...........5
i. Asset management efficiency:................................................................................................5
ii. Short term solvency:..............................................................................................................6
iii. Financial leverage:................................................................................................................6
iv. Profitability:..........................................................................................................................7
v. Share market performance:....................................................................................................8
b. Depicting whether loan to AA company could be provided by Sydney bank:......................8
Question 3:.................................................................................................................................8
a. Explaining the source of finance for the company to raise money:.......................................8
b. Evaluating the advantages and disadvantages of each investment option:............................9
c. Critically evaluating the statement regarding corporate capital:............................................9
Question 4:...............................................................................................................................10
Identifying and explaining the risk faced by company specific instruments use control the
risks:.........................................................................................................................................10
Question 5:...............................................................................................................................10
Depicting the best strategy for the company to avoid receiving least amount A$ by hedging
the exchange rate:.....................................................................................................................10
Question 6:...............................................................................................................................11
Calculating WACC of the company:.......................................................................................11

2
FINANCE
Question 7:...............................................................................................................................12
Depicting whether the stock is overpriced underpriced and correctly priced:.........................12
Reference and Bibliography:....................................................................................................13
⊘ This is a preview!⊘
Do you want full access?
Subscribe today to unlock all pages.
Trusted by 1+ million students worldwide
3
FINANCE
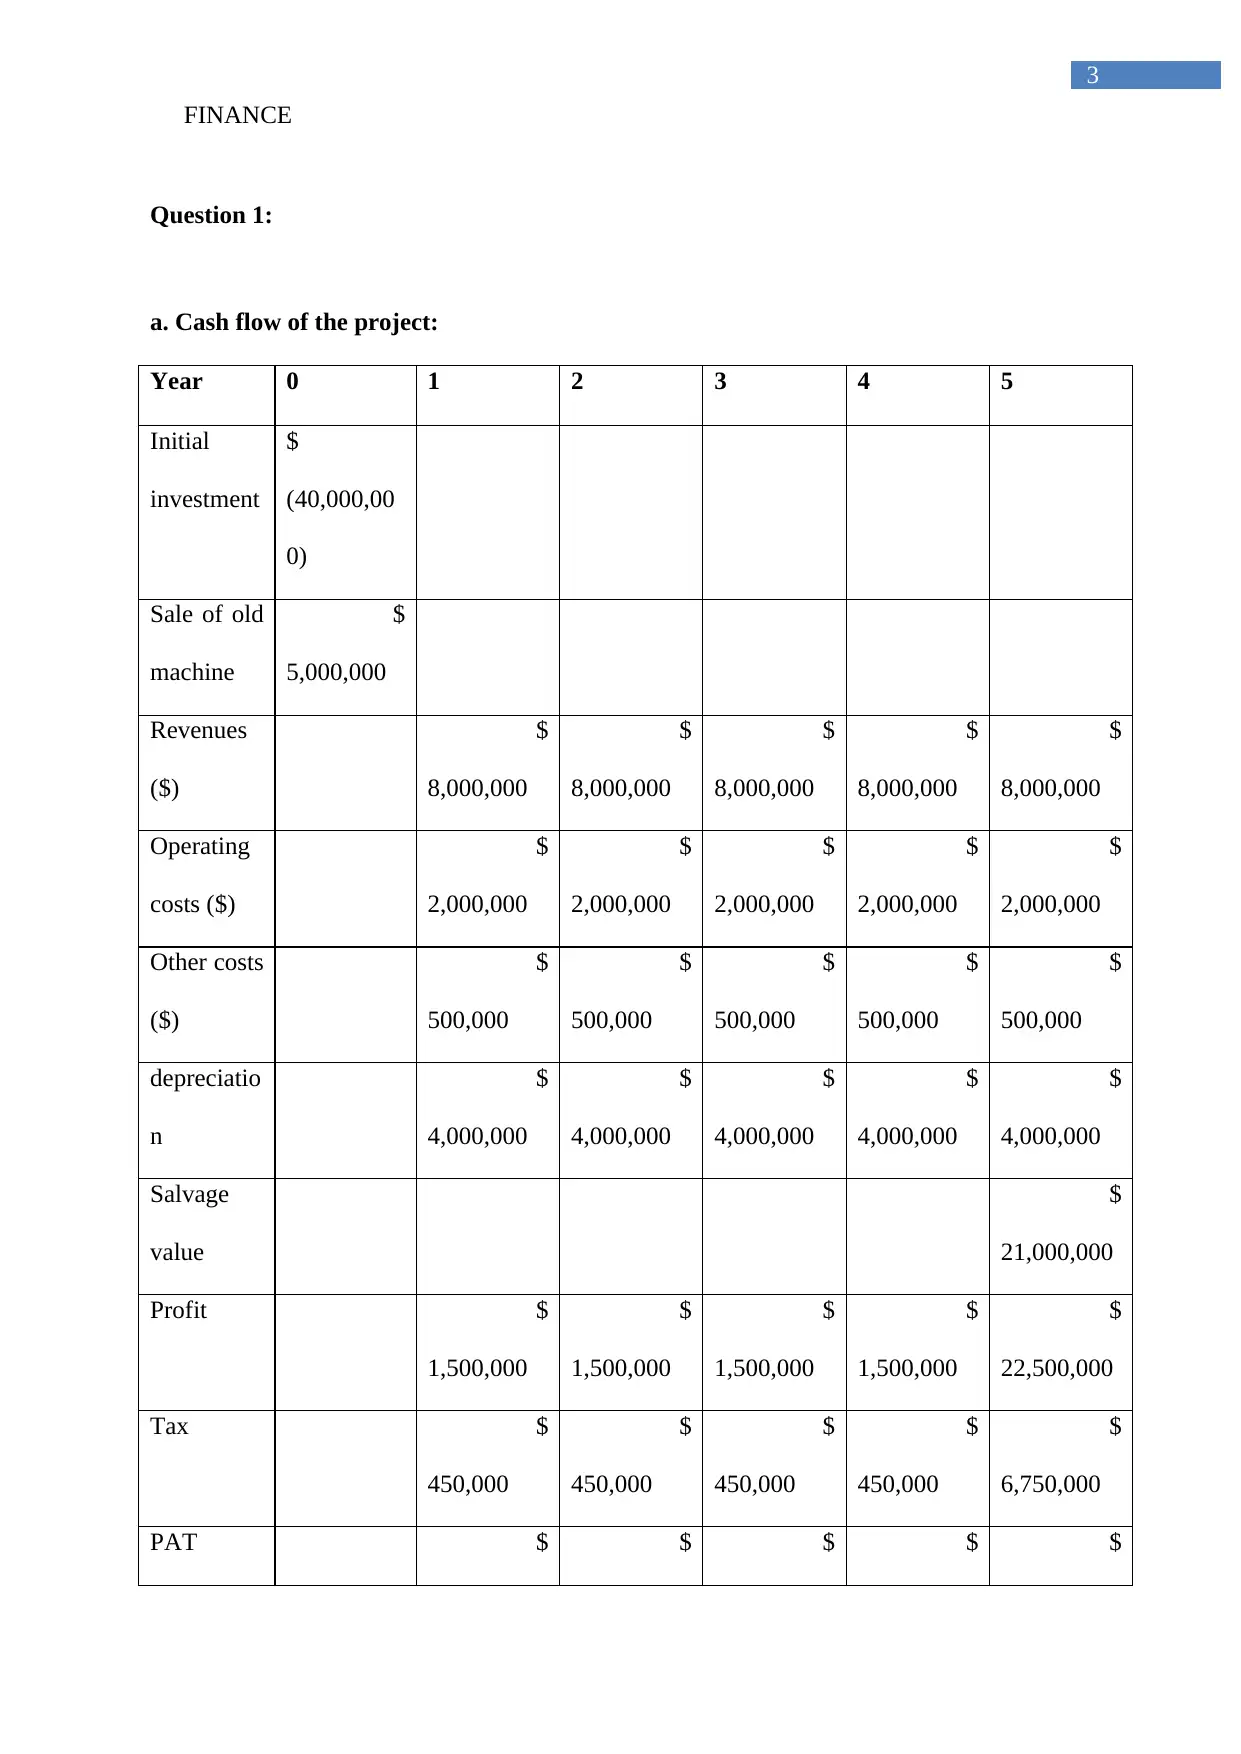
Question 1:
a. Cash flow of the project:
Year 0 1 2 3 4 5
Initial
investment
$
(40,000,00
0)
Sale of old
machine
$
5,000,000
Revenues
($)
$
8,000,000
$
8,000,000
$
8,000,000
$
8,000,000
$
8,000,000
Operating
costs ($)
$
2,000,000
$
2,000,000
$
2,000,000
$
2,000,000
$
2,000,000
Other costs
($)
$
500,000
$
500,000
$
500,000
$
500,000
$
500,000
depreciatio
n
$
4,000,000
$
4,000,000
$
4,000,000
$
4,000,000
$
4,000,000
Salvage
value
$
21,000,000
Profit $
1,500,000
$
1,500,000
$
1,500,000
$
1,500,000
$
22,500,000
Tax $
450,000
$
450,000
$
450,000
$
450,000
$
6,750,000
PAT $ $ $ $ $
FINANCE
Question 1:
a. Cash flow of the project:
Year 0 1 2 3 4 5
Initial
investment
$
(40,000,00
0)
Sale of old
machine
$
5,000,000
Revenues
($)
$
8,000,000
$
8,000,000
$
8,000,000
$
8,000,000
$
8,000,000
Operating
costs ($)
$
2,000,000
$
2,000,000
$
2,000,000
$
2,000,000
$
2,000,000
Other costs
($)
$
500,000
$
500,000
$
500,000
$
500,000
$
500,000
depreciatio
n
$
4,000,000
$
4,000,000
$
4,000,000
$
4,000,000
$
4,000,000
Salvage
value
$
21,000,000
Profit $
1,500,000
$
1,500,000
$
1,500,000
$
1,500,000
$
22,500,000
Tax $
450,000
$
450,000
$
450,000
$
450,000
$
6,750,000
PAT $ $ $ $ $
Paraphrase This Document
Need a fresh take? Get an instant paraphrase of this document with our AI Paraphraser
4
FINANCE
1,050,000 1,050,000 1,050,000 1,050,000 15,750,000
Cash flow $
(35,000,00
0)
$
5,050,000
$
5,050,000
$
5,050,000
$
5,050,000
$
19,750,000
Discounte
d cash
flow
$
0.87
$
0.76
$
0.66
$
0.57
$
0.50
$
4,391,304.3
5
$
3,818,525.5
2
$
3,320,456.9
7
$
2,887,353.8
9
$
9,819,240.5
2
NPV $ (10,763,118.75)
NPV $ (10,763,118.75)
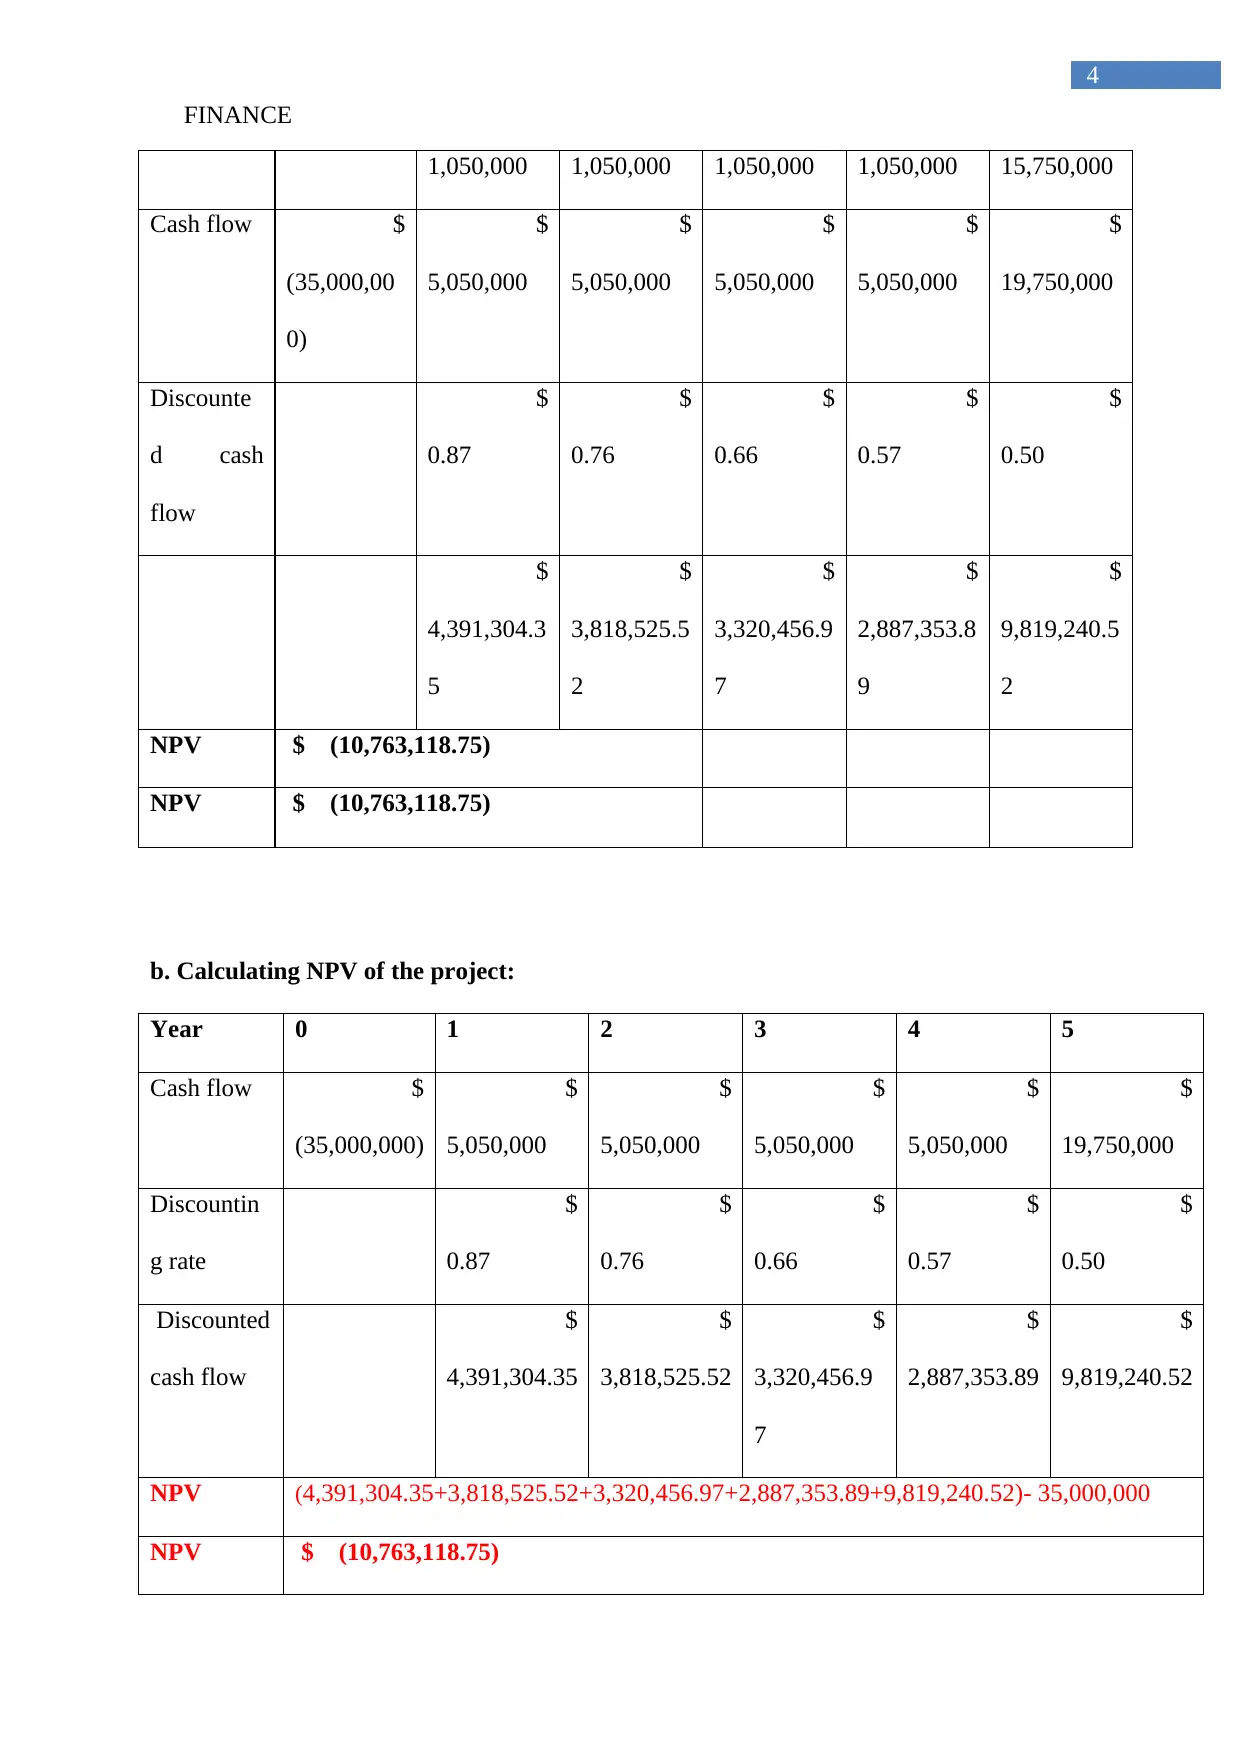
b. Calculating NPV of the project:
Year 0 1 2 3 4 5
Cash flow $
(35,000,000)
$
5,050,000
$
5,050,000
$
5,050,000
$
5,050,000
$
19,750,000
Discountin
g rate
$
0.87
$
0.76
$
0.66
$
0.57
$
0.50
Discounted
cash flow
$
4,391,304.35
$
3,818,525.52
$
3,320,456.9
7
$
2,887,353.89
$
9,819,240.52
NPV (4,391,304.35+3,818,525.52+3,320,456.97+2,887,353.89+9,819,240.52)- 35,000,000
NPV $ (10,763,118.75)
FINANCE
1,050,000 1,050,000 1,050,000 1,050,000 15,750,000
Cash flow $
(35,000,00
0)
$
5,050,000
$
5,050,000
$
5,050,000
$
5,050,000
$
19,750,000
Discounte
d cash
flow
$
0.87
$
0.76
$
0.66
$
0.57
$
0.50
$
4,391,304.3
5
$
3,818,525.5
2
$
3,320,456.9
7
$
2,887,353.8
9
$
9,819,240.5
2
NPV $ (10,763,118.75)
NPV $ (10,763,118.75)
b. Calculating NPV of the project:
Year 0 1 2 3 4 5
Cash flow $
(35,000,000)
$
5,050,000
$
5,050,000
$
5,050,000
$
5,050,000
$
19,750,000
Discountin
g rate
$
0.87
$
0.76
$
0.66
$
0.57
$
0.50
Discounted
cash flow
$
4,391,304.35
$
3,818,525.52
$
3,320,456.9
7
$
2,887,353.89
$
9,819,240.52
NPV (4,391,304.35+3,818,525.52+3,320,456.97+2,887,353.89+9,819,240.52)- 35,000,000
NPV $ (10,763,118.75)
5
FINANCE
c. Depicting viability of the purchase of new ship:
The overall NPV of the propjet is relatively negative, which directly indicates that the
company will not accept to invest in the new ship.
Question 2:
a. Commenting the performance of each company in relation to the category analysis:
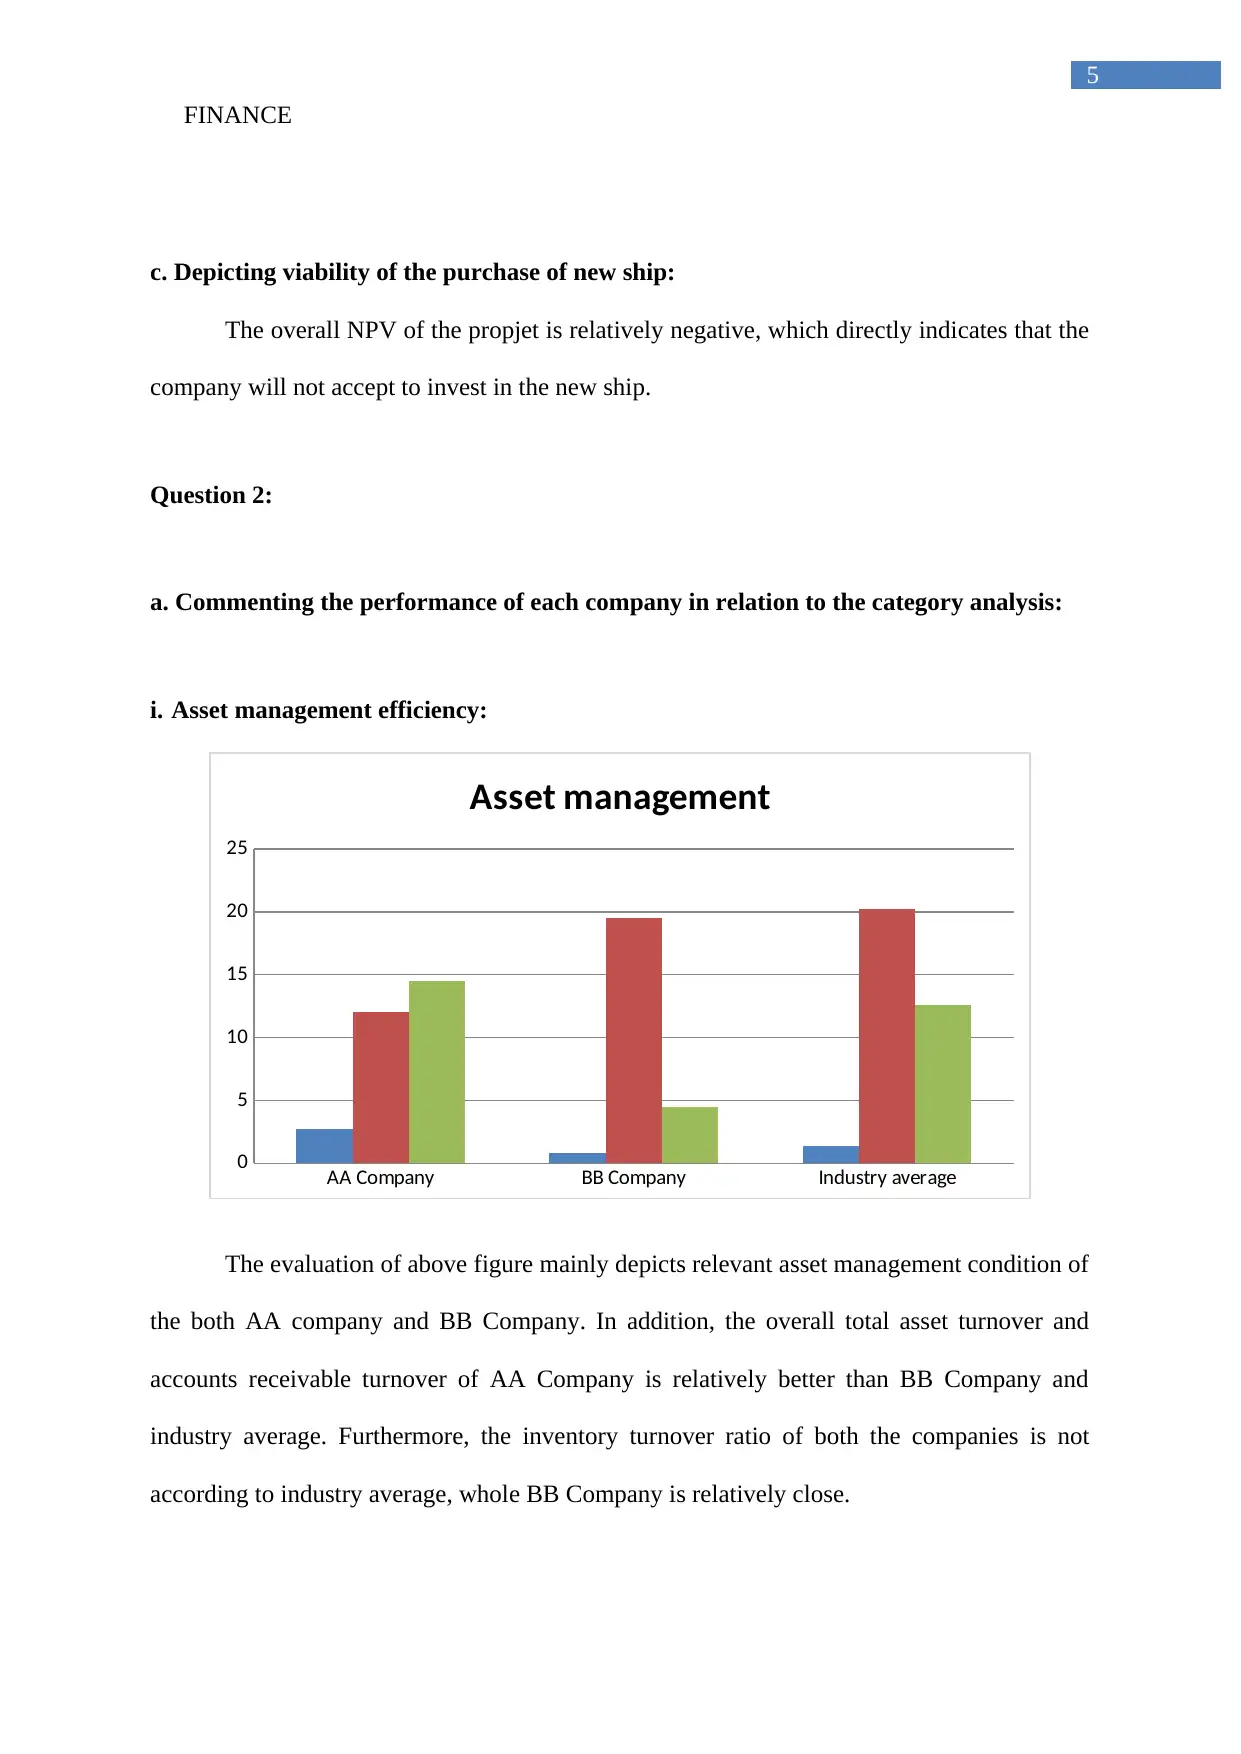
i. Asset management efficiency:
AA Company BB Company Industry average
0
5
10
15
20
25
Asset management
The evaluation of above figure mainly depicts relevant asset management condition of
the both AA company and BB Company. In addition, the overall total asset turnover and
accounts receivable turnover of AA Company is relatively better than BB Company and
industry average. Furthermore, the inventory turnover ratio of both the companies is not
according to industry average, whole BB Company is relatively close.
FINANCE
c. Depicting viability of the purchase of new ship:
The overall NPV of the propjet is relatively negative, which directly indicates that the
company will not accept to invest in the new ship.
Question 2:
a. Commenting the performance of each company in relation to the category analysis:
i. Asset management efficiency:
AA Company BB Company Industry average
0
5
10
15
20
25
Asset management
The evaluation of above figure mainly depicts relevant asset management condition of
the both AA company and BB Company. In addition, the overall total asset turnover and
accounts receivable turnover of AA Company is relatively better than BB Company and
industry average. Furthermore, the inventory turnover ratio of both the companies is not
according to industry average, whole BB Company is relatively close.
⊘ This is a preview!⊘
Do you want full access?
Subscribe today to unlock all pages.
Trusted by 1+ million students worldwide
6
FINANCE
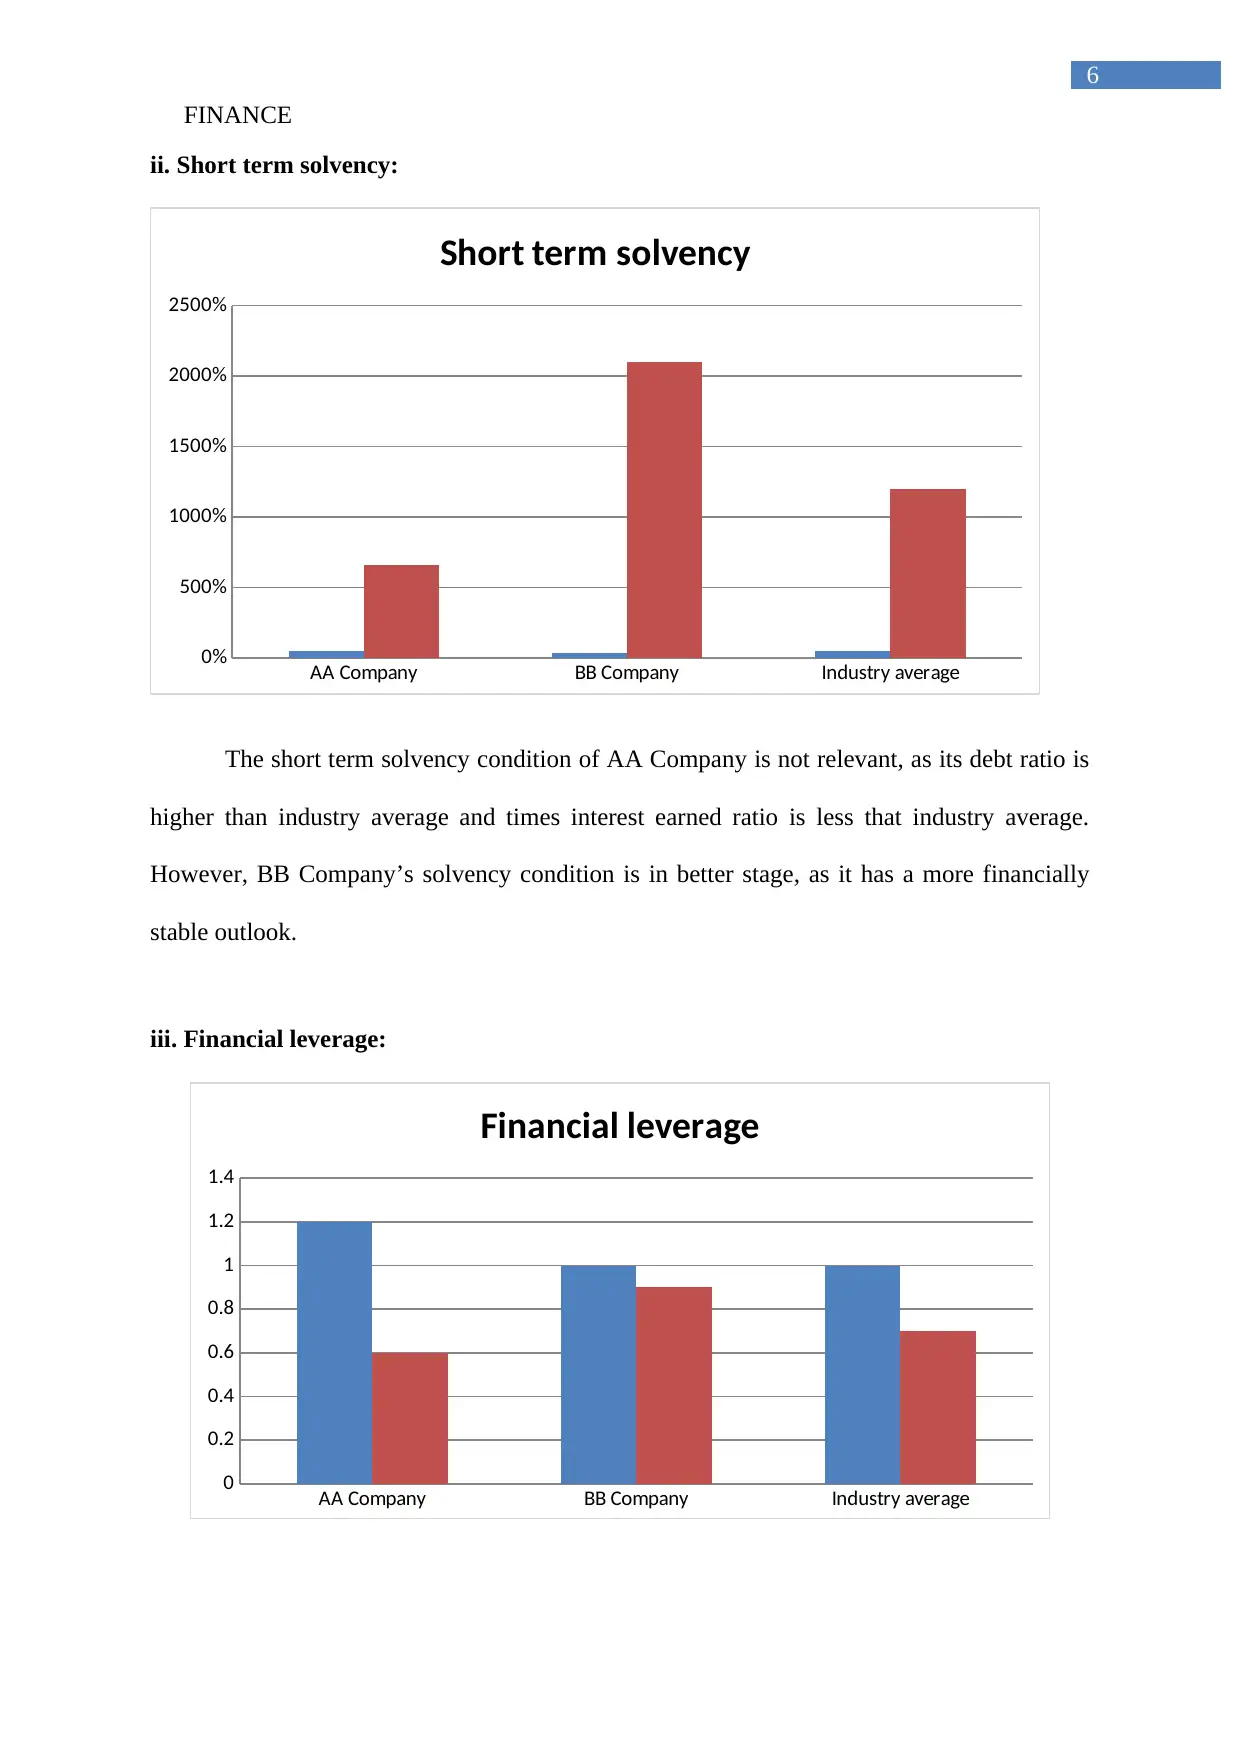
ii. Short term solvency:
AA Company BB Company Industry average
0%
500%
1000%
1500%
2000%
2500%
Short term solvency
The short term solvency condition of AA Company is not relevant, as its debt ratio is
higher than industry average and times interest earned ratio is less that industry average.
However, BB Company’s solvency condition is in better stage, as it has a more financially
stable outlook.
iii. Financial leverage:
AA Company BB Company Industry average
0
0.2
0.4
0.6
0.8
1
1.2
1.4
Financial leverage
FINANCE
ii. Short term solvency:
AA Company BB Company Industry average
0%
500%
1000%
1500%
2000%
2500%
Short term solvency
The short term solvency condition of AA Company is not relevant, as its debt ratio is
higher than industry average and times interest earned ratio is less that industry average.
However, BB Company’s solvency condition is in better stage, as it has a more financially
stable outlook.
iii. Financial leverage:
AA Company BB Company Industry average
0
0.2
0.4
0.6
0.8
1
1.2
1.4
Financial leverage
Paraphrase This Document
Need a fresh take? Get an instant paraphrase of this document with our AI Paraphraser
7
FINANCE
Mover, the current ratio of AA Company is better than industry average, while the
quick ratio is not adequate to industry average, which indicates the high inventory
accumulation conducted by the company. On the other hand the BB Company’s overall
current ratio is same as industry average, while the quick ratio is relatively higher indicating
the low accumulation of inventory conducted by the company.
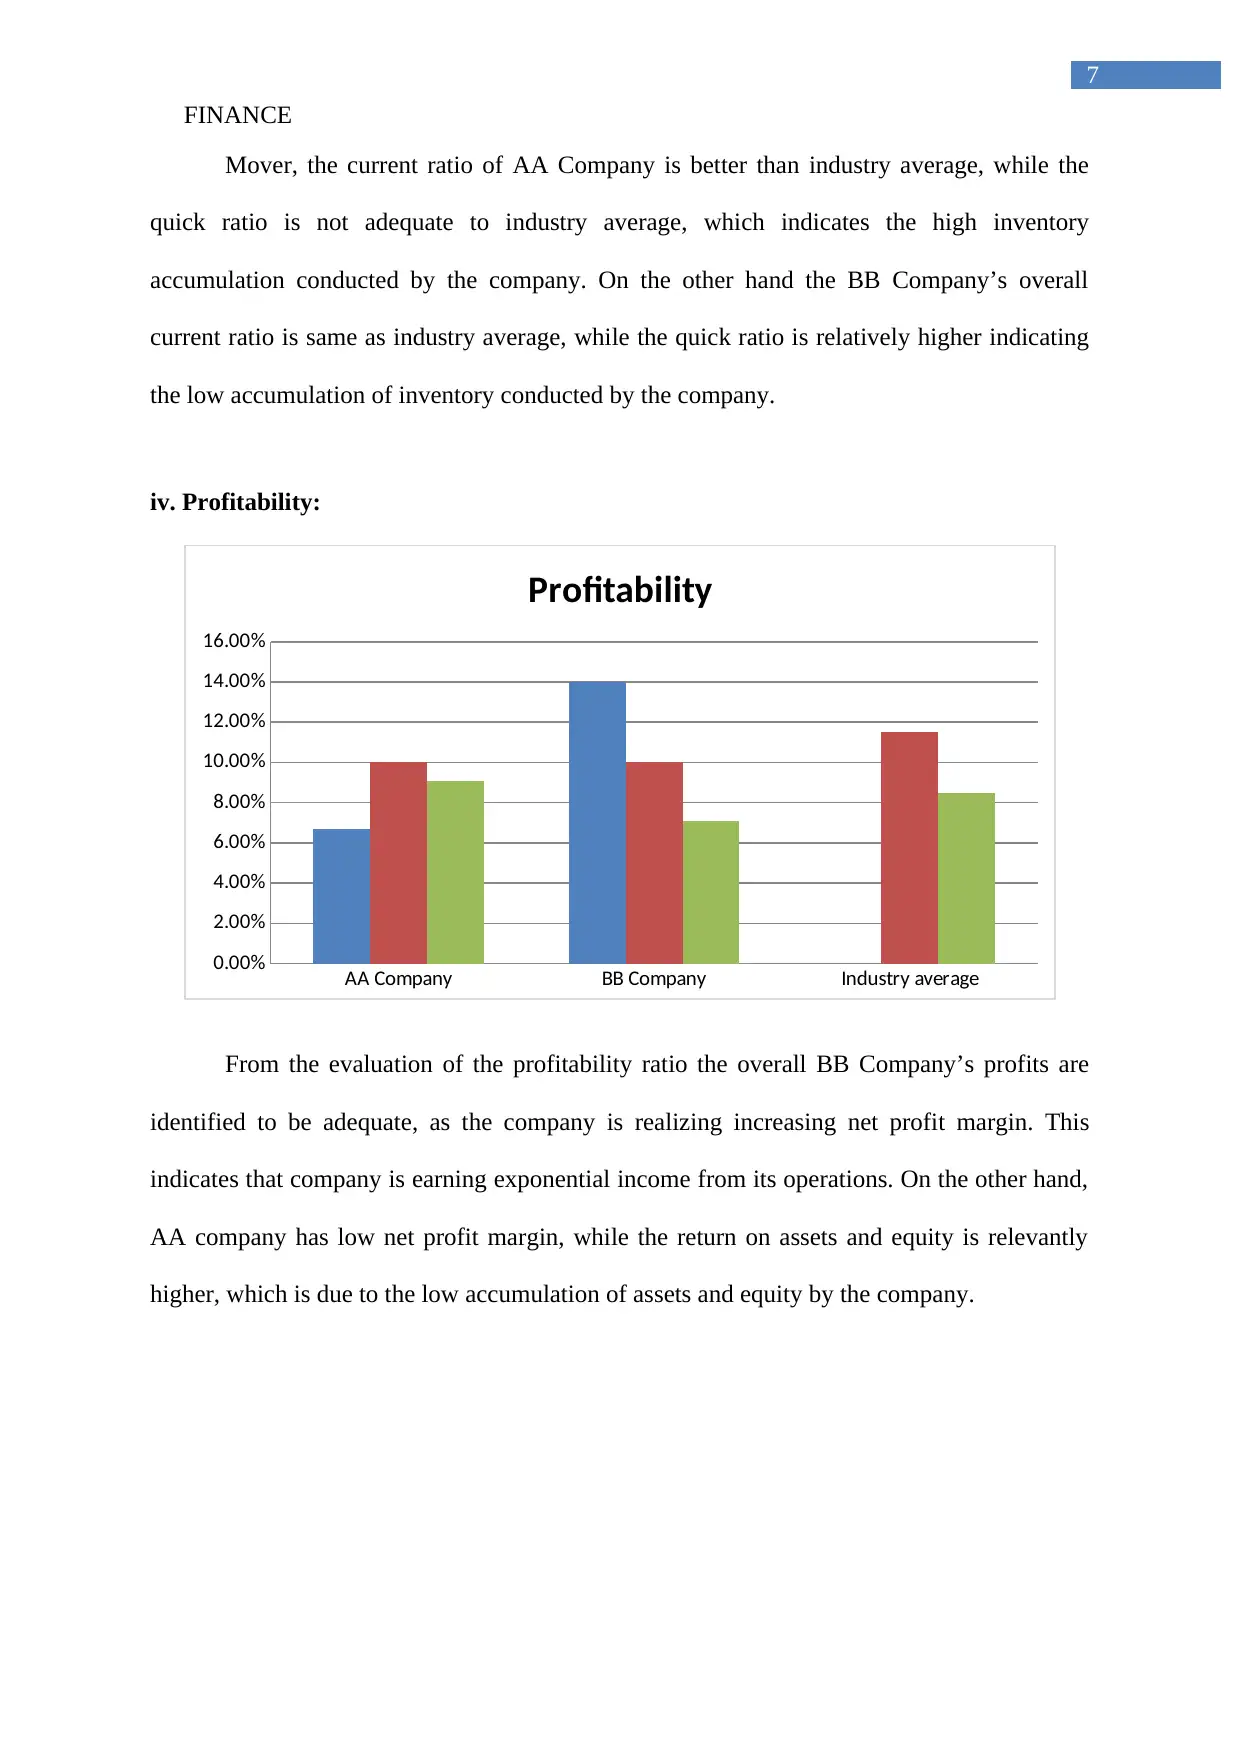
iv. Profitability:
AA Company BB Company Industry average
0.00%
2.00%
4.00%
6.00%
8.00%
10.00%
12.00%
14.00%
16.00%
Profitability
From the evaluation of the profitability ratio the overall BB Company’s profits are
identified to be adequate, as the company is realizing increasing net profit margin. This
indicates that company is earning exponential income from its operations. On the other hand,
AA company has low net profit margin, while the return on assets and equity is relevantly
higher, which is due to the low accumulation of assets and equity by the company.
FINANCE
Mover, the current ratio of AA Company is better than industry average, while the
quick ratio is not adequate to industry average, which indicates the high inventory
accumulation conducted by the company. On the other hand the BB Company’s overall
current ratio is same as industry average, while the quick ratio is relatively higher indicating
the low accumulation of inventory conducted by the company.
iv. Profitability:
AA Company BB Company Industry average
0.00%
2.00%
4.00%
6.00%
8.00%
10.00%
12.00%
14.00%
16.00%
Profitability
From the evaluation of the profitability ratio the overall BB Company’s profits are
identified to be adequate, as the company is realizing increasing net profit margin. This
indicates that company is earning exponential income from its operations. On the other hand,
AA company has low net profit margin, while the return on assets and equity is relevantly
higher, which is due to the low accumulation of assets and equity by the company.
8
FINANCE
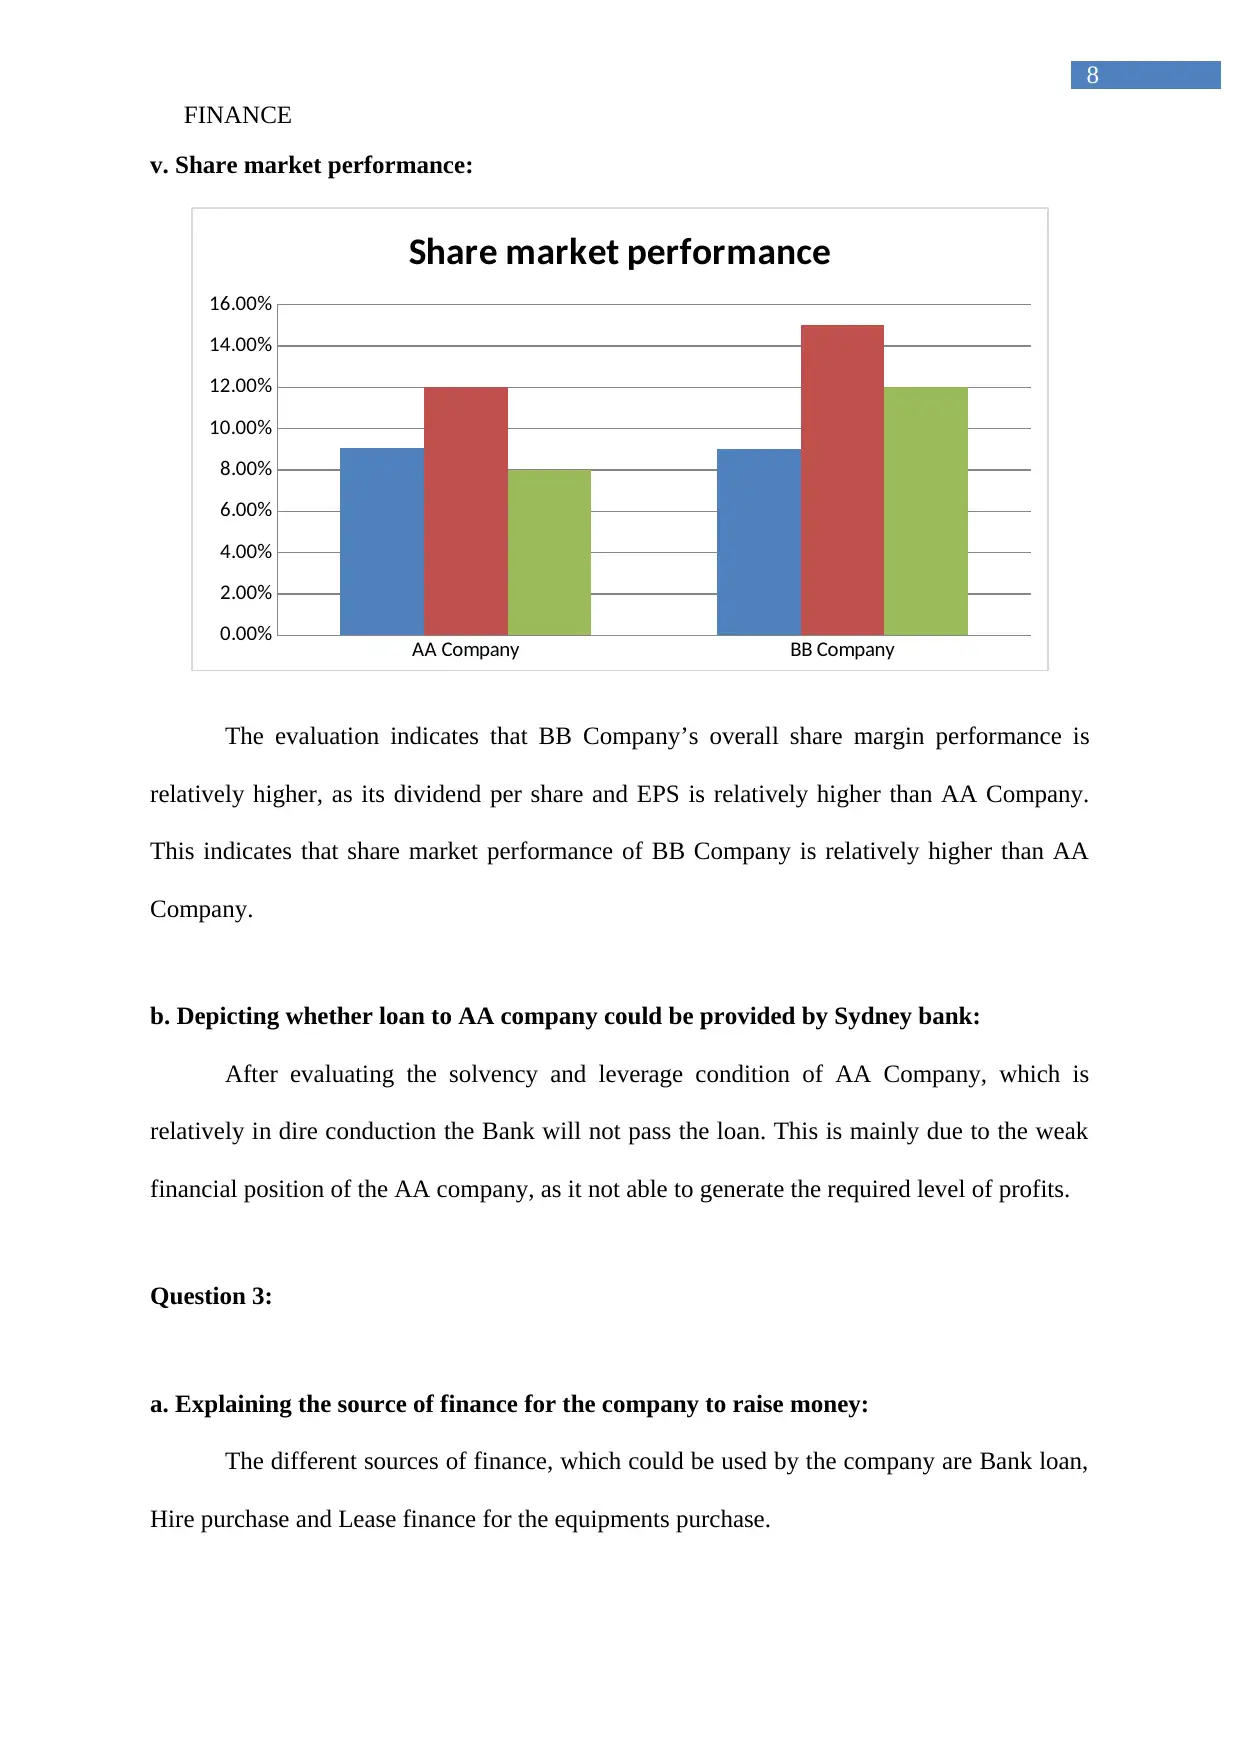
v. Share market performance:
AA Company BB Company
0.00%
2.00%
4.00%
6.00%
8.00%
10.00%
12.00%
14.00%
16.00%
Share market performance
The evaluation indicates that BB Company’s overall share margin performance is
relatively higher, as its dividend per share and EPS is relatively higher than AA Company.
This indicates that share market performance of BB Company is relatively higher than AA
Company.
b. Depicting whether loan to AA company could be provided by Sydney bank:
After evaluating the solvency and leverage condition of AA Company, which is
relatively in dire conduction the Bank will not pass the loan. This is mainly due to the weak
financial position of the AA company, as it not able to generate the required level of profits.
Question 3:
a. Explaining the source of finance for the company to raise money:
The different sources of finance, which could be used by the company are Bank loan,
Hire purchase and Lease finance for the equipments purchase.
FINANCE
v. Share market performance:
AA Company BB Company
0.00%
2.00%
4.00%
6.00%
8.00%
10.00%
12.00%
14.00%
16.00%
Share market performance
The evaluation indicates that BB Company’s overall share margin performance is
relatively higher, as its dividend per share and EPS is relatively higher than AA Company.
This indicates that share market performance of BB Company is relatively higher than AA
Company.
b. Depicting whether loan to AA company could be provided by Sydney bank:
After evaluating the solvency and leverage condition of AA Company, which is
relatively in dire conduction the Bank will not pass the loan. This is mainly due to the weak
financial position of the AA company, as it not able to generate the required level of profits.
Question 3:
a. Explaining the source of finance for the company to raise money:
The different sources of finance, which could be used by the company are Bank loan,
Hire purchase and Lease finance for the equipments purchase.
⊘ This is a preview!⊘
Do you want full access?
Subscribe today to unlock all pages.
Trusted by 1+ million students worldwide
9
FINANCE
b. Evaluating the advantages and disadvantages of each investment option:
Investment in shares:
Investment in shares could mainly provide higher return from investment, whereas the
risk is relatively higher due to volatile capital market.
Lodging a fixed deposit at a bank:
The fixed deposit at bank could provide a steady low income from investment,
whereas there is a limitation, which directly blocks the capital for the fixed tenure and cannot
be used for another investment.
Purchase of commercial bills:
Purchase of commercial bills could eventually help in generating high level of return
from investment, whereas the risk is relatively higher as it is an unsecured promissory note,
whose payment assurance is not guaranteed.
c. Critically evaluating the statement regarding corporate capital:
The statement mainly depicts the use of higher debt and low equity allows the
organisation to reduce the overall cash outflow in form of tax. This relevant increment in the
debt could allow the company to get exceptions from tax and reduce the overall cash outflow
of the organisation.
Paraphrase This Document
Need a fresh take? Get an instant paraphrase of this document with our AI Paraphraser
10
FINANCE
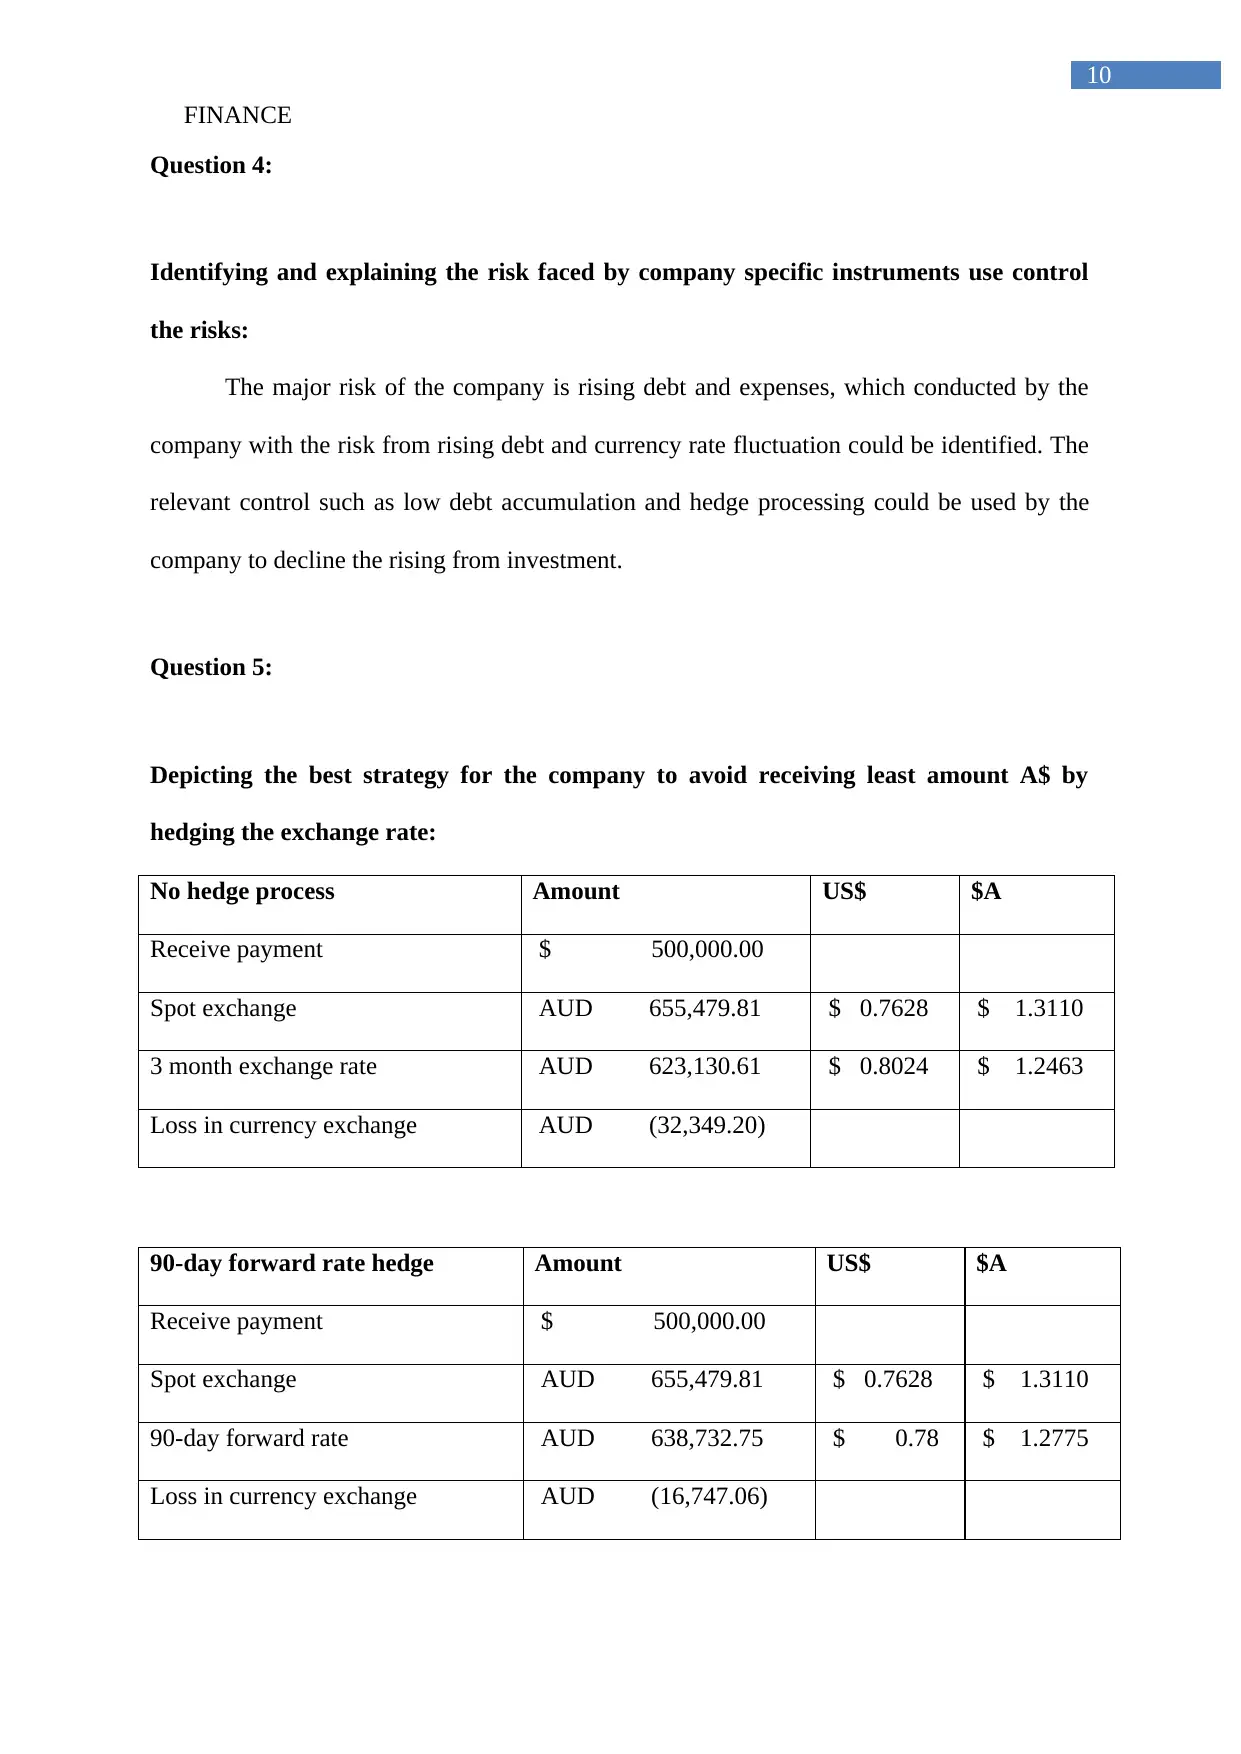
Question 4:
Identifying and explaining the risk faced by company specific instruments use control
the risks:
The major risk of the company is rising debt and expenses, which conducted by the
company with the risk from rising debt and currency rate fluctuation could be identified. The
relevant control such as low debt accumulation and hedge processing could be used by the
company to decline the rising from investment.
Question 5:
Depicting the best strategy for the company to avoid receiving least amount A$ by
hedging the exchange rate:
No hedge process Amount US$ $A
Receive payment $ 500,000.00
Spot exchange AUD 655,479.81 $ 0.7628 $ 1.3110
3 month exchange rate AUD 623,130.61 $ 0.8024 $ 1.2463
Loss in currency exchange AUD (32,349.20)
90-day forward rate hedge Amount US$ $A
Receive payment $ 500,000.00
Spot exchange AUD 655,479.81 $ 0.7628 $ 1.3110
90-day forward rate AUD 638,732.75 $ 0.78 $ 1.2775
Loss in currency exchange AUD (16,747.06)
FINANCE
Question 4:
Identifying and explaining the risk faced by company specific instruments use control
the risks:
The major risk of the company is rising debt and expenses, which conducted by the
company with the risk from rising debt and currency rate fluctuation could be identified. The
relevant control such as low debt accumulation and hedge processing could be used by the
company to decline the rising from investment.
Question 5:
Depicting the best strategy for the company to avoid receiving least amount A$ by
hedging the exchange rate:
No hedge process Amount US$ $A
Receive payment $ 500,000.00
Spot exchange AUD 655,479.81 $ 0.7628 $ 1.3110
3 month exchange rate AUD 623,130.61 $ 0.8024 $ 1.2463
Loss in currency exchange AUD (32,349.20)
90-day forward rate hedge Amount US$ $A
Receive payment $ 500,000.00
Spot exchange AUD 655,479.81 $ 0.7628 $ 1.3110
90-day forward rate AUD 638,732.75 $ 0.78 $ 1.2775
Loss in currency exchange AUD (16,747.06)
11
FINANCE
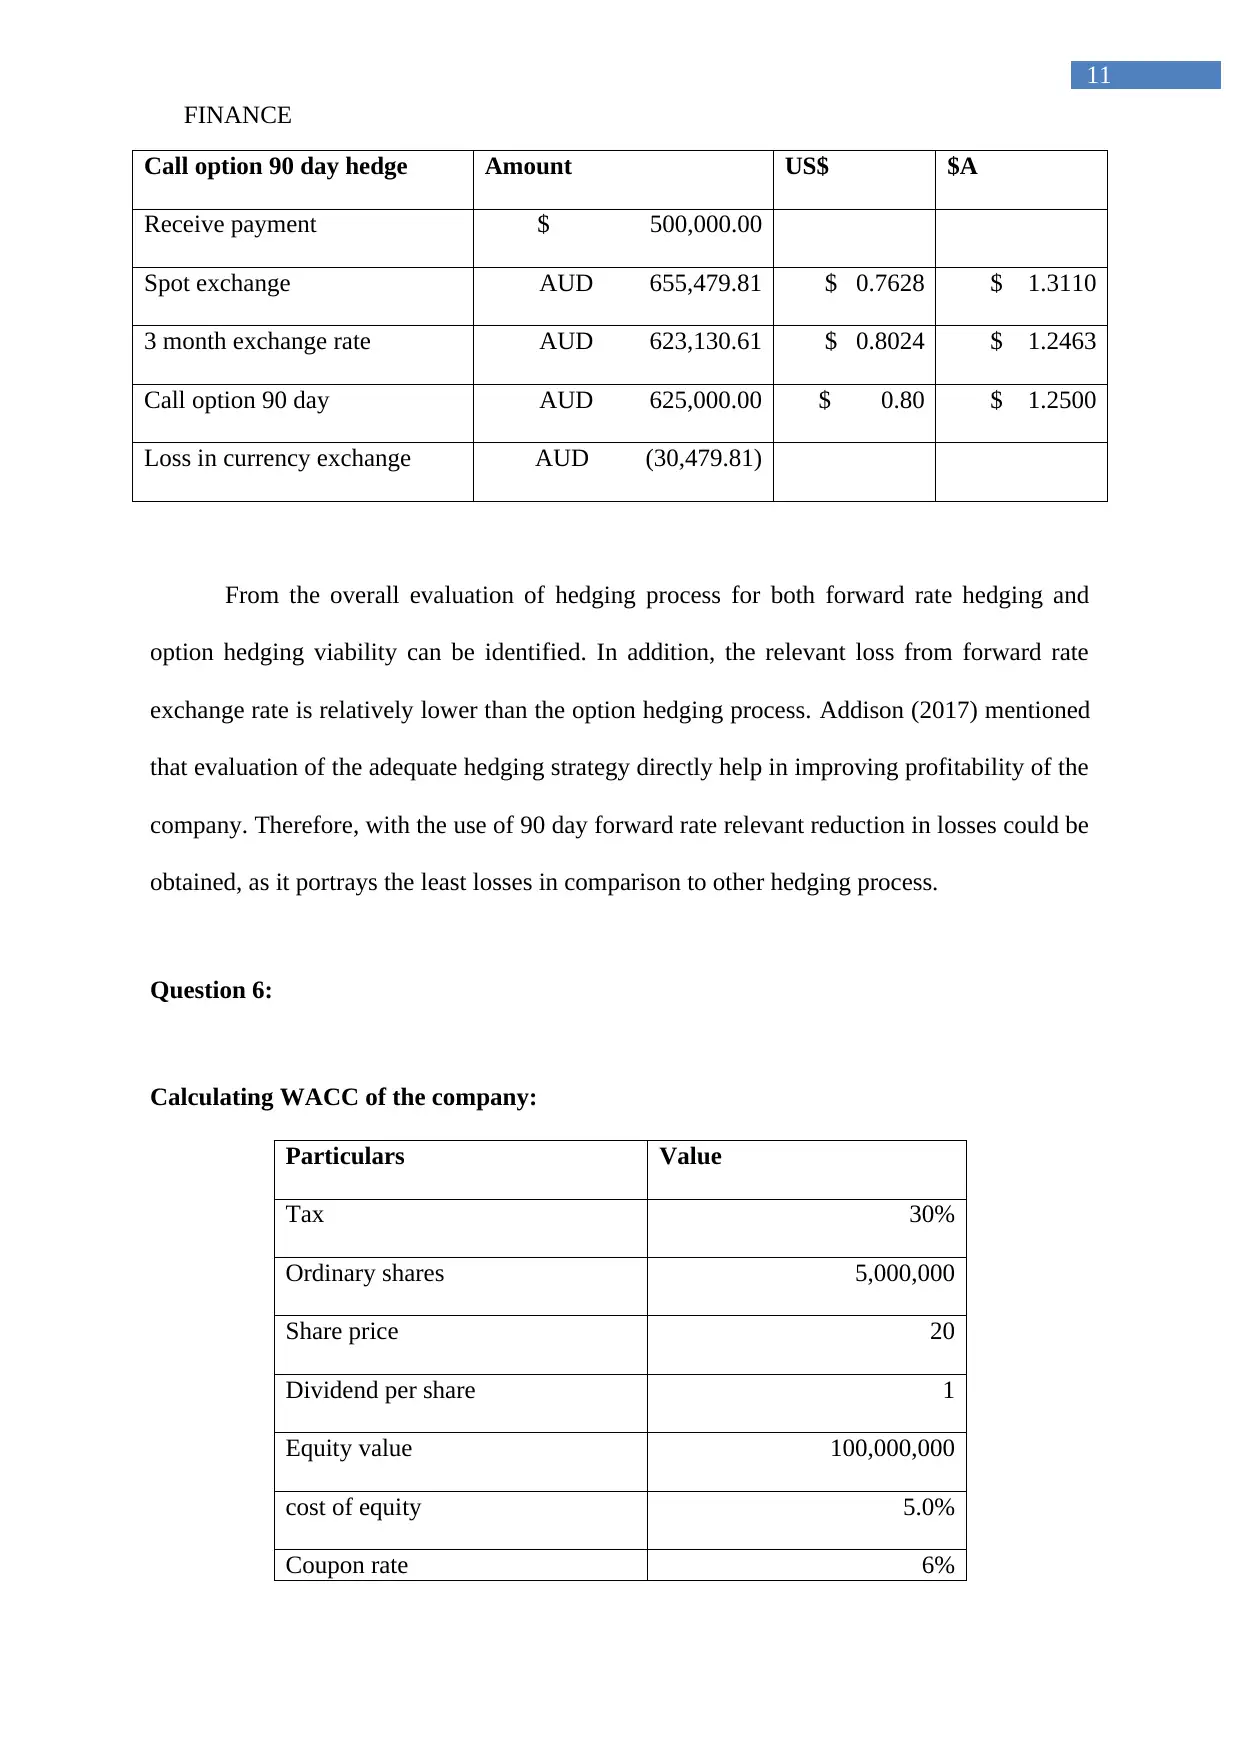
Call option 90 day hedge Amount US$ $A
Receive payment $ 500,000.00
Spot exchange AUD 655,479.81 $ 0.7628 $ 1.3110
3 month exchange rate AUD 623,130.61 $ 0.8024 $ 1.2463
Call option 90 day AUD 625,000.00 $ 0.80 $ 1.2500
Loss in currency exchange AUD (30,479.81)
From the overall evaluation of hedging process for both forward rate hedging and
option hedging viability can be identified. In addition, the relevant loss from forward rate
exchange rate is relatively lower than the option hedging process. Addison (2017) mentioned
that evaluation of the adequate hedging strategy directly help in improving profitability of the
company. Therefore, with the use of 90 day forward rate relevant reduction in losses could be
obtained, as it portrays the least losses in comparison to other hedging process.
Question 6:
Calculating WACC of the company:
Particulars Value
Tax 30%
Ordinary shares 5,000,000
Share price 20
Dividend per share 1
Equity value 100,000,000
cost of equity 5.0%
Coupon rate 6%
FINANCE
Call option 90 day hedge Amount US$ $A
Receive payment $ 500,000.00
Spot exchange AUD 655,479.81 $ 0.7628 $ 1.3110
3 month exchange rate AUD 623,130.61 $ 0.8024 $ 1.2463
Call option 90 day AUD 625,000.00 $ 0.80 $ 1.2500
Loss in currency exchange AUD (30,479.81)
From the overall evaluation of hedging process for both forward rate hedging and
option hedging viability can be identified. In addition, the relevant loss from forward rate
exchange rate is relatively lower than the option hedging process. Addison (2017) mentioned
that evaluation of the adequate hedging strategy directly help in improving profitability of the
company. Therefore, with the use of 90 day forward rate relevant reduction in losses could be
obtained, as it portrays the least losses in comparison to other hedging process.
Question 6:
Calculating WACC of the company:
Particulars Value
Tax 30%
Ordinary shares 5,000,000
Share price 20
Dividend per share 1
Equity value 100,000,000
cost of equity 5.0%
Coupon rate 6%
⊘ This is a preview!⊘
Do you want full access?
Subscribe today to unlock all pages.
Trusted by 1+ million students worldwide
1 out of 14


Your All-in-One AI-Powered Toolkit for Academic Success.
+13062052269
info@desklib.com
Available 24*7 on WhatsApp / Email
![[object Object]](/_next/static/media/star-bottom.7253800d.svg)
Unlock your academic potential
Copyright © 2020–2026 A2Z Services. All Rights Reserved. Developed and managed by ZUCOL.