Comparative Financial Analysis: Zoopla Plc and Rightmove Plc Report
VerifiedAdded on 2020/06/05
|14
|2723
|36
Report
AI Summary
This report presents a comprehensive financial analysis comparing the performance of Zoopla Plc and Rightmove Plc. It utilizes ratio analysis to evaluate profitability, liquidity, asset utilization, gearing, and stock market performance. The analysis examines key financial metrics such as revenue growth, operating margins, and earnings per share, providing insights into each company's financial health and market position. The report highlights key findings, such as Zoopla's revenue growth and Rightmove's strong operating margins, and offers recommendations for improvement. The analysis covers data from FY2015 and FY2016, providing a detailed overview of the companies' financial performance during this period. The study concludes with a summary of findings, emphasizing the importance of cost management and efficient asset utilization for both companies. The report also includes supporting figures and tables, along with references to relevant literature.

Financial analysis
Paraphrase This Document
Need a fresh take? Get an instant paraphrase of this document with our AI Paraphraser
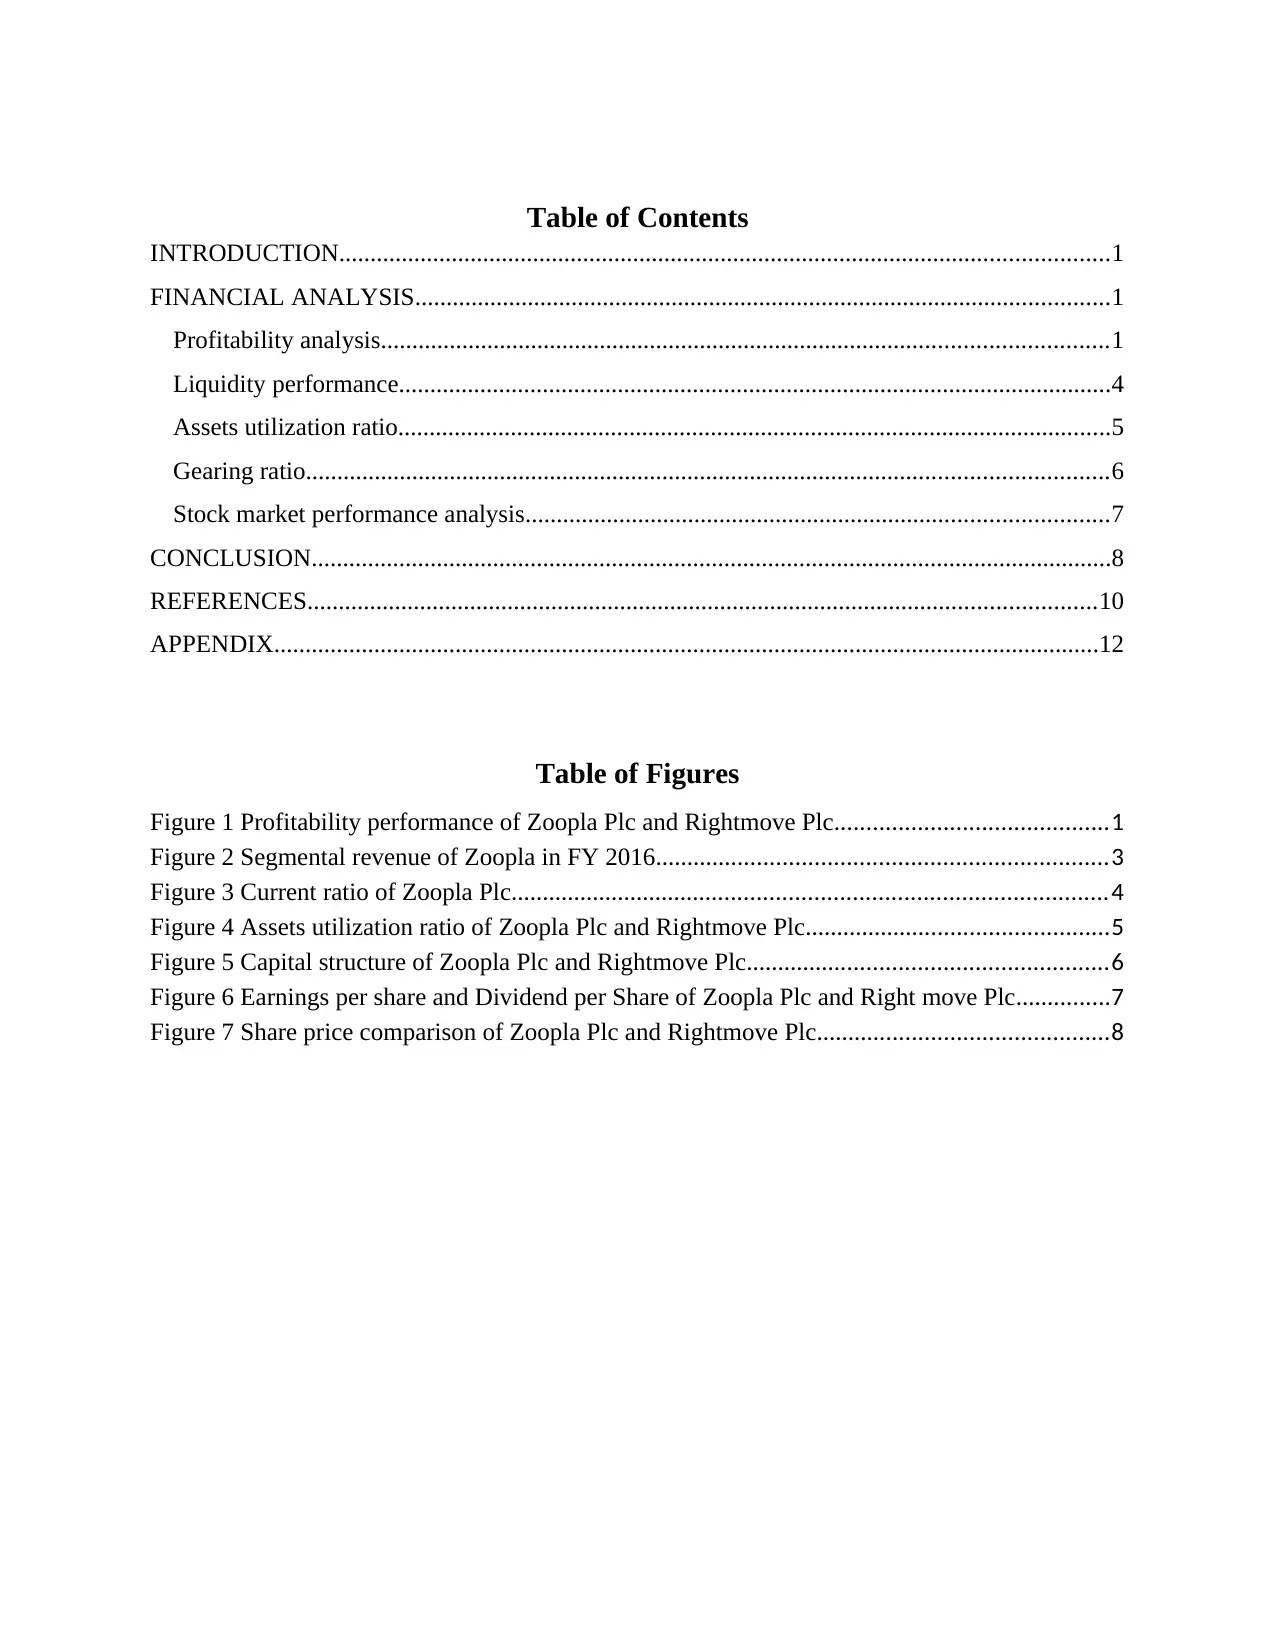
Table of Contents
INTRODUCTION...........................................................................................................................1
FINANCIAL ANALYSIS...............................................................................................................1
Profitability analysis....................................................................................................................1
Liquidity performance..................................................................................................................4
Assets utilization ratio..................................................................................................................5
Gearing ratio................................................................................................................................6
Stock market performance analysis.............................................................................................7
CONCLUSION................................................................................................................................8
REFERENCES..............................................................................................................................10
APPENDIX....................................................................................................................................12
Table of Figures
Figure 1 Profitability performance of Zoopla Plc and Rightmove Plc...........................................1
Figure 2 Segmental revenue of Zoopla in FY 2016.......................................................................3
Figure 3 Current ratio of Zoopla Plc..............................................................................................4
Figure 4 Assets utilization ratio of Zoopla Plc and Rightmove Plc................................................5
Figure 5 Capital structure of Zoopla Plc and Rightmove Plc.........................................................6
Figure 6 Earnings per share and Dividend per Share of Zoopla Plc and Right move Plc...............7
Figure 7 Share price comparison of Zoopla Plc and Rightmove Plc..............................................8
INTRODUCTION
In today’s competitive world, every organization keep continuous track over their
business financing activities to determine their performance and suitability. Companies just not
only need to examine their own performance but also need to examine competitor’s behavior,
strategies, actions and performance. UK Real Estate industry is a major contributor to the
economy as it contributes £94 billion and employs 1 million people in the sector (About Real
Estate, 2016). Zoopla Plc is a public limited company that provides information about property
prices, area, value estimates and other required information on it search engine. Its performance
will be compare with Rightmove Plc, which is UK’s biggest online property website and real
estate portal. Both the companies are listed on LSE and a constituent of FTSE 250 Index. The
research will analyze and compare the financial results of the companies using ratio analysis
technique.
FINANCIAL ANALYSIS
Profitability analysis
2015 2016 2015 2016
Rightmove Plc Zoopla Plc
0.00%
10.00%
20.00%
30.00%
40.00%
50.00%
60.00%
70.00%
80.00%
Profitability performance
Operating profit margin Net profit margin
Figure 1 Profitability performance of Zoopla Plc and Rightmove Plc
1 | P a g e
⊘ This is a preview!⊘
Do you want full access?
Subscribe today to unlock all pages.
Trusted by 1+ million students worldwide
In FY 2016, Zoopla Plc’s revenue grows up from £107.5m to £197.7m by 83.84% awith
58% increase in adjusted EBITDA to £77.1m. The year shows progressive result because in this
year, company had purchased one of the leading software and workflow solution providers,
Property Software Group that is used in its 8000 offices all around the marketplace. It enable
firm to deliver end-to-end solution including digital marketing, CRM, software and others.
Moreover, property partners helped business to maximize revenue. Increasing the scale of
operations helps both the customers and the business partners throughout the property lifecycle
(Jorgensen ,Lee and Rock, 2014). Moreover, its comparison services outperformed and deliver
exceptional results as revenue has been increased by 38% to £111.0m this year. Despite this, it
had also maximized its revenue stream by MoveIT and development of USwitch energy that
drive efficiency. MoveIT significantly contributes towards the business performance, as within
just one month, it generated revenue of more than £9000 (Zoopla Plc’s annual report, 2016).
Although, Brexit bring uncertainty however, Comparison website division did not
affected by it and in such tough time, the success majorly dependent upon suppliers competition.
Its Property Service Division audience shows year on year growth of 2% with 45 million visit
each month to the platform. It noticed a considerable growth in the number of agency partners in
UK placing advertisement on Zoopla’s portal as it goes up by 5% with total 13,373 in addition to
the 1074 overseas agents, 5003 software partners, 2610 new homes development and 415
commercial agents. Its annual financial report published average revenue per partner (ARPP) to
£328.
2016
UK Agency 64257
New Homes 11736
Other property services 10757
Energy 52659
Communication 44137
Other comparison services 14182
197728
2 | P a g e
Paraphrase This Document
Need a fresh take? Get an instant paraphrase of this document with our AI Paraphraser
32%
6%
5%27%
22% 7%
Segmental revenue of Zoopla for FY
2016
UK Agency
New Homes
Other property services
Energy
Communication
Other comparison services
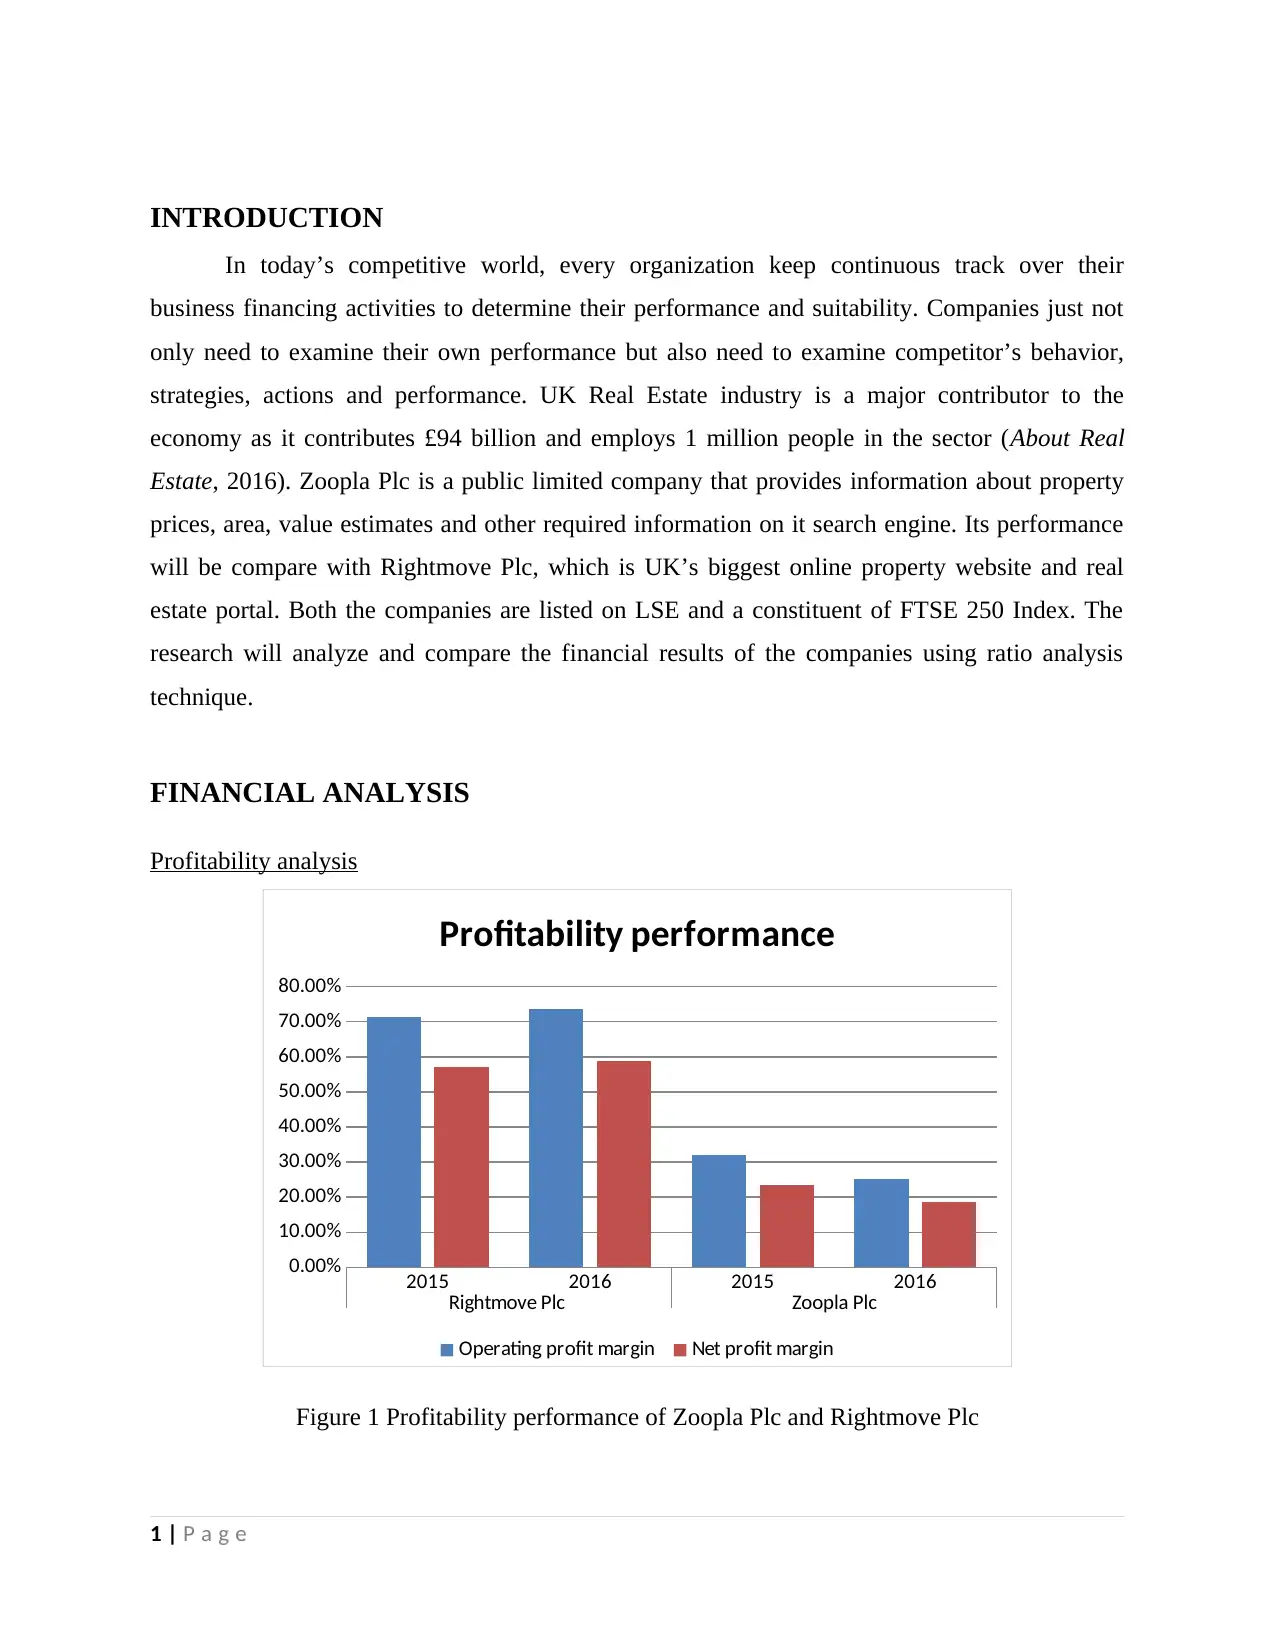
Figure 2 Segmental revenue of Zoopla in FY 2016
The highlights clearly shows that UK Agency, Energy and Communication are the major
contributed to the Group revenue as they contribute 33, 27% and 22%. In this year, company
spent excessive money on administrative expense as it increased from £72.9m to £148m as a
result its operating profit shows an increase of 43.73%, still, operating margin on sales came
down from 32.13% to 25.12% reflect negative results.
However, by contrast, looking to competitor, Rightmove Plc, revenue just reported yearly
increase of 14.50% from £192.1m to £220m at an increase in operational profitability by
17.84%. Its average revenue per advertiser (ARPA) goes up from £88 to £842 each month which
reflect impressive results (Rightmove Plc’s annual report, 2016). However, this year, its
consumer traffic on website reported average monthly increase of 120 million at 10% growth
however, on site time spent by a user increase to 1 billion minutes each month. Moreover,
existing users had spent more on its services that resultant growth in the revenue. Monthly
subscription fees remain the principle source of its revenues delivered strong growth (Heikal,
Khaddafi and Ummah, 2014). Continuous focus on innovation is the key reason that experienced
growth in revenue, however, underlying operating cost including salary as a result of wage
inflation, technical heads, more staff hired and increasing licensing cost reported slightly
increase by 13% from £47.78m to £53.8m. Still, comparing the profit ratios, operating margin is
3 | P a g e
6%
5%27%
22% 7%
Segmental revenue of Zoopla for FY
2016
UK Agency
New Homes
Other property services
Energy
Communication
Other comparison services
Figure 2 Segmental revenue of Zoopla in FY 2016
The highlights clearly shows that UK Agency, Energy and Communication are the major
contributed to the Group revenue as they contribute 33, 27% and 22%. In this year, company
spent excessive money on administrative expense as it increased from £72.9m to £148m as a
result its operating profit shows an increase of 43.73%, still, operating margin on sales came
down from 32.13% to 25.12% reflect negative results.
However, by contrast, looking to competitor, Rightmove Plc, revenue just reported yearly
increase of 14.50% from £192.1m to £220m at an increase in operational profitability by
17.84%. Its average revenue per advertiser (ARPA) goes up from £88 to £842 each month which
reflect impressive results (Rightmove Plc’s annual report, 2016). However, this year, its
consumer traffic on website reported average monthly increase of 120 million at 10% growth
however, on site time spent by a user increase to 1 billion minutes each month. Moreover,
existing users had spent more on its services that resultant growth in the revenue. Monthly
subscription fees remain the principle source of its revenues delivered strong growth (Heikal,
Khaddafi and Ummah, 2014). Continuous focus on innovation is the key reason that experienced
growth in revenue, however, underlying operating cost including salary as a result of wage
inflation, technical heads, more staff hired and increasing licensing cost reported slightly
increase by 13% from £47.78m to £53.8m. Still, comparing the profit ratios, operating margin is
3 | P a g e
too high from Zoopla Plc as in FY 2015, it was 71.40% goes up to 73.48% in FY 2016. The
financial results illustrates that it is performing great comparatively than Zoopla Plc.
In 2016, Net profit ratio of Zoopla Plc dropped from 23.60% to 18.55% indicates that its
performance is declining. On the contrary, Rightmove Plc continued focus of the firm on the cost
control reported growth from 56.98% to 58.88% shows increased profitability. However,
Zoopla’s policy is to pay 35%-45% of after-tax return to shareholders, and in 2016, its post-tax
profit increased to £36.7m by 44.50% (Al Nimer, Warrad and Al Mari, 2015). Despite revenue,
admin cost and others, changing regulation also affects its return due to increased compliance
cost. Due to more debt, Zoopla’s financing expense increased from £1.2m to £3.6m while
income tax liability grows up from £8.2m to £9.5m resultant poor net margin. However,
Rightmove reported a little increase in financing cost from £183,000 to £209,000 and income tax
increased from £27.6m to £32m coupled with high growth in profitability.
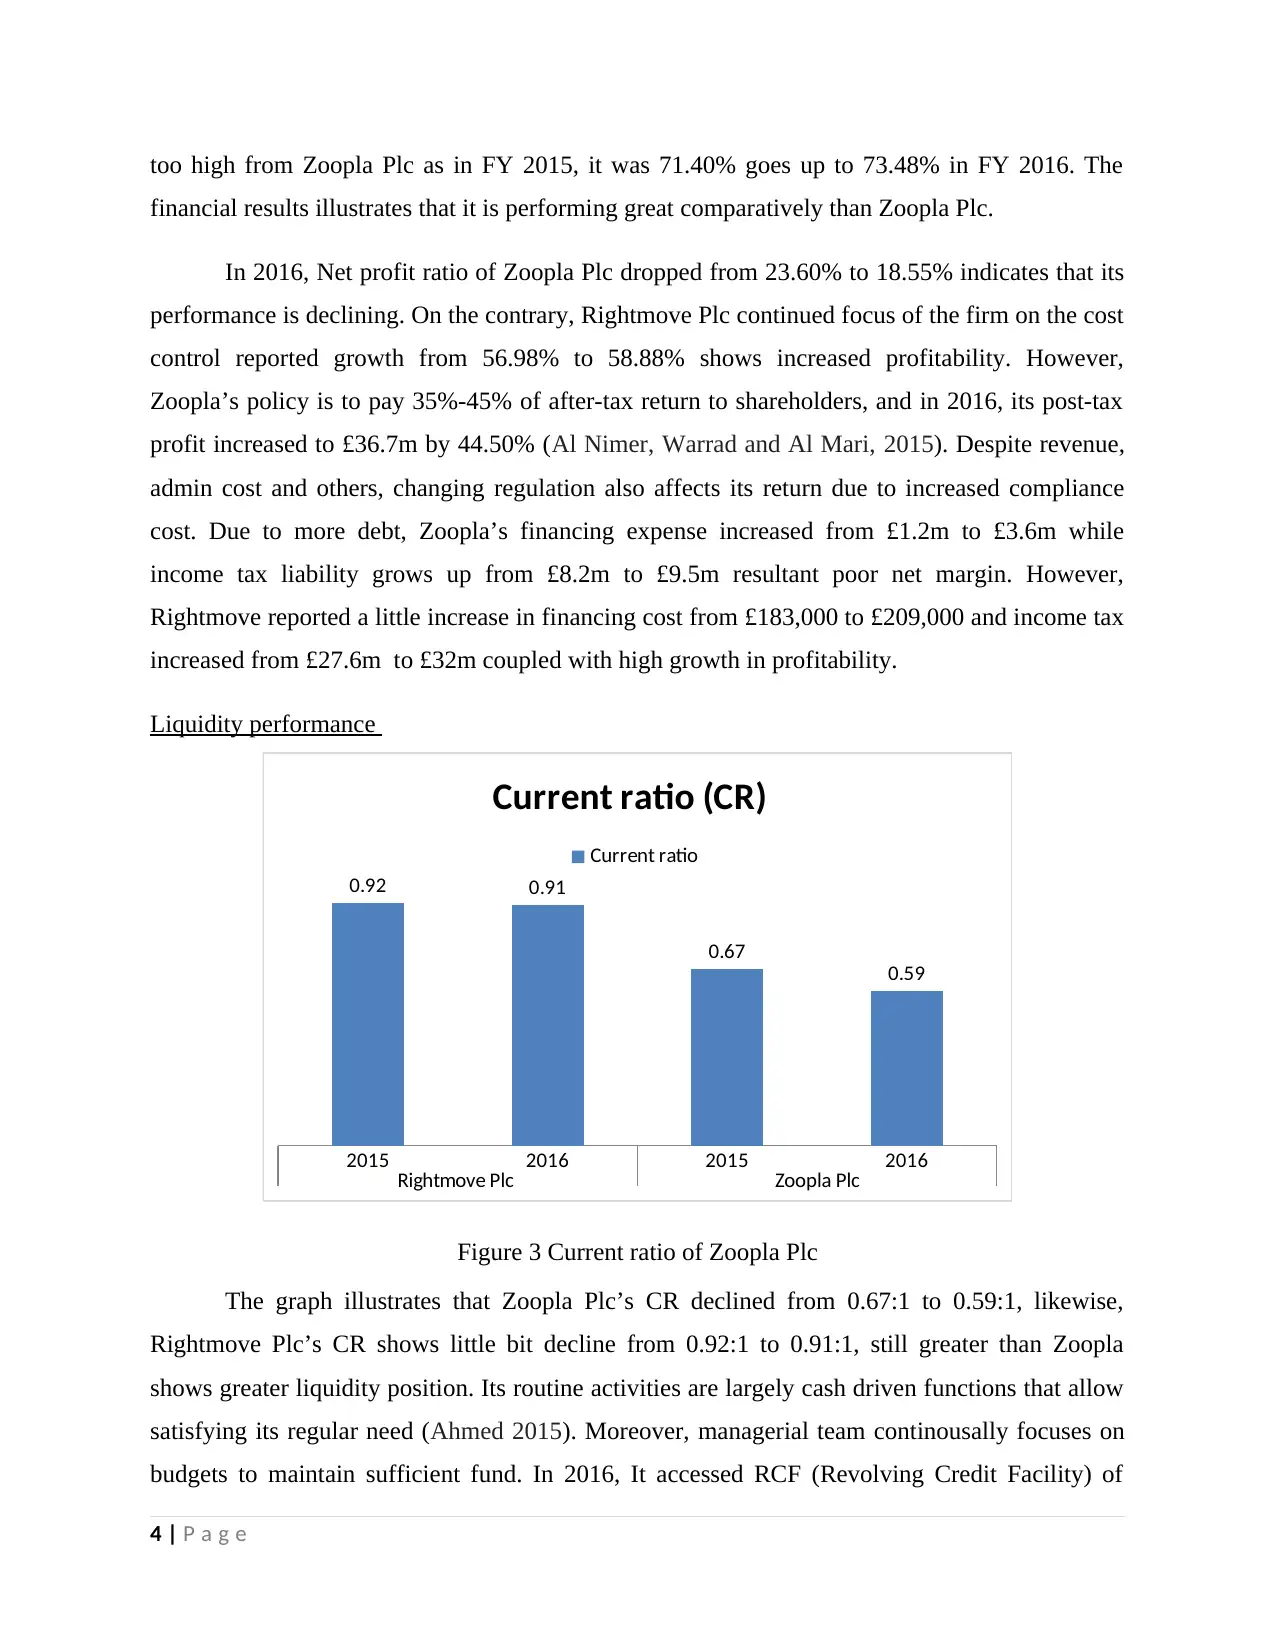
Liquidity performance
2015 2016 2015 2016
Rightmove Plc Zoopla Plc
0.92 0.91
0.67
0.59
Current ratio (CR)
Current ratio
Figure 3 Current ratio of Zoopla Plc
The graph illustrates that Zoopla Plc’s CR declined from 0.67:1 to 0.59:1, likewise,
Rightmove Plc’s CR shows little bit decline from 0.92:1 to 0.91:1, still greater than Zoopla
shows greater liquidity position. Its routine activities are largely cash driven functions that allow
satisfying its regular need (Ahmed 2015). Moreover, managerial team continousally focuses on
budgets to maintain sufficient fund. In 2016, It accessed RCF (Revolving Credit Facility) of
4 | P a g e
financial results illustrates that it is performing great comparatively than Zoopla Plc.
In 2016, Net profit ratio of Zoopla Plc dropped from 23.60% to 18.55% indicates that its
performance is declining. On the contrary, Rightmove Plc continued focus of the firm on the cost
control reported growth from 56.98% to 58.88% shows increased profitability. However,
Zoopla’s policy is to pay 35%-45% of after-tax return to shareholders, and in 2016, its post-tax
profit increased to £36.7m by 44.50% (Al Nimer, Warrad and Al Mari, 2015). Despite revenue,
admin cost and others, changing regulation also affects its return due to increased compliance
cost. Due to more debt, Zoopla’s financing expense increased from £1.2m to £3.6m while
income tax liability grows up from £8.2m to £9.5m resultant poor net margin. However,
Rightmove reported a little increase in financing cost from £183,000 to £209,000 and income tax
increased from £27.6m to £32m coupled with high growth in profitability.
Liquidity performance
2015 2016 2015 2016
Rightmove Plc Zoopla Plc
0.92 0.91
0.67
0.59
Current ratio (CR)
Current ratio
Figure 3 Current ratio of Zoopla Plc
The graph illustrates that Zoopla Plc’s CR declined from 0.67:1 to 0.59:1, likewise,
Rightmove Plc’s CR shows little bit decline from 0.92:1 to 0.91:1, still greater than Zoopla
shows greater liquidity position. Its routine activities are largely cash driven functions that allow
satisfying its regular need (Ahmed 2015). Moreover, managerial team continousally focuses on
budgets to maintain sufficient fund. In 2016, It accessed RCF (Revolving Credit Facility) of
4 | P a g e
⊘ This is a preview!⊘
Do you want full access?
Subscribe today to unlock all pages.
Trusted by 1+ million students worldwide
£200m however, Rightmove had an agreement with HSBC for £10,000 RCF (Rightmove Plc’s
annual report, 2016). Being subscription fees as a major source of revenue; Rightmove Plc is
able to receive regular cash allow business to meet out their financial liabilities. Throughout the
period, Group became able to satisfy its cash on demand in order to meet out operational
requirements excluding unpredictable circumstances like natural disasters. Comparing to the
benchmark of 1:1, it can be said that Rightmove’s CR is closer to it, shows strong liquidity.
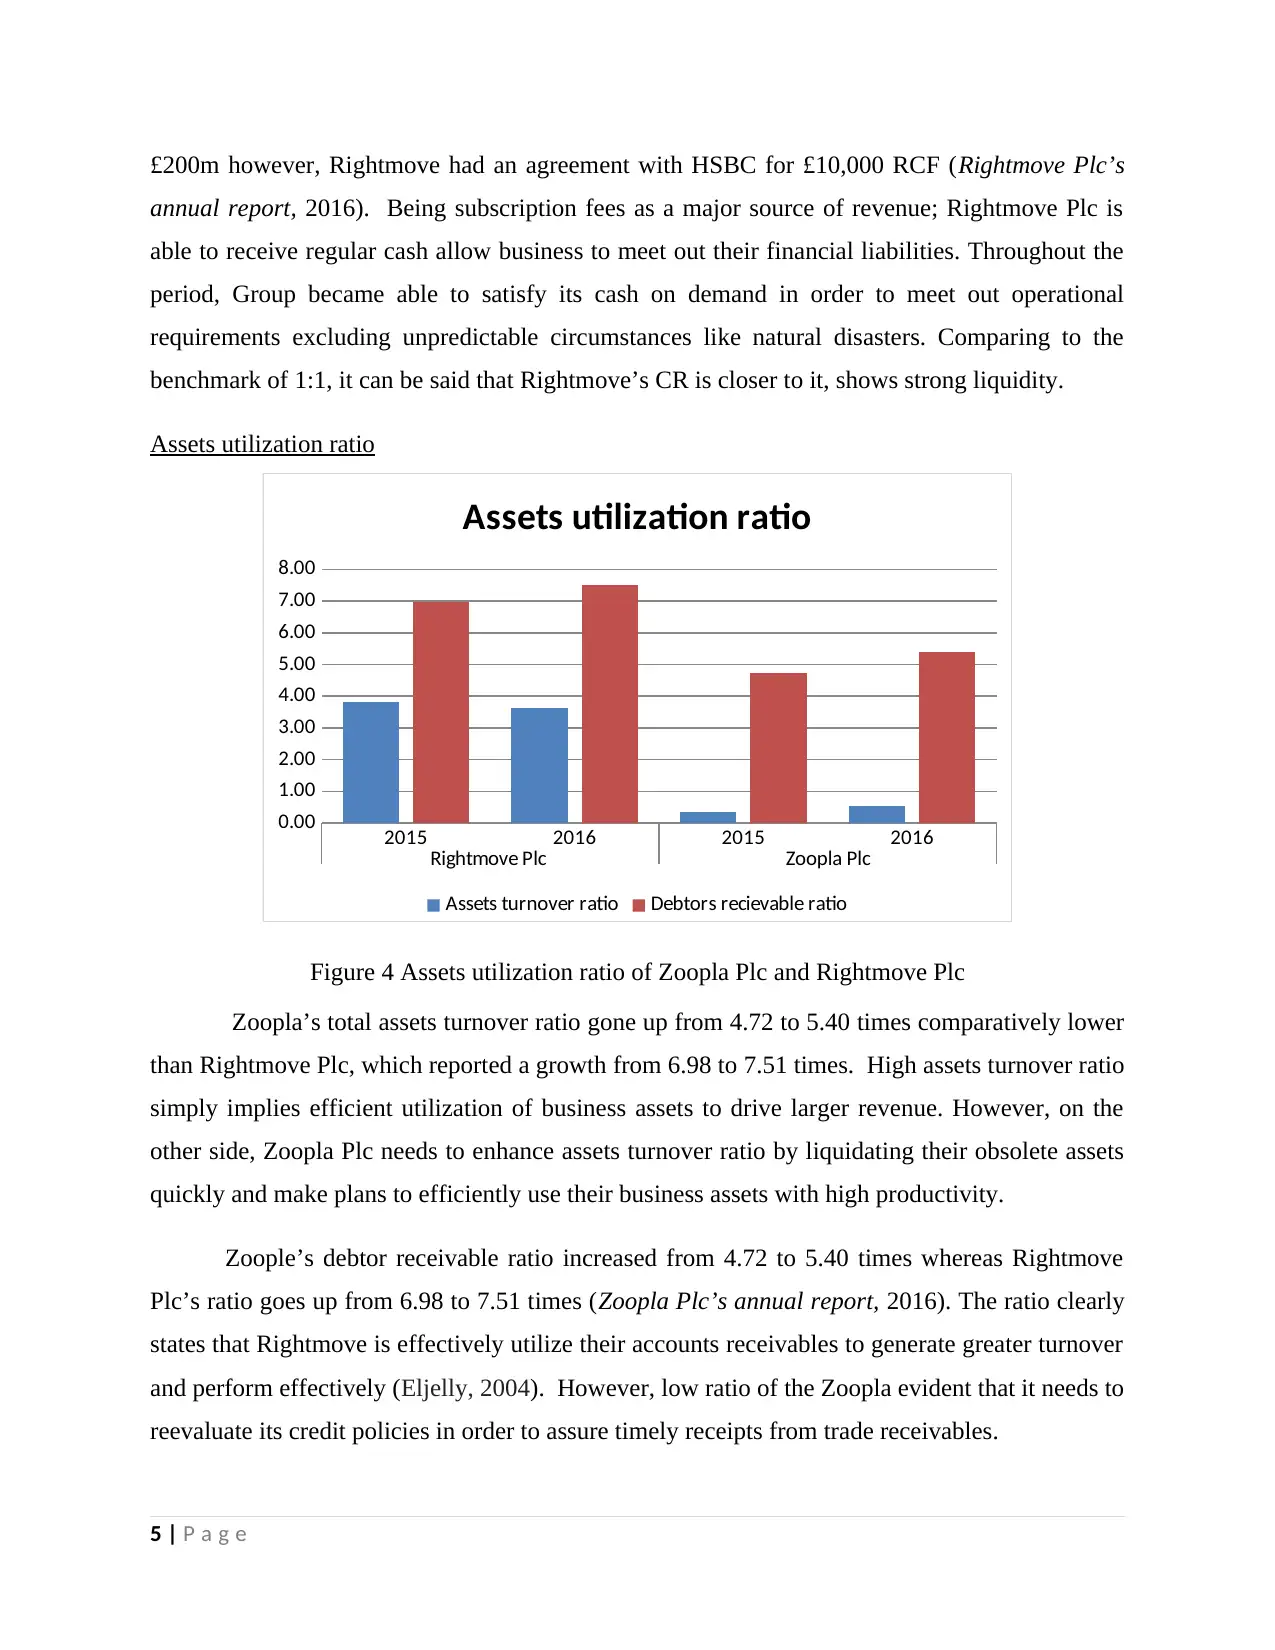
Assets utilization ratio
2015 2016 2015 2016
Rightmove Plc Zoopla Plc
0.00
1.00
2.00
3.00
4.00
5.00
6.00
7.00
8.00
Assets utilization ratio
Assets turnover ratio Debtors recievable ratio
Figure 4 Assets utilization ratio of Zoopla Plc and Rightmove Plc
Zoopla’s total assets turnover ratio gone up from 4.72 to 5.40 times comparatively lower
than Rightmove Plc, which reported a growth from 6.98 to 7.51 times. High assets turnover ratio
simply implies efficient utilization of business assets to drive larger revenue. However, on the
other side, Zoopla Plc needs to enhance assets turnover ratio by liquidating their obsolete assets
quickly and make plans to efficiently use their business assets with high productivity.
Zoople’s debtor receivable ratio increased from 4.72 to 5.40 times whereas Rightmove
Plc’s ratio goes up from 6.98 to 7.51 times (Zoopla Plc’s annual report, 2016). The ratio clearly
states that Rightmove is effectively utilize their accounts receivables to generate greater turnover
and perform effectively (Eljelly, 2004). However, low ratio of the Zoopla evident that it needs to
reevaluate its credit policies in order to assure timely receipts from trade receivables.
5 | P a g e
annual report, 2016). Being subscription fees as a major source of revenue; Rightmove Plc is
able to receive regular cash allow business to meet out their financial liabilities. Throughout the
period, Group became able to satisfy its cash on demand in order to meet out operational
requirements excluding unpredictable circumstances like natural disasters. Comparing to the
benchmark of 1:1, it can be said that Rightmove’s CR is closer to it, shows strong liquidity.
Assets utilization ratio
2015 2016 2015 2016
Rightmove Plc Zoopla Plc
0.00
1.00
2.00
3.00
4.00
5.00
6.00
7.00
8.00
Assets utilization ratio
Assets turnover ratio Debtors recievable ratio
Figure 4 Assets utilization ratio of Zoopla Plc and Rightmove Plc
Zoopla’s total assets turnover ratio gone up from 4.72 to 5.40 times comparatively lower
than Rightmove Plc, which reported a growth from 6.98 to 7.51 times. High assets turnover ratio
simply implies efficient utilization of business assets to drive larger revenue. However, on the
other side, Zoopla Plc needs to enhance assets turnover ratio by liquidating their obsolete assets
quickly and make plans to efficiently use their business assets with high productivity.
Zoople’s debtor receivable ratio increased from 4.72 to 5.40 times whereas Rightmove
Plc’s ratio goes up from 6.98 to 7.51 times (Zoopla Plc’s annual report, 2016). The ratio clearly
states that Rightmove is effectively utilize their accounts receivables to generate greater turnover
and perform effectively (Eljelly, 2004). However, low ratio of the Zoopla evident that it needs to
reevaluate its credit policies in order to assure timely receipts from trade receivables.
5 | P a g e
Paraphrase This Document
Need a fresh take? Get an instant paraphrase of this document with our AI Paraphraser
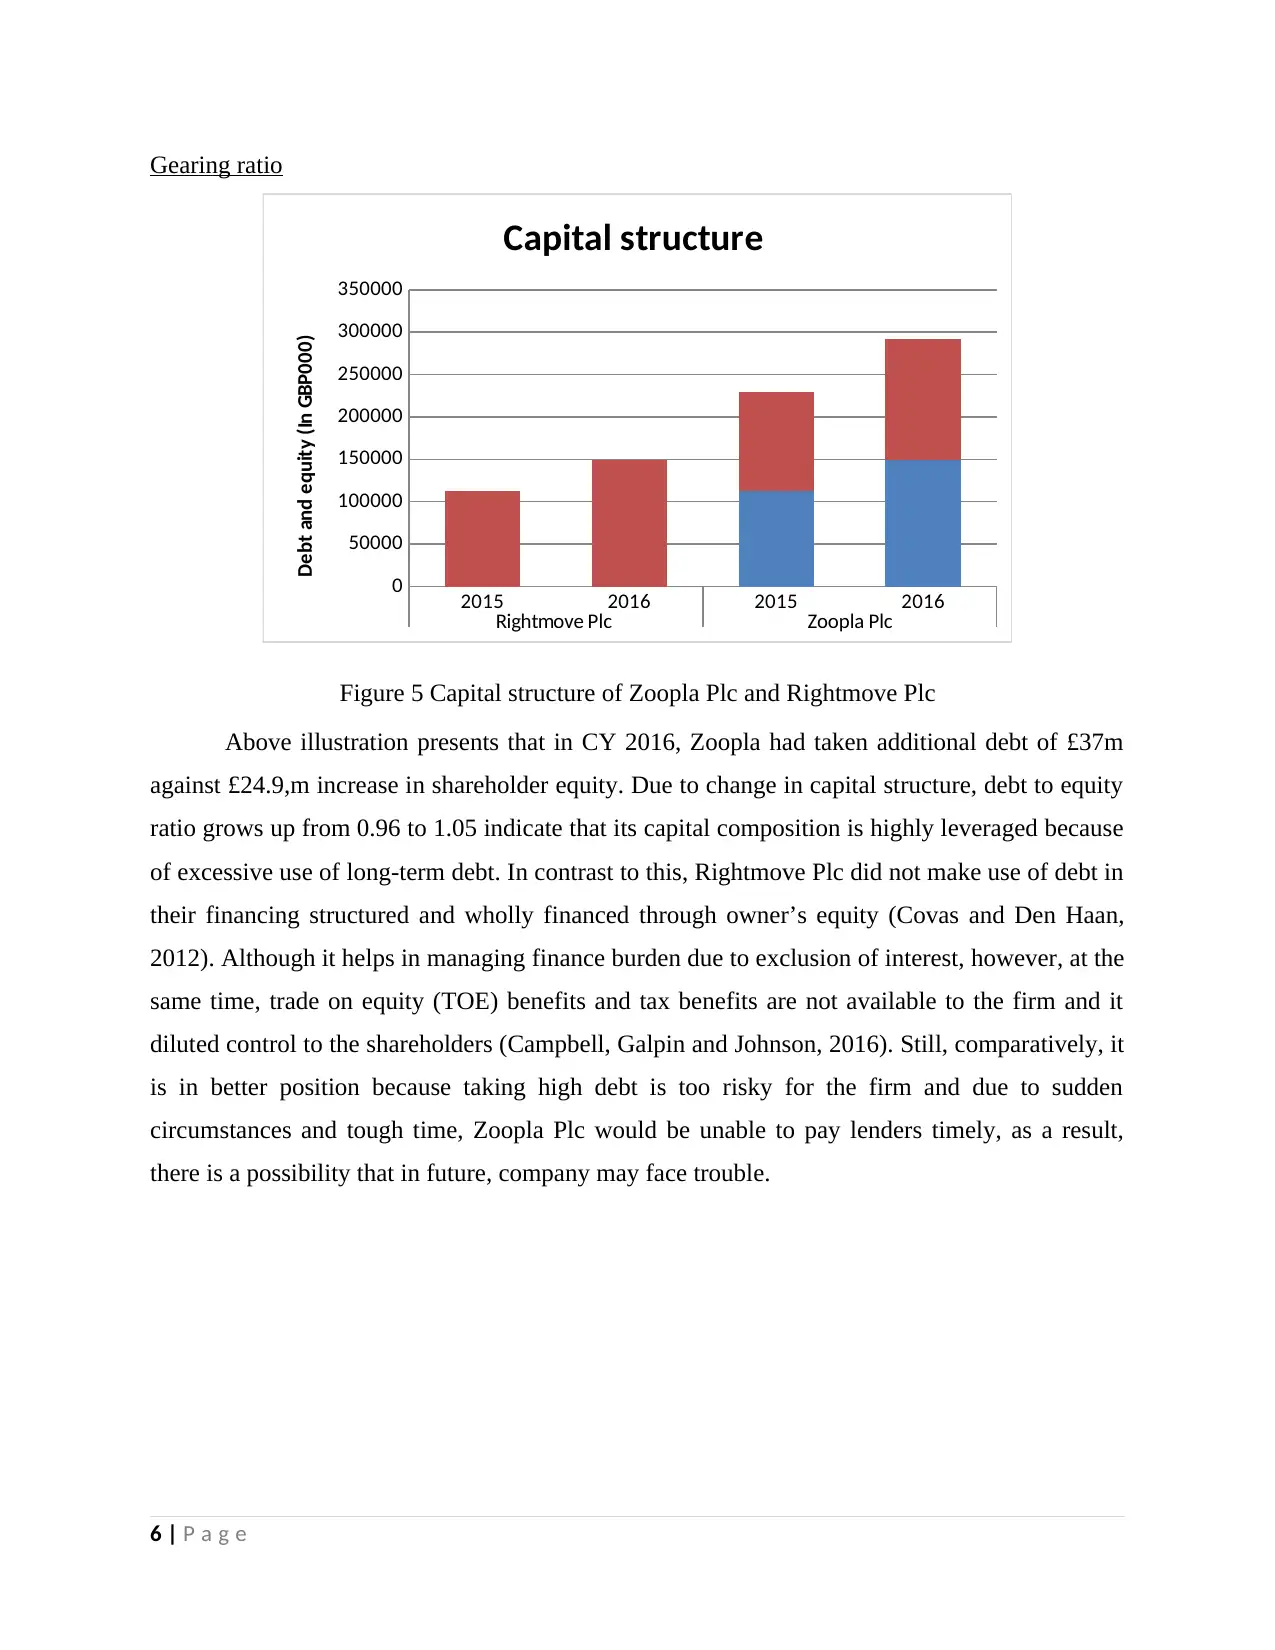
Gearing ratio
2015 2016 2015 2016
Rightmove Plc Zoopla Plc
0
50000
100000
150000
200000
250000
300000
350000
Capital structure
Debt and equity (In GBP000)
Figure 5 Capital structure of Zoopla Plc and Rightmove Plc
Above illustration presents that in CY 2016, Zoopla had taken additional debt of £37m
against £24.9,m increase in shareholder equity. Due to change in capital structure, debt to equity
ratio grows up from 0.96 to 1.05 indicate that its capital composition is highly leveraged because
of excessive use of long-term debt. In contrast to this, Rightmove Plc did not make use of debt in
their financing structured and wholly financed through owner’s equity (Covas and Den Haan,
2012). Although it helps in managing finance burden due to exclusion of interest, however, at the
same time, trade on equity (TOE) benefits and tax benefits are not available to the firm and it
diluted control to the shareholders (Campbell, Galpin and Johnson, 2016). Still, comparatively, it
is in better position because taking high debt is too risky for the firm and due to sudden
circumstances and tough time, Zoopla Plc would be unable to pay lenders timely, as a result,
there is a possibility that in future, company may face trouble.
6 | P a g e
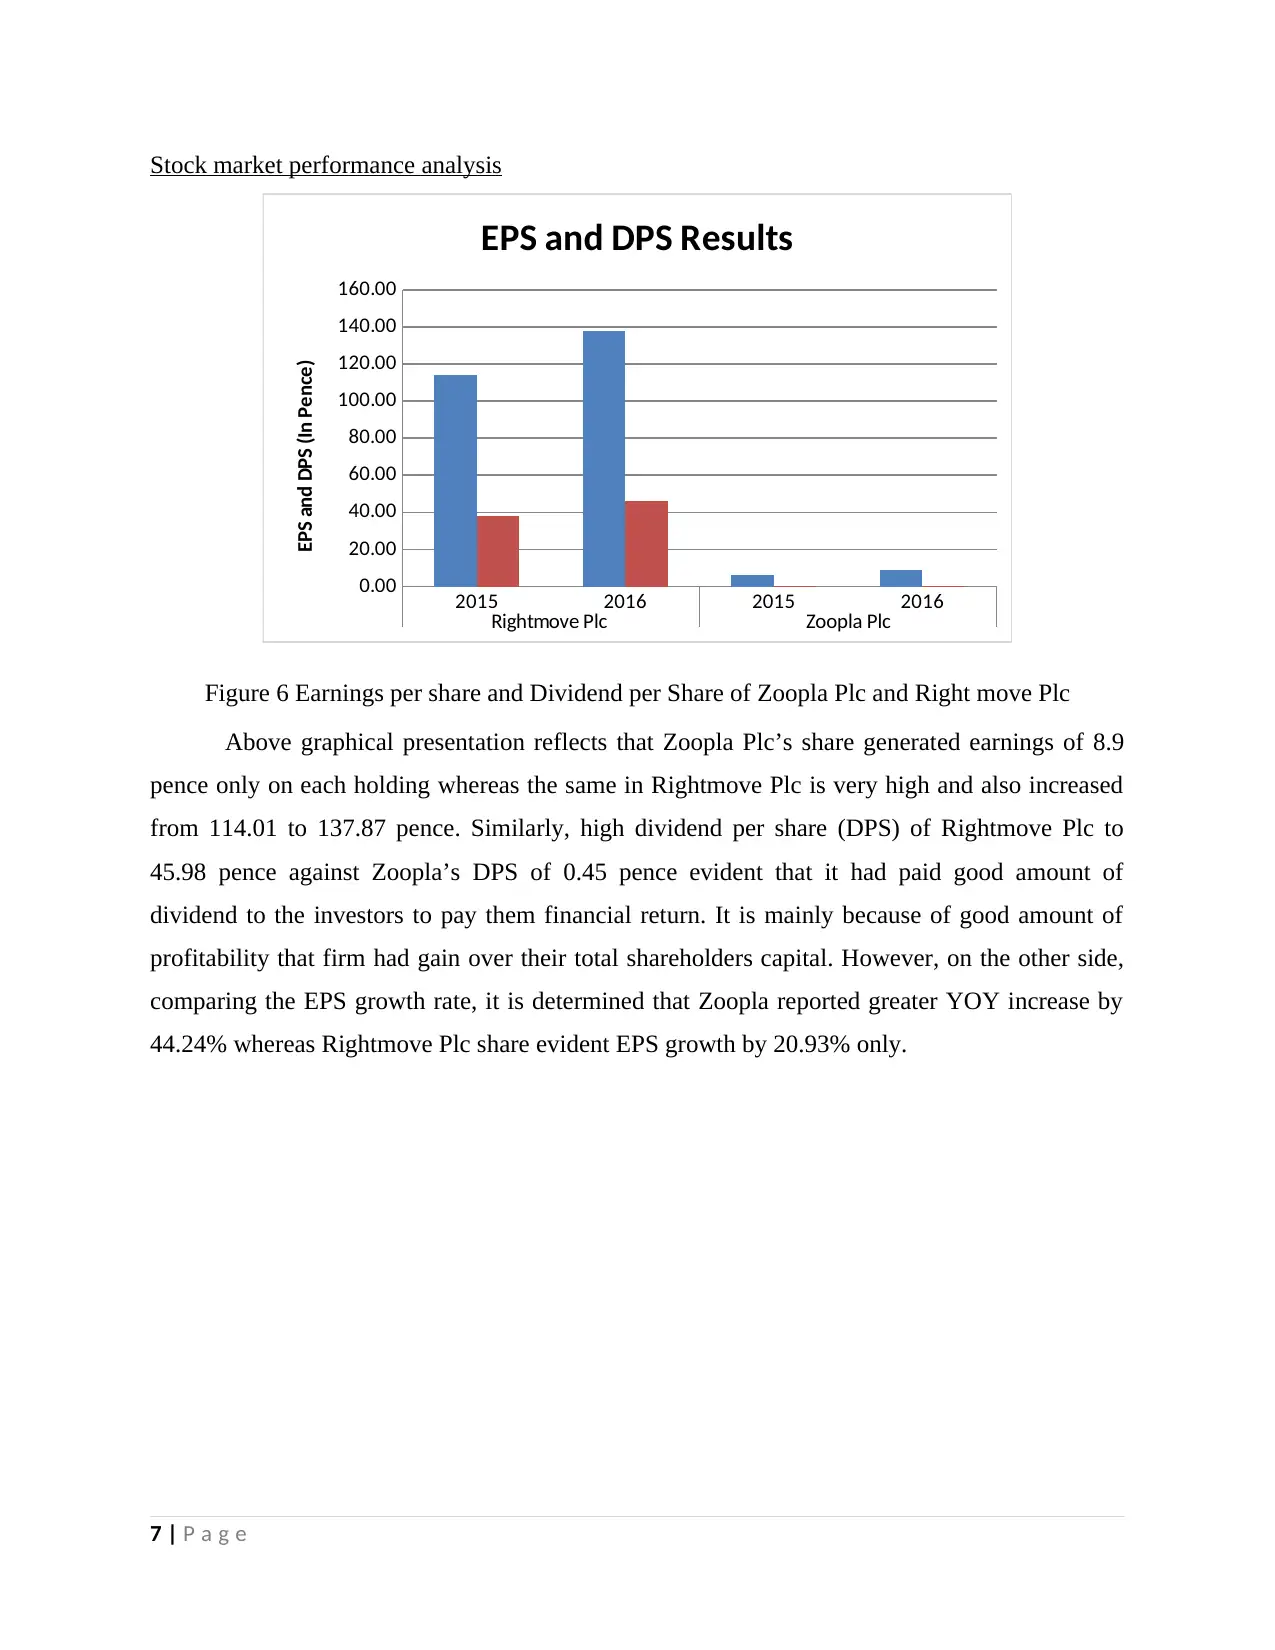
Stock market performance analysis
2015 2016 2015 2016
Rightmove Plc Zoopla Plc
0.00
20.00
40.00
60.00
80.00
100.00
120.00
140.00
160.00
EPS and DPS Results
EPS and DPS (In Pence)
Figure 6 Earnings per share and Dividend per Share of Zoopla Plc and Right move Plc
Above graphical presentation reflects that Zoopla Plc’s share generated earnings of 8.9
pence only on each holding whereas the same in Rightmove Plc is very high and also increased
from 114.01 to 137.87 pence. Similarly, high dividend per share (DPS) of Rightmove Plc to
45.98 pence against Zoopla’s DPS of 0.45 pence evident that it had paid good amount of
dividend to the investors to pay them financial return. It is mainly because of good amount of
profitability that firm had gain over their total shareholders capital. However, on the other side,
comparing the EPS growth rate, it is determined that Zoopla reported greater YOY increase by
44.24% whereas Rightmove Plc share evident EPS growth by 20.93% only.
7 | P a g e
⊘ This is a preview!⊘
Do you want full access?
Subscribe today to unlock all pages.
Trusted by 1+ million students worldwide
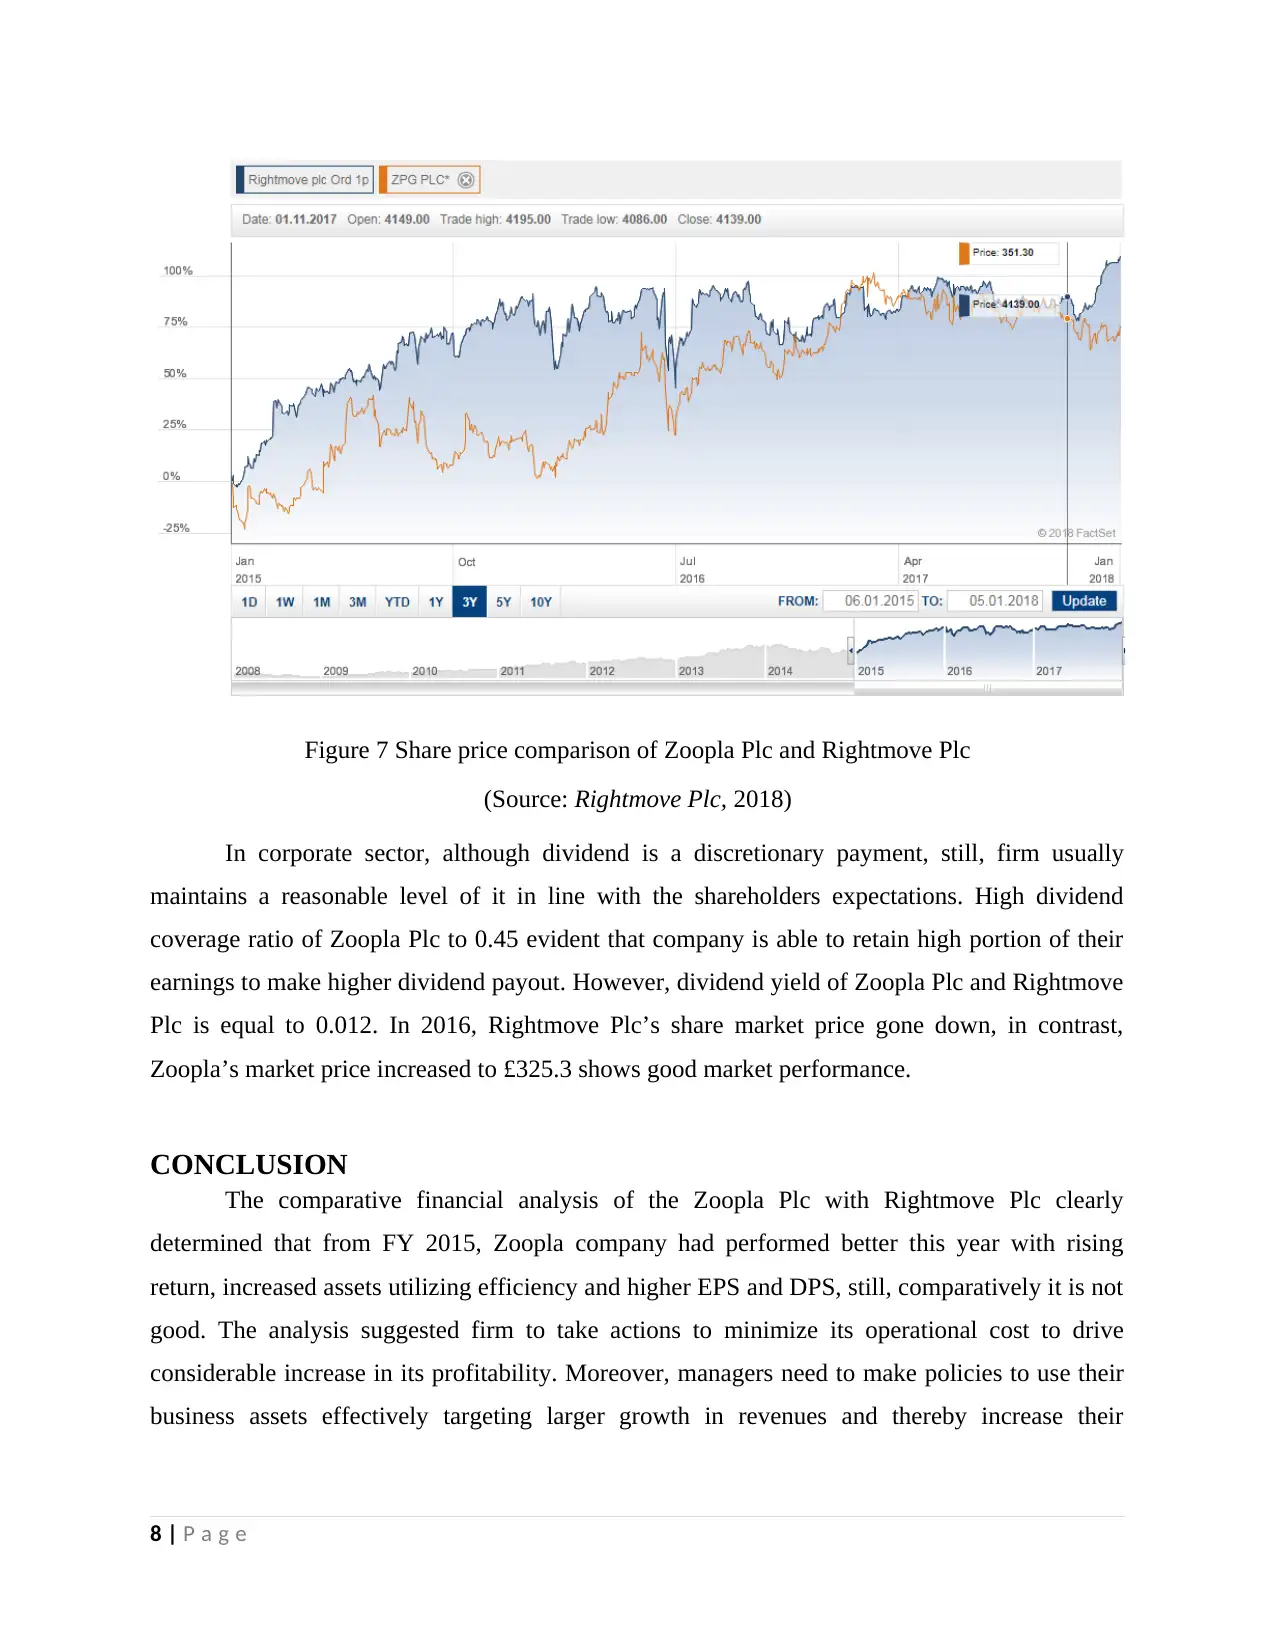
Figure 7 Share price comparison of Zoopla Plc and Rightmove Plc
(Source: Rightmove Plc, 2018)
In corporate sector, although dividend is a discretionary payment, still, firm usually
maintains a reasonable level of it in line with the shareholders expectations. High dividend
coverage ratio of Zoopla Plc to 0.45 evident that company is able to retain high portion of their
earnings to make higher dividend payout. However, dividend yield of Zoopla Plc and Rightmove
Plc is equal to 0.012. In 2016, Rightmove Plc’s share market price gone down, in contrast,
Zoopla’s market price increased to £325.3 shows good market performance.
CONCLUSION
The comparative financial analysis of the Zoopla Plc with Rightmove Plc clearly
determined that from FY 2015, Zoopla company had performed better this year with rising
return, increased assets utilizing efficiency and higher EPS and DPS, still, comparatively it is not
good. The analysis suggested firm to take actions to minimize its operational cost to drive
considerable increase in its profitability. Moreover, managers need to make policies to use their
business assets effectively targeting larger growth in revenues and thereby increase their
8 | P a g e
Paraphrase This Document
Need a fresh take? Get an instant paraphrase of this document with our AI Paraphraser

financial results. However, on the other side, to reduce excessive burden, it is consider better to
suggest firm to minimize excessively debt and improve solvency position.
9 | P a g e
suggest firm to minimize excessively debt and improve solvency position.
9 | P a g e
REFERENCES
Books and Journals
Ahmed, I.E., 2015. Liquidity, Profitability and the Dividends Payout Policy. World Review of
Business Research. 5(2). pp.73-85.
Al Nimer, M., Warrad, L. and Al Mari, R., 2015. The Impact of liquidity on Jordanian banks
profitability through return on assets. European Journal of Business and Management.
7(7). pp.229-232.
Campbell, T.C., Galpin, N. and Johnson, S.A., 2016. Optimal inside debt compensation and the
value of equity and debt. Journal of Financial Economics. 119(2). pp.336-352.
Covas, F. and Den Haan, W.J., 2012. The role of debt and equity finance over the business cycle. The
Economic Journal. 122(565). pp.1262-1286.
Eljelly, A.M., 2004. Liquidity‐profitability tradeoff: An empirical investigation in an emerging
market. International journal of commerce and management. 14(2). pp.48-61.
Heikal, M., Khaddafi, M. and Ummah, A., 2014. Influence analysis of return on assets (ROA),
return on equity (ROE), net profit margin (NPM), debt to equity ratio (DER), and current
ratio (CR), against corporate profit growth in automotive in Indonesia stock
exchange. International Journal of Academic Research in Business and Social Sciences.
4(12). p.101.
Jorgensen, B.N., Lee, Y.G. and Rock, S., 2014. The shapes of scaled earnings histograms are not
due to scaling and sample selection: Evidence from distributions of reported earnings per
share. Contemporary Accounting Research. 31(2). pp.498-521.
Online
About Real Estate. 2016. [Online]. Available through: http://www.bpf.org.uk/about-real-estate
Rightmove Plc. 2018. [Online]. Available through: < http://www.hl.co.uk/shares/shares-search-
results/r/rightmove-plc-ord-1p/share-charts>.
10 | P a g e
⊘ This is a preview!⊘
Do you want full access?
Subscribe today to unlock all pages.
Trusted by 1+ million students worldwide
1 out of 14
Related Documents


Your All-in-One AI-Powered Toolkit for Academic Success.
+13062052269
info@desklib.com
Available 24*7 on WhatsApp / Email
![[object Object]](/_next/static/media/star-bottom.7253800d.svg)
Unlock your academic potential
Copyright © 2020–2026 A2Z Services. All Rights Reserved. Developed and managed by ZUCOL.