Financial Management Report: Analysis of Dividend and Investment
VerifiedAdded on 2020/12/09
|15
|3985
|175
Report
AI Summary
This financial management report delves into key aspects of financial decision-making, specifically focusing on dividend policy and investment appraisal techniques. It begins by calculating the fair market value of Planet shares using the dividend growth model, considering both the initial and adjusted required rates of return. The report then critically evaluates the dividend growth model, highlighting its strengths and limitations, such as its sensitivity to input changes and its inability to account for non-dividend factors. Furthermore, the report analyzes investment appraisal techniques, including net present value (NPV), internal rate of return (IRR), and payback period, to assess the economic feasibility of a project. The report also examines the advantages and disadvantages of different investment appraisal methods. The analysis includes computations of cash flows, discount rates, and interpretations of the results to facilitate informed financial decisions.

Financial Management
Paraphrase This Document
Need a fresh take? Get an instant paraphrase of this document with our AI Paraphraser
Table of Contents
INTRODUCTION...........................................................................................................................1
Question 2........................................................................................................................................1
a. Calculation of the fair market value of planet shares..............................................................1
b. Computation of the new fair value for planet shares..............................................................2
c. Outlining the problems faced while using the dividend growth model in terms of valuing
the shares. ...................................................................................................................................2
Question 3........................................................................................................................................4
2. Evaluating the advantages and disadvantages of different investment appraisal technique...9
CONCLUSION..............................................................................................................................12
REFERENCES..............................................................................................................................13
INTRODUCTION
Financial management is the process of procurement of funds, allocation of funds and
optimum utilization of the funds so that larger profits can be generated from the particular
project. It facilitates the required financial information for assisting the company to produce and
distribute the products in such a manner that makes for higher profit margins. Financial
management provides for making different decisions such as financing, investment and dividend
decisions by the organization. The present report is based on the various financial aspects
involved in the financial management that includes the dividend policy and the investment
appraisal techniques. Furthermore, the study describes the capital budgeting tools that are used
for planning the investment proposal and the evaluation of the rate of return. In the report
question 1 and 3 are been evaluated.
Question 1
a. Calculation of the fair market value of planet shares
Calculation of the fair price of planet shares
last four years dividend per share to its shareholders
years amount (per share) growth rate
1 13 N/A
2 14 7.69%
3 17 21.43%
4 18 5.88%
Average growth rate 11.67%
Particulars formula Amount($)
Value of next year's expected
dividend 20
required rate of return 14.00%
constant growth rate 11.67%
fair market price value of dividend expected
for next year/(required rate
of return – constant growth
858.3690987124
1
⊘ This is a preview!⊘
Do you want full access?
Subscribe today to unlock all pages.
Trusted by 1+ million students worldwide
rate)
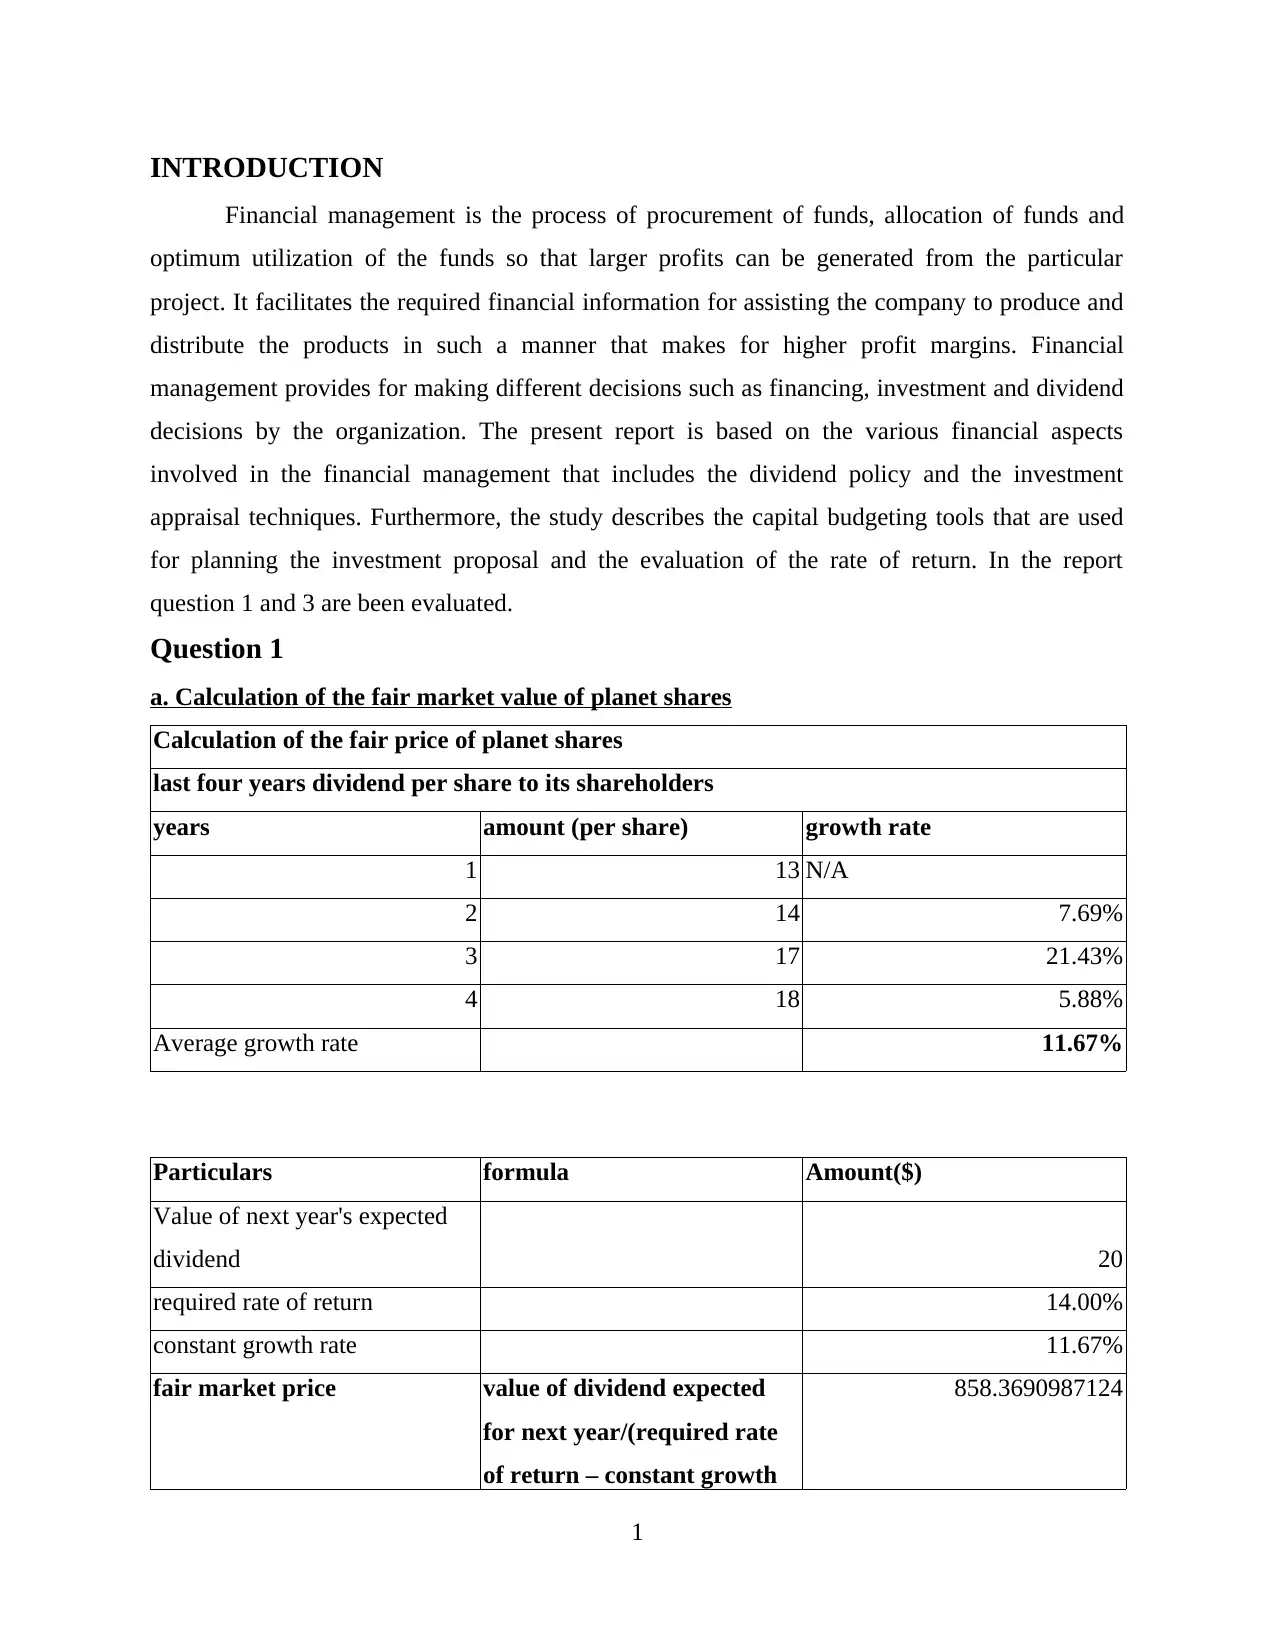
Interpretation- From the above table, it is interpreted that the fair price for the shares of
the Planet is evaluated as $858.36 by applying the dividend growth model. It is calculated by
dividing the expected dividend that is announced by the company equates to 20 per share with
that of the required return that is 14% subtracting to average growth rate of the past four years
resulted as 11.67%. In this model it has been assumed that the growth rate remains constant for
each of the years. The formula for computing the value is P= D1/(r-g).
b. Computation of the new fair value for planet shares
Calculation of the fair price of planet shares
last four years dividend per share to its shareholders
years amount (per share) growth rate
1 13 N/A
2 14 7.69%
3 17 21.43%
4 18 5.88%
11.67%
Particulars formula Amount($)
Value of next year's expected
dividend 20
required rate of return 15.40%
constant growth rate 11.67%
New fair market price
Value of dividend expected
for next year/(required rate
of return – constant growth
rate) 536.1930294906
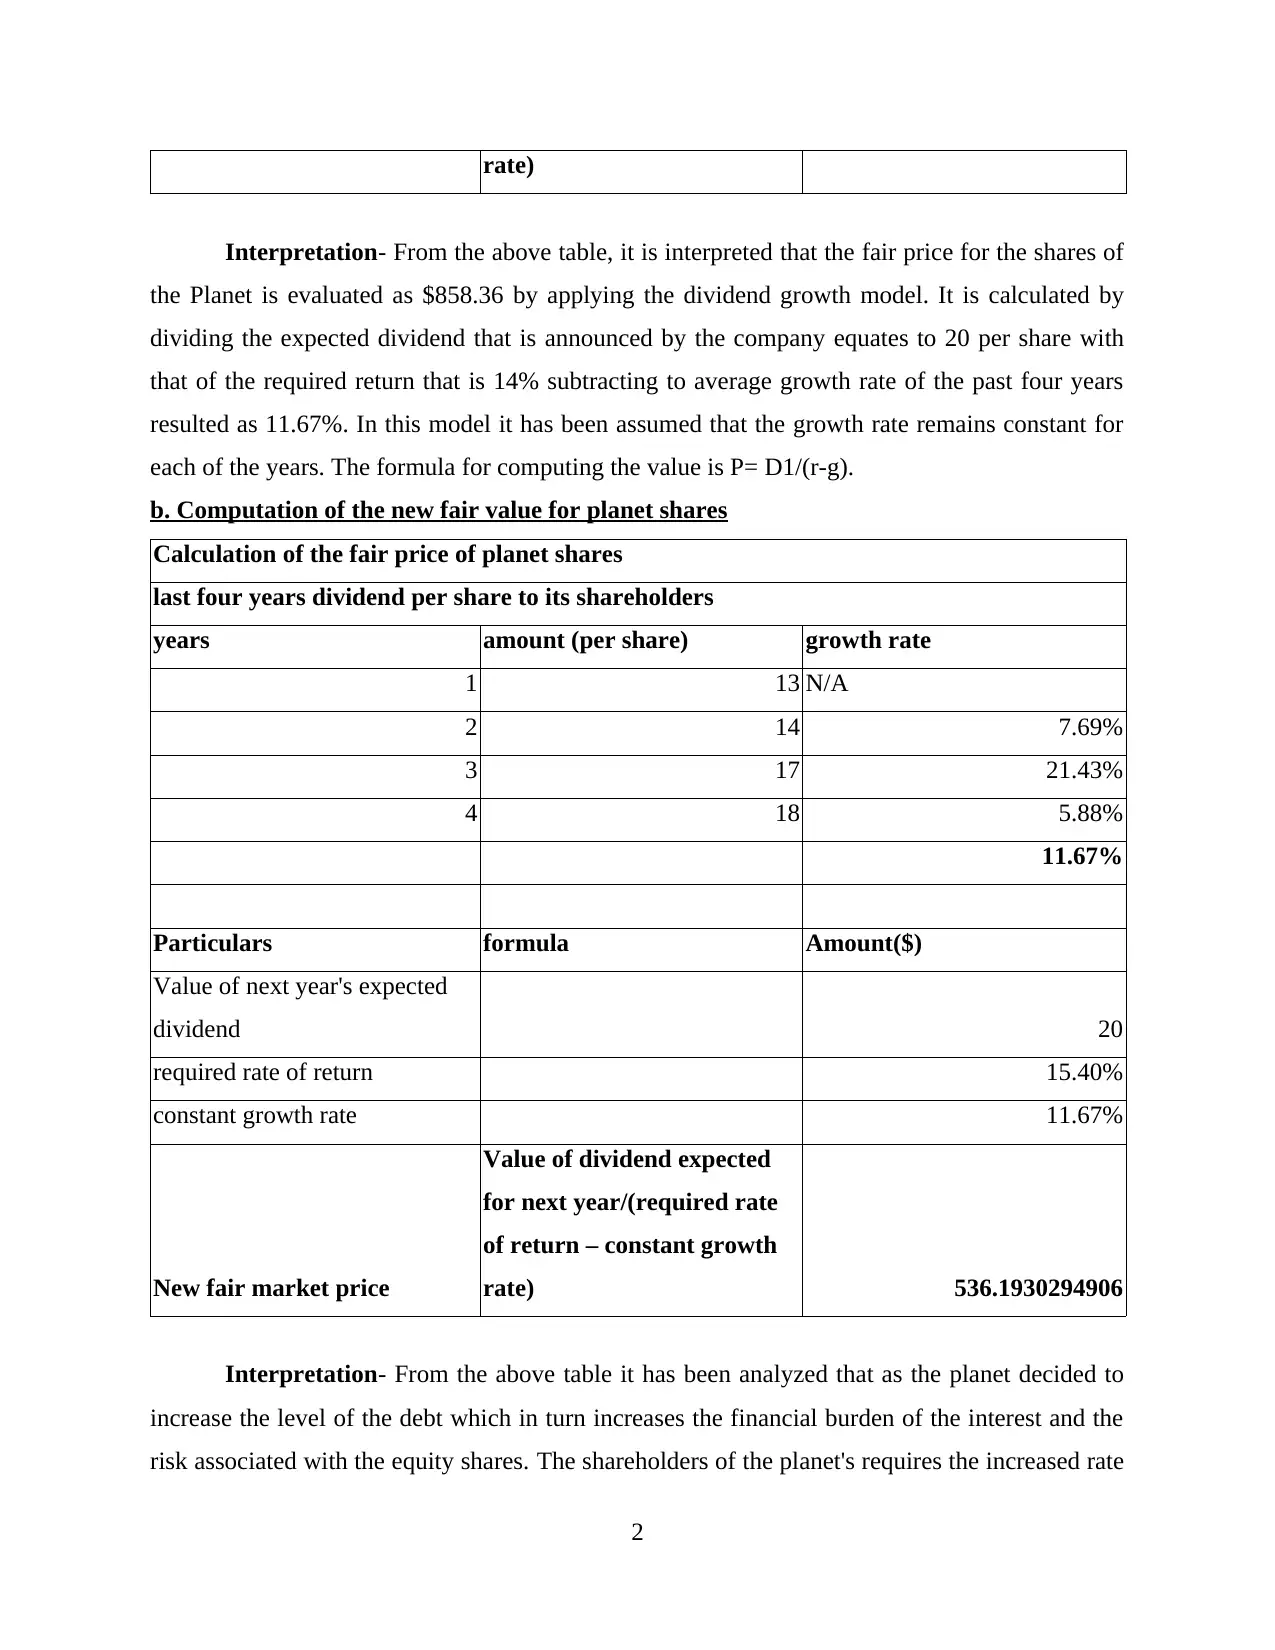
Interpretation- From the above table it has been analyzed that as the planet decided to
increase the level of the debt which in turn increases the financial burden of the interest and the
risk associated with the equity shares. The shareholders of the planet's requires the increased rate
2
Interpretation- From the above table, it is interpreted that the fair price for the shares of
the Planet is evaluated as $858.36 by applying the dividend growth model. It is calculated by
dividing the expected dividend that is announced by the company equates to 20 per share with
that of the required return that is 14% subtracting to average growth rate of the past four years
resulted as 11.67%. In this model it has been assumed that the growth rate remains constant for
each of the years. The formula for computing the value is P= D1/(r-g).
b. Computation of the new fair value for planet shares
Calculation of the fair price of planet shares
last four years dividend per share to its shareholders
years amount (per share) growth rate
1 13 N/A
2 14 7.69%
3 17 21.43%
4 18 5.88%
11.67%
Particulars formula Amount($)
Value of next year's expected
dividend 20
required rate of return 15.40%
constant growth rate 11.67%
New fair market price
Value of dividend expected
for next year/(required rate
of return – constant growth
rate) 536.1930294906
Interpretation- From the above table it has been analyzed that as the planet decided to
increase the level of the debt which in turn increases the financial burden of the interest and the
risk associated with the equity shares. The shareholders of the planet's requires the increased rate
2
Paraphrase This Document
Need a fresh take? Get an instant paraphrase of this document with our AI Paraphraser
of return of 15.4%. Due to the increase in the required rate of return the new fair value of the
shares has been ascertained as $536.19.
c. Outlining the problems faced while using the dividend growth model in terms of valuing the
shares.
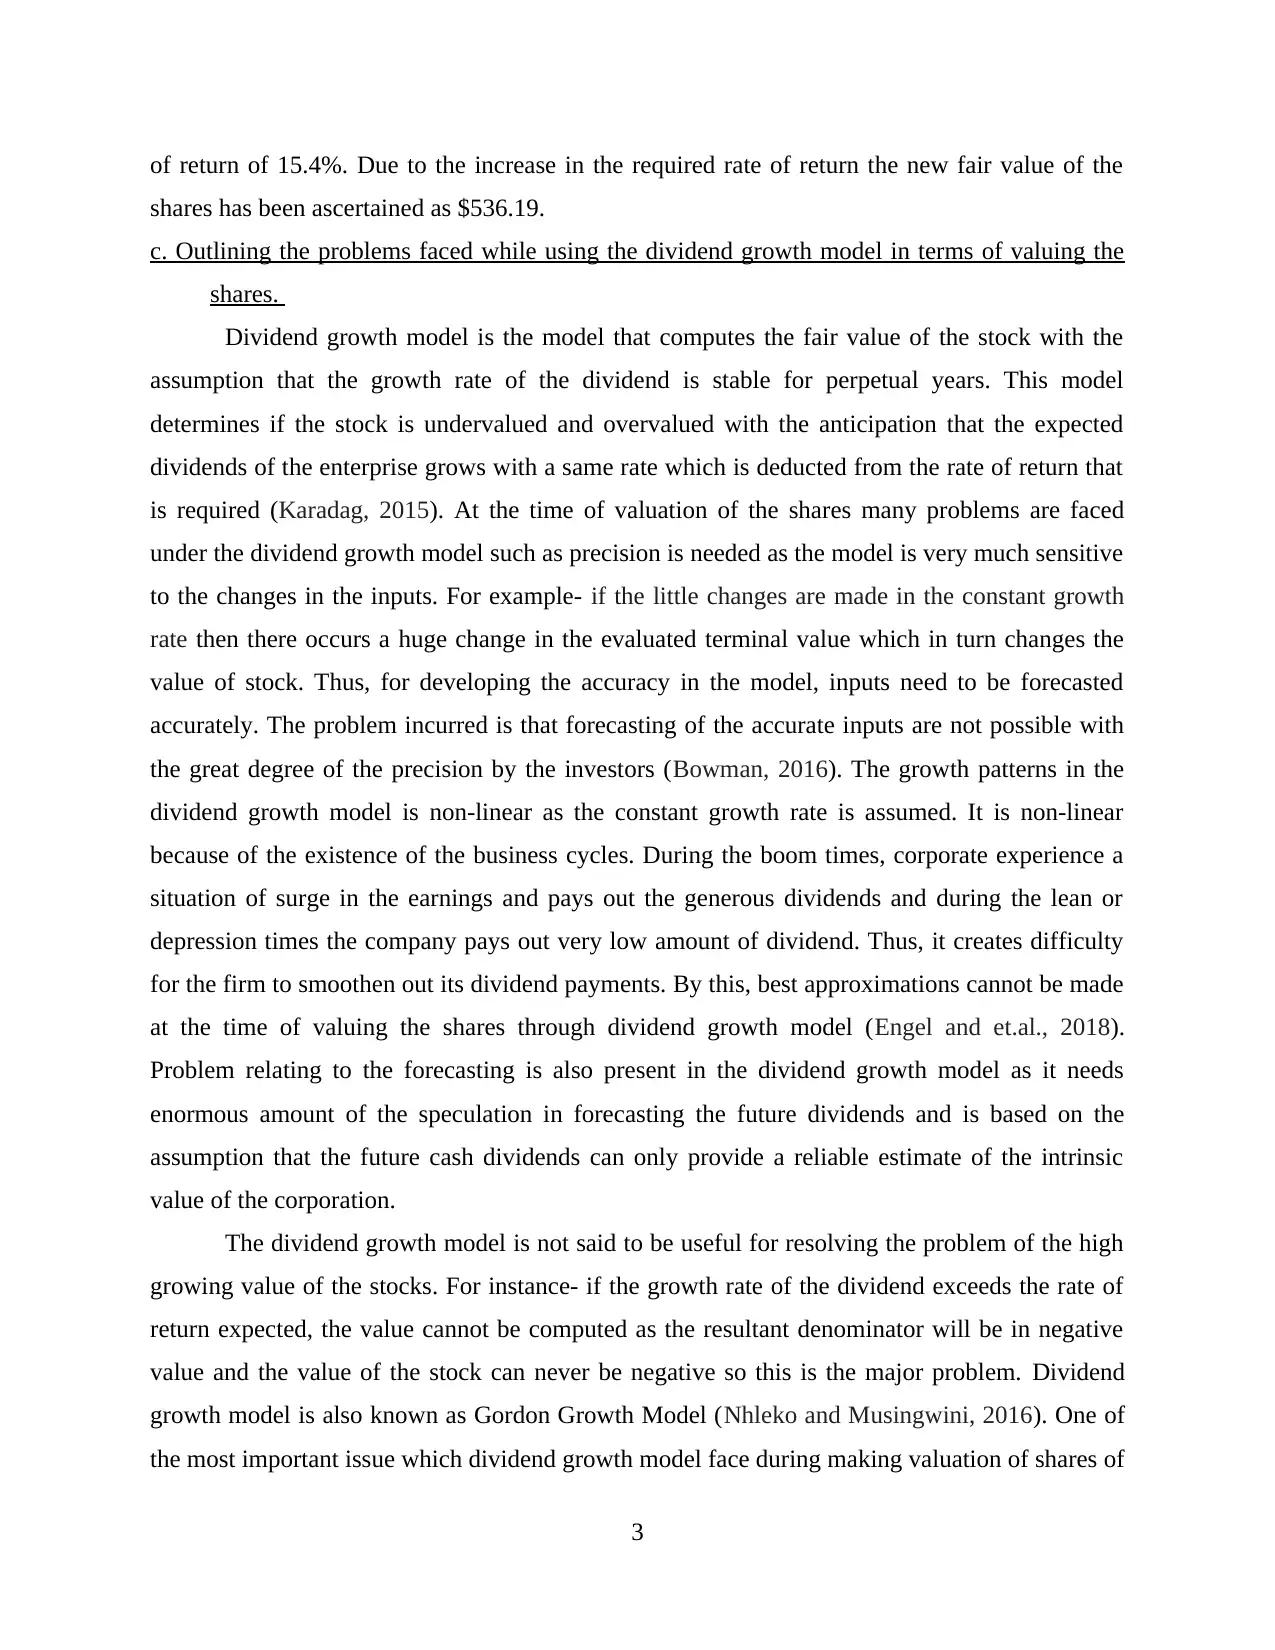
Dividend growth model is the model that computes the fair value of the stock with the
assumption that the growth rate of the dividend is stable for perpetual years. This model
determines if the stock is undervalued and overvalued with the anticipation that the expected
dividends of the enterprise grows with a same rate which is deducted from the rate of return that
is required (Karadag, 2015). At the time of valuation of the shares many problems are faced
under the dividend growth model such as precision is needed as the model is very much sensitive
to the changes in the inputs. For example- if the little changes are made in the constant growth
rate then there occurs a huge change in the evaluated terminal value which in turn changes the
value of stock. Thus, for developing the accuracy in the model, inputs need to be forecasted
accurately. The problem incurred is that forecasting of the accurate inputs are not possible with
the great degree of the precision by the investors (Bowman, 2016). The growth patterns in the
dividend growth model is non-linear as the constant growth rate is assumed. It is non-linear
because of the existence of the business cycles. During the boom times, corporate experience a
situation of surge in the earnings and pays out the generous dividends and during the lean or
depression times the company pays out very low amount of dividend. Thus, it creates difficulty
for the firm to smoothen out its dividend payments. By this, best approximations cannot be made
at the time of valuing the shares through dividend growth model (Engel and et.al., 2018).
Problem relating to the forecasting is also present in the dividend growth model as it needs
enormous amount of the speculation in forecasting the future dividends and is based on the
assumption that the future cash dividends can only provide a reliable estimate of the intrinsic
value of the corporation.
The dividend growth model is not said to be useful for resolving the problem of the high
growing value of the stocks. For instance- if the growth rate of the dividend exceeds the rate of
return expected, the value cannot be computed as the resultant denominator will be in negative
value and the value of the stock can never be negative so this is the major problem. Dividend
growth model is also known as Gordon Growth Model (Nhleko and Musingwini, 2016). One of
the most important issue which dividend growth model face during making valuation of shares of
3
shares has been ascertained as $536.19.
c. Outlining the problems faced while using the dividend growth model in terms of valuing the
shares.
Dividend growth model is the model that computes the fair value of the stock with the
assumption that the growth rate of the dividend is stable for perpetual years. This model
determines if the stock is undervalued and overvalued with the anticipation that the expected
dividends of the enterprise grows with a same rate which is deducted from the rate of return that
is required (Karadag, 2015). At the time of valuation of the shares many problems are faced
under the dividend growth model such as precision is needed as the model is very much sensitive
to the changes in the inputs. For example- if the little changes are made in the constant growth
rate then there occurs a huge change in the evaluated terminal value which in turn changes the
value of stock. Thus, for developing the accuracy in the model, inputs need to be forecasted
accurately. The problem incurred is that forecasting of the accurate inputs are not possible with
the great degree of the precision by the investors (Bowman, 2016). The growth patterns in the
dividend growth model is non-linear as the constant growth rate is assumed. It is non-linear
because of the existence of the business cycles. During the boom times, corporate experience a
situation of surge in the earnings and pays out the generous dividends and during the lean or
depression times the company pays out very low amount of dividend. Thus, it creates difficulty
for the firm to smoothen out its dividend payments. By this, best approximations cannot be made
at the time of valuing the shares through dividend growth model (Engel and et.al., 2018).
Problem relating to the forecasting is also present in the dividend growth model as it needs
enormous amount of the speculation in forecasting the future dividends and is based on the
assumption that the future cash dividends can only provide a reliable estimate of the intrinsic
value of the corporation.
The dividend growth model is not said to be useful for resolving the problem of the high
growing value of the stocks. For instance- if the growth rate of the dividend exceeds the rate of
return expected, the value cannot be computed as the resultant denominator will be in negative
value and the value of the stock can never be negative so this is the major problem. Dividend
growth model is also known as Gordon Growth Model (Nhleko and Musingwini, 2016). One of
the most important issue which dividend growth model face during making valuation of shares of
3
the company is by not taking into consideration all the non dividend factors related to the
company. This model doesn't take into consideration factors which are not directly linked with
the dividend policy of the company and which is influencing the dividend distribution policy of
the company (Duncan and et.al., 2017). Non dividend factors of the company includes Brand
loyalty, retention and satisfaction of customer, ownership related to the acquisition of any
intangible assets, all this factors leads to increase in the market value of the company and its
shares or stocks. But this growth model doesn't consider it while valuing shares of company and
hence correct valuation of company's share is not possible or not done.
Also, the Dividend growth model relies mostly on one assumption which states that the
growth rate of the company is stable, constant and also know (Ozuomba, Anichebe and Okoye,
2016). The stock price of the company is directly related to the rate of dividend growth chosen
with assumption that the growth rate cannot exceed the cost of equity of the company, which is
not always reliable and true (Mugoša and Popović, 2015). Another issue of this dividend growth
model is that if the growth rate is higher than the required rate of return, the model can have
negative value. Also, when the growth rate and required rate of return have same value then the
value of share will be infinite which is not possible.
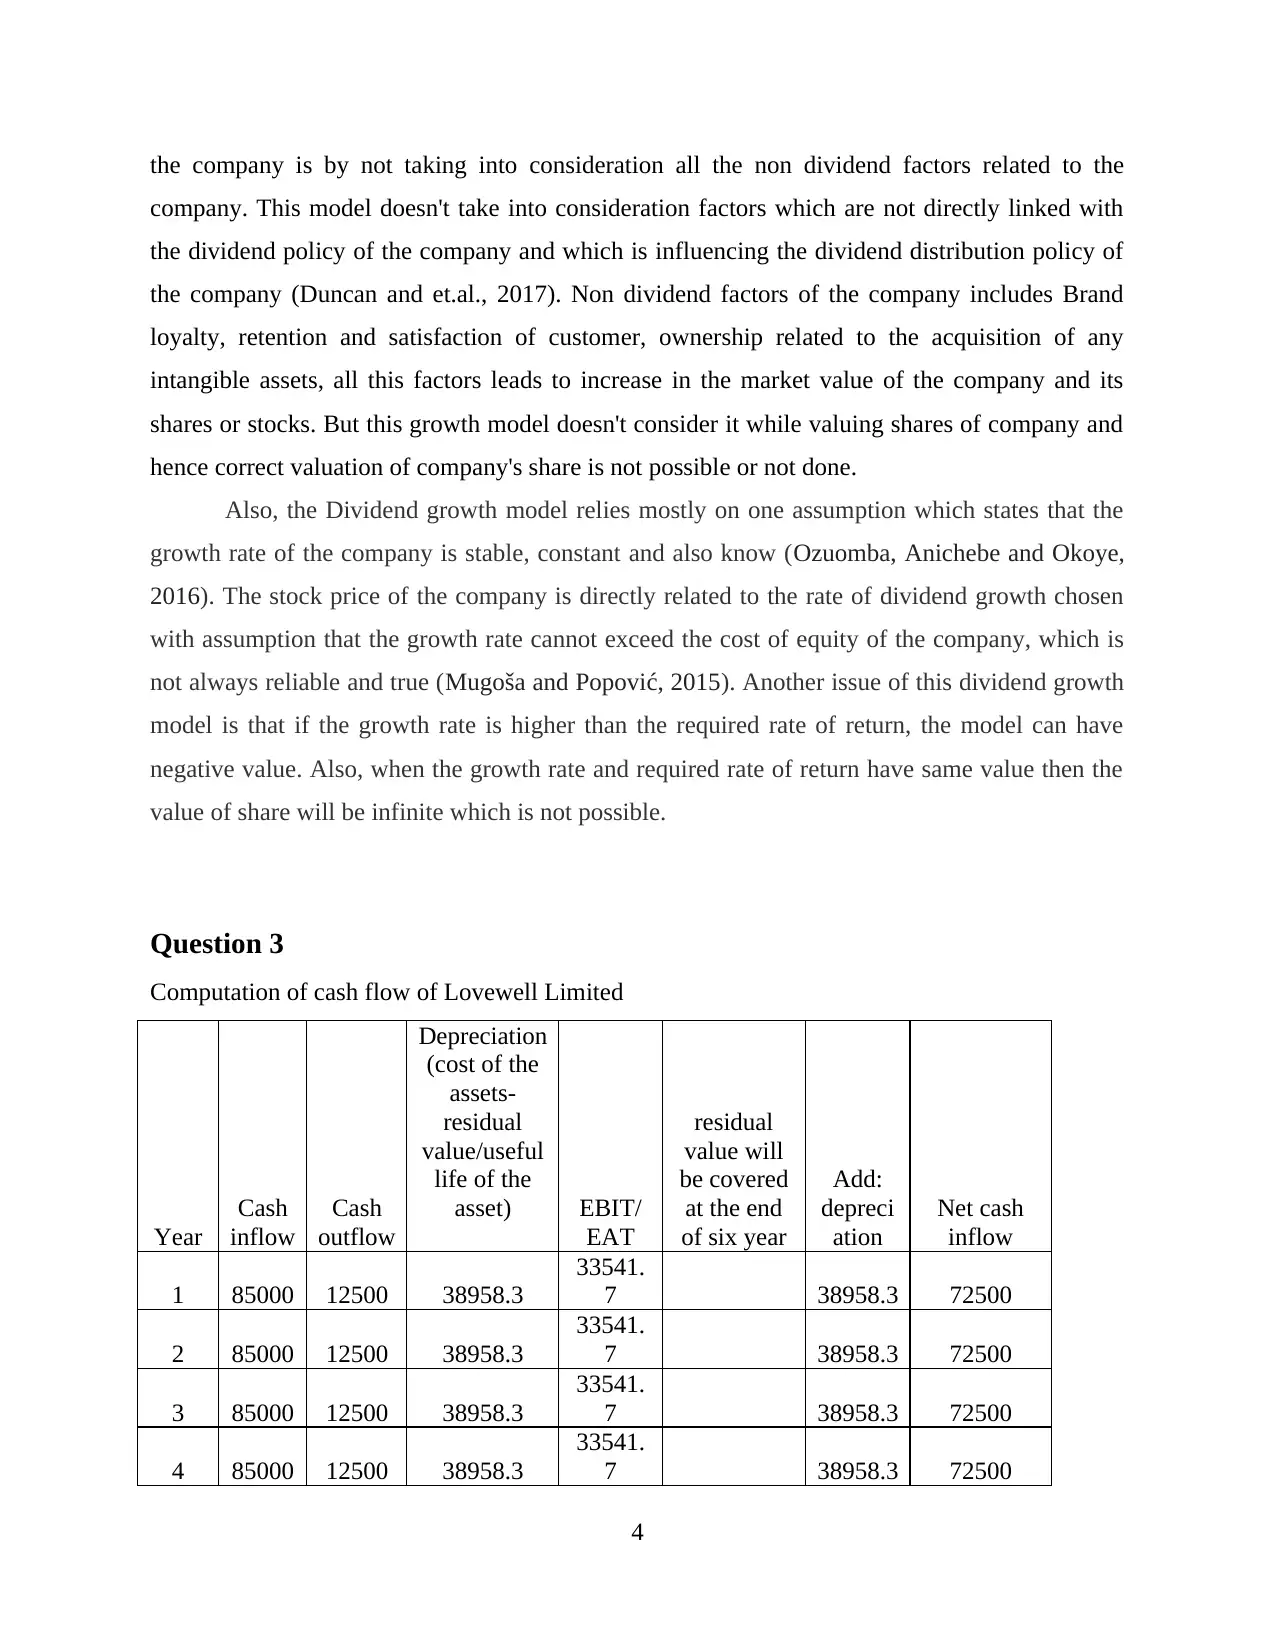
Question 3
Computation of cash flow of Lovewell Limited
Year
Cash
inflow
Cash
outflow
Depreciation
(cost of the
assets-
residual
value/useful
life of the
asset) EBIT/
EAT
residual
value will
be covered
at the end
of six year
Add:
depreci
ation
Net cash
inflow
1 85000 12500 38958.3
33541.
7 38958.3 72500
2 85000 12500 38958.3
33541.
7 38958.3 72500
3 85000 12500 38958.3
33541.
7 38958.3 72500
4 85000 12500 38958.3
33541.
7 38958.3 72500
4
company. This model doesn't take into consideration factors which are not directly linked with
the dividend policy of the company and which is influencing the dividend distribution policy of
the company (Duncan and et.al., 2017). Non dividend factors of the company includes Brand
loyalty, retention and satisfaction of customer, ownership related to the acquisition of any
intangible assets, all this factors leads to increase in the market value of the company and its
shares or stocks. But this growth model doesn't consider it while valuing shares of company and
hence correct valuation of company's share is not possible or not done.
Also, the Dividend growth model relies mostly on one assumption which states that the
growth rate of the company is stable, constant and also know (Ozuomba, Anichebe and Okoye,
2016). The stock price of the company is directly related to the rate of dividend growth chosen
with assumption that the growth rate cannot exceed the cost of equity of the company, which is
not always reliable and true (Mugoša and Popović, 2015). Another issue of this dividend growth
model is that if the growth rate is higher than the required rate of return, the model can have
negative value. Also, when the growth rate and required rate of return have same value then the
value of share will be infinite which is not possible.
Question 3
Computation of cash flow of Lovewell Limited
Year
Cash
inflow
Cash
outflow
Depreciation
(cost of the
assets-
residual
value/useful
life of the
asset) EBIT/
EAT
residual
value will
be covered
at the end
of six year
Add:
depreci
ation
Net cash
inflow
1 85000 12500 38958.3
33541.
7 38958.3 72500
2 85000 12500 38958.3
33541.
7 38958.3 72500
3 85000 12500 38958.3
33541.
7 38958.3 72500
4 85000 12500 38958.3
33541.
7 38958.3 72500
4
⊘ This is a preview!⊘
Do you want full access?
Subscribe today to unlock all pages.
Trusted by 1+ million students worldwide
5 85000 12500 38958.3
33541.
7 38958.3 72500
6 85000 12500 38958.3
33541.
7 41250 38958.3 113750
Interpretation- From the table the calculation relating to the cash flow is made where
the cash outflows are deducted from the cash inflows after making adjustments regarding the
depreciation. Earning after tax is evaluated as the deducting the depreciation from the cash
outflows then the cash outflows are subtracted from cash inflows. After this the depreciation
amount is added to the earnings for ascertaining the net cash inflows equates to $72500 for 5
years and in the end of the sixth year due to the addition of the residual value the amount resulted
as $113750.
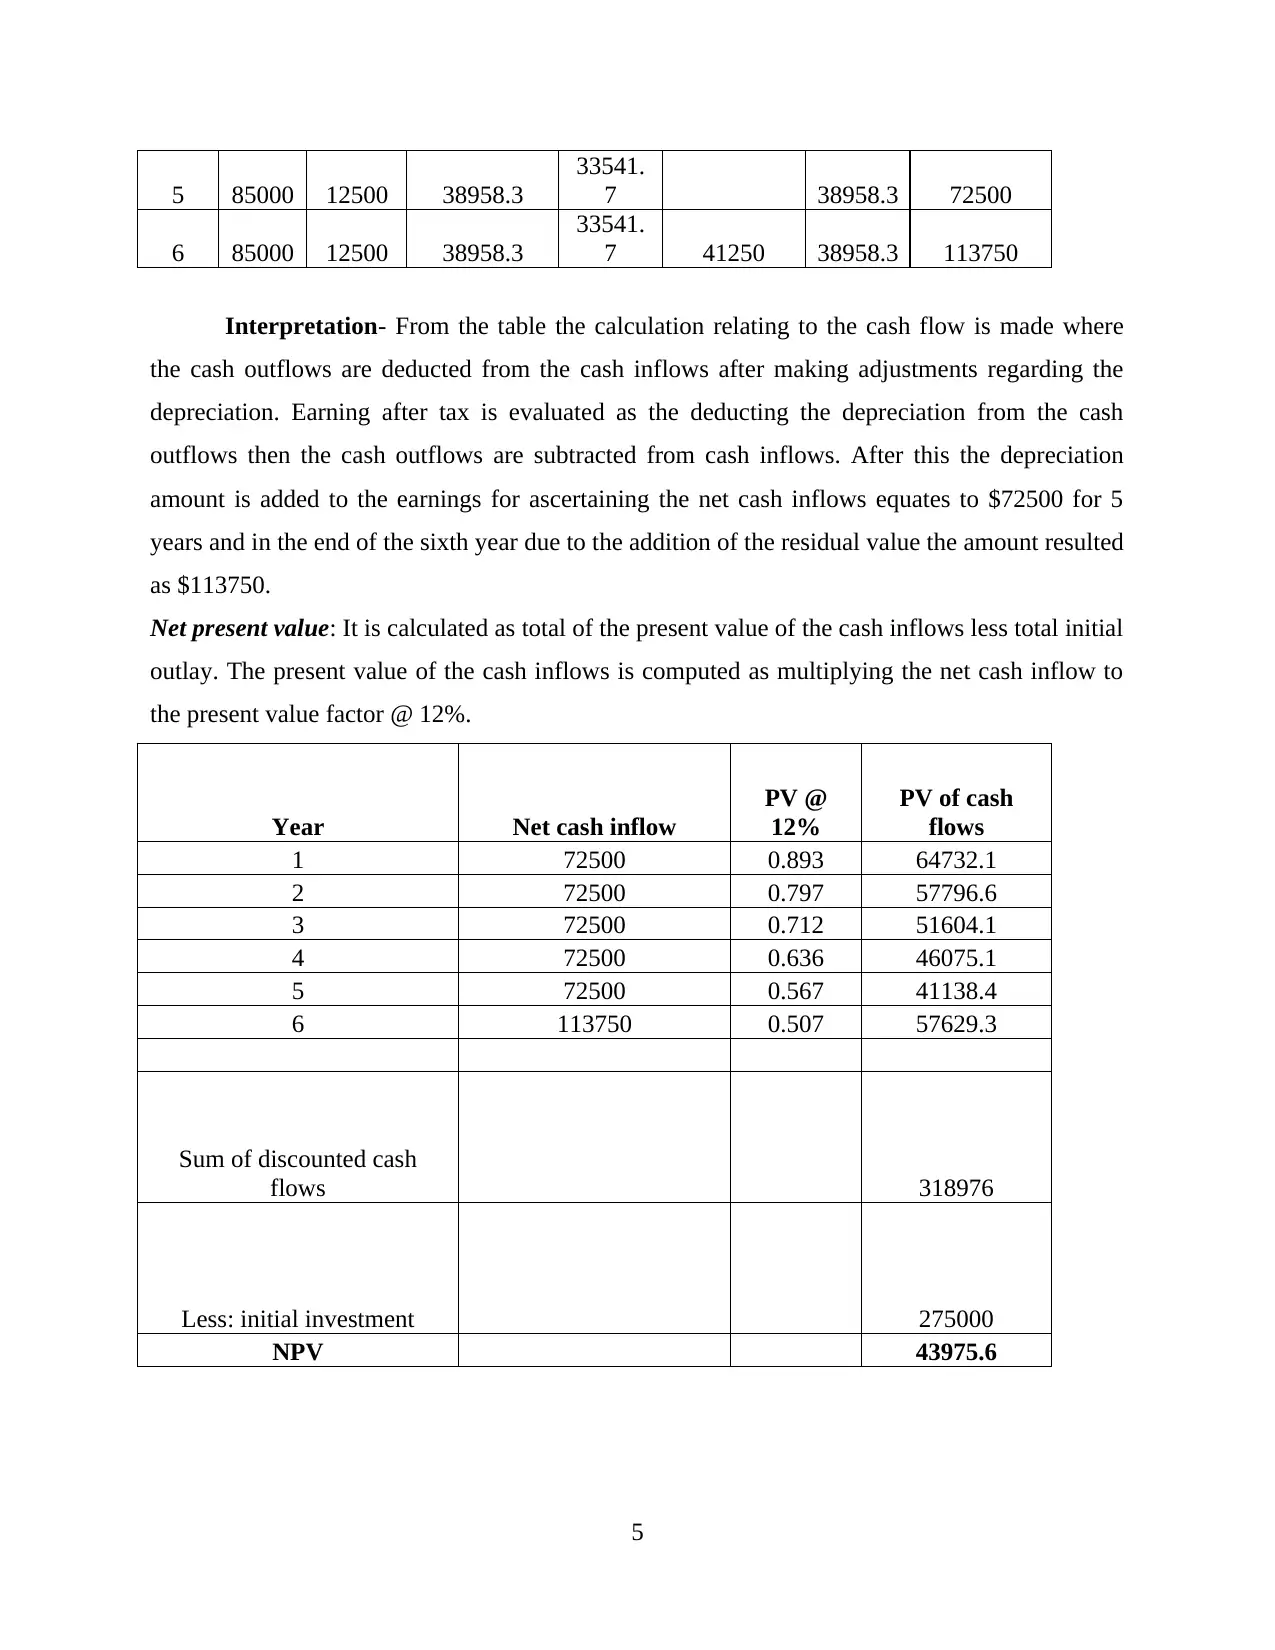
Net present value: It is calculated as total of the present value of the cash inflows less total initial
outlay. The present value of the cash inflows is computed as multiplying the net cash inflow to
the present value factor @ 12%.
Year Net cash inflow
PV @
12%
PV of cash
flows
1 72500 0.893 64732.1
2 72500 0.797 57796.6
3 72500 0.712 51604.1
4 72500 0.636 46075.1
5 72500 0.567 41138.4
6 113750 0.507 57629.3
Sum of discounted cash
flows 318976
Less: initial investment 275000
NPV 43975.6
5
33541.
7 38958.3 72500
6 85000 12500 38958.3
33541.
7 41250 38958.3 113750
Interpretation- From the table the calculation relating to the cash flow is made where
the cash outflows are deducted from the cash inflows after making adjustments regarding the
depreciation. Earning after tax is evaluated as the deducting the depreciation from the cash
outflows then the cash outflows are subtracted from cash inflows. After this the depreciation
amount is added to the earnings for ascertaining the net cash inflows equates to $72500 for 5
years and in the end of the sixth year due to the addition of the residual value the amount resulted
as $113750.
Net present value: It is calculated as total of the present value of the cash inflows less total initial
outlay. The present value of the cash inflows is computed as multiplying the net cash inflow to
the present value factor @ 12%.
Year Net cash inflow
PV @
12%
PV of cash
flows
1 72500 0.893 64732.1
2 72500 0.797 57796.6
3 72500 0.712 51604.1
4 72500 0.636 46075.1
5 72500 0.567 41138.4
6 113750 0.507 57629.3
Sum of discounted cash
flows 318976
Less: initial investment 275000
NPV 43975.6
5
Paraphrase This Document
Need a fresh take? Get an instant paraphrase of this document with our AI Paraphraser
Interpretation- The above table reflects the positive net present value which indicates that the
project will generate greater profits. Thus, the economic feasibility of the project of the Lovewell
is stating a positive return.
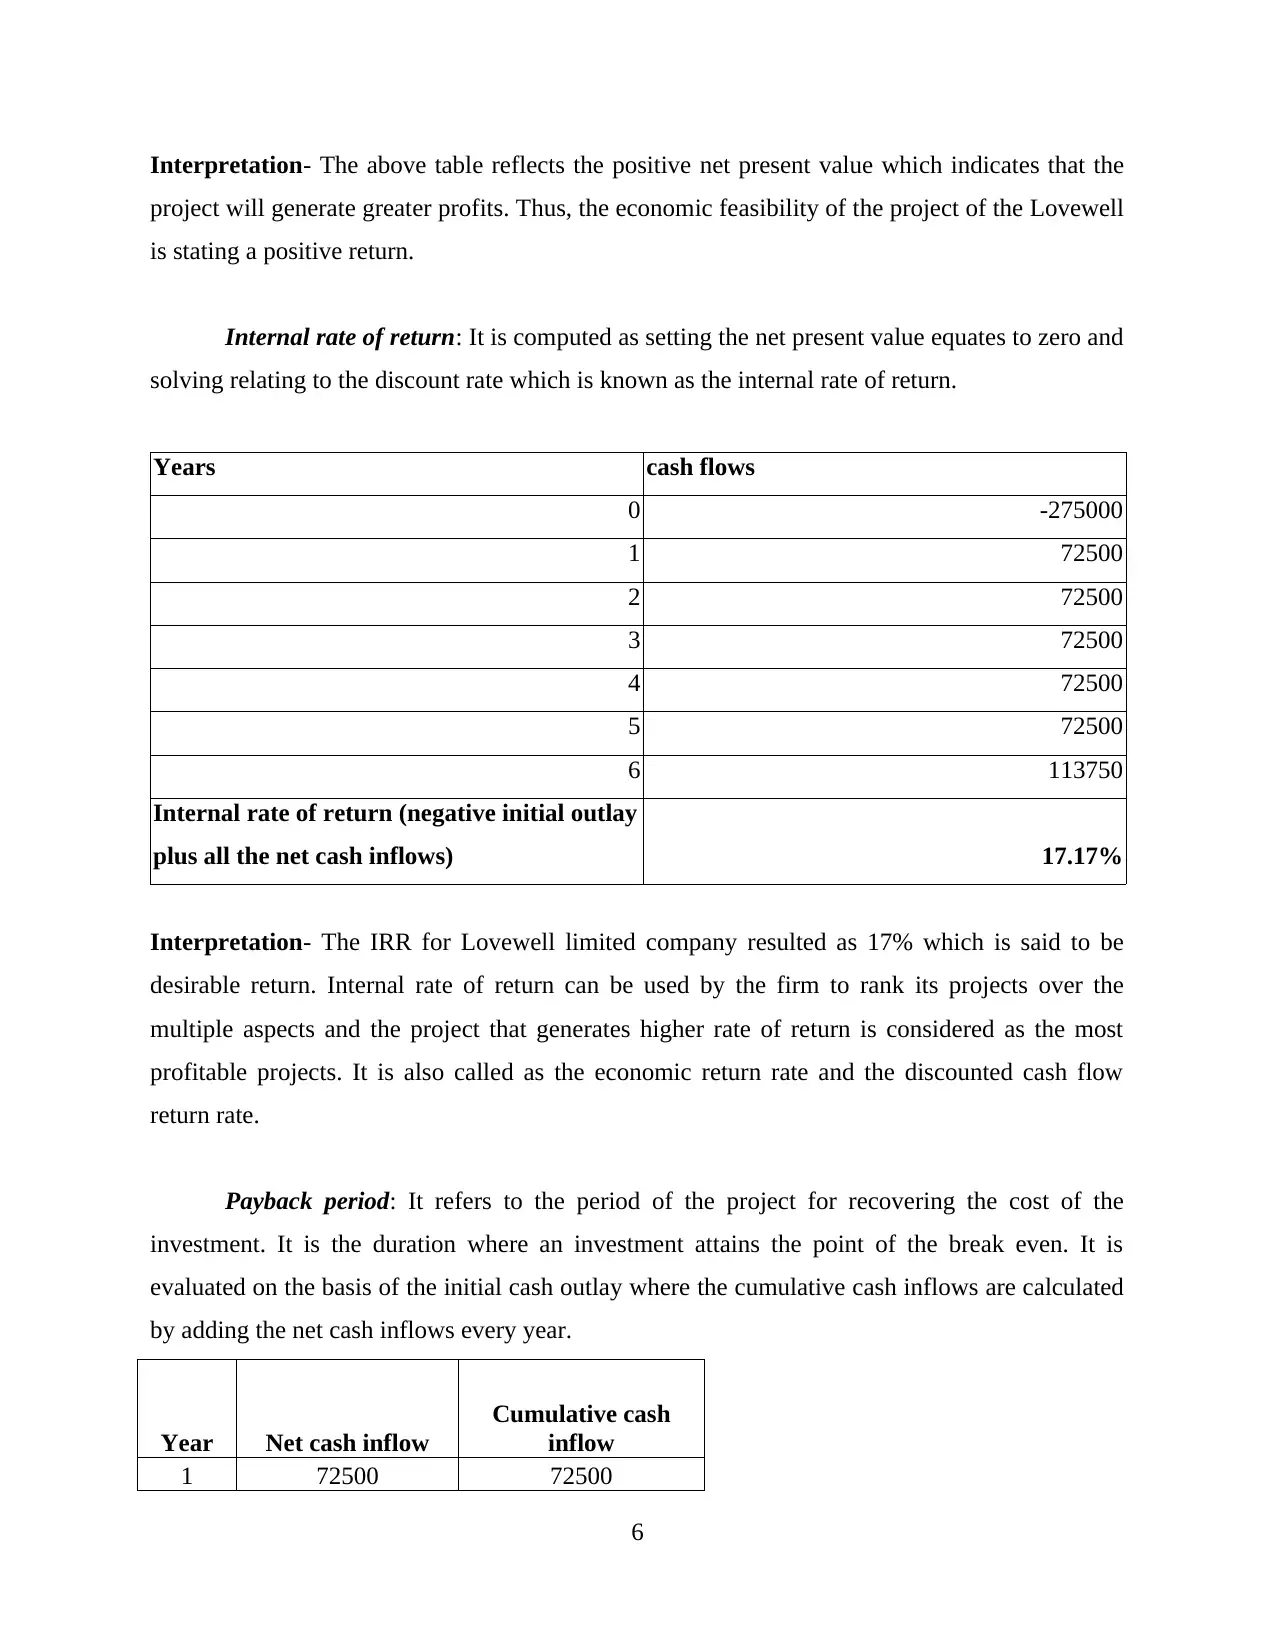
Internal rate of return: It is computed as setting the net present value equates to zero and
solving relating to the discount rate which is known as the internal rate of return.
Years cash flows
0 -275000
1 72500
2 72500
3 72500
4 72500
5 72500
6 113750
Internal rate of return (negative initial outlay
plus all the net cash inflows) 17.17%
Interpretation- The IRR for Lovewell limited company resulted as 17% which is said to be
desirable return. Internal rate of return can be used by the firm to rank its projects over the
multiple aspects and the project that generates higher rate of return is considered as the most
profitable projects. It is also called as the economic return rate and the discounted cash flow
return rate.
Payback period: It refers to the period of the project for recovering the cost of the
investment. It is the duration where an investment attains the point of the break even. It is
evaluated on the basis of the initial cash outlay where the cumulative cash inflows are calculated
by adding the net cash inflows every year.
Year Net cash inflow
Cumulative cash
inflow
1 72500 72500
6
project will generate greater profits. Thus, the economic feasibility of the project of the Lovewell
is stating a positive return.
Internal rate of return: It is computed as setting the net present value equates to zero and
solving relating to the discount rate which is known as the internal rate of return.
Years cash flows
0 -275000
1 72500
2 72500
3 72500
4 72500
5 72500
6 113750
Internal rate of return (negative initial outlay
plus all the net cash inflows) 17.17%
Interpretation- The IRR for Lovewell limited company resulted as 17% which is said to be
desirable return. Internal rate of return can be used by the firm to rank its projects over the
multiple aspects and the project that generates higher rate of return is considered as the most
profitable projects. It is also called as the economic return rate and the discounted cash flow
return rate.
Payback period: It refers to the period of the project for recovering the cost of the
investment. It is the duration where an investment attains the point of the break even. It is
evaluated on the basis of the initial cash outlay where the cumulative cash inflows are calculated
by adding the net cash inflows every year.
Year Net cash inflow
Cumulative cash
inflow
1 72500 72500
6
2 72500 145000
3 72500 217500
4 72500 290000
5 72500 362500
6 113750 476250
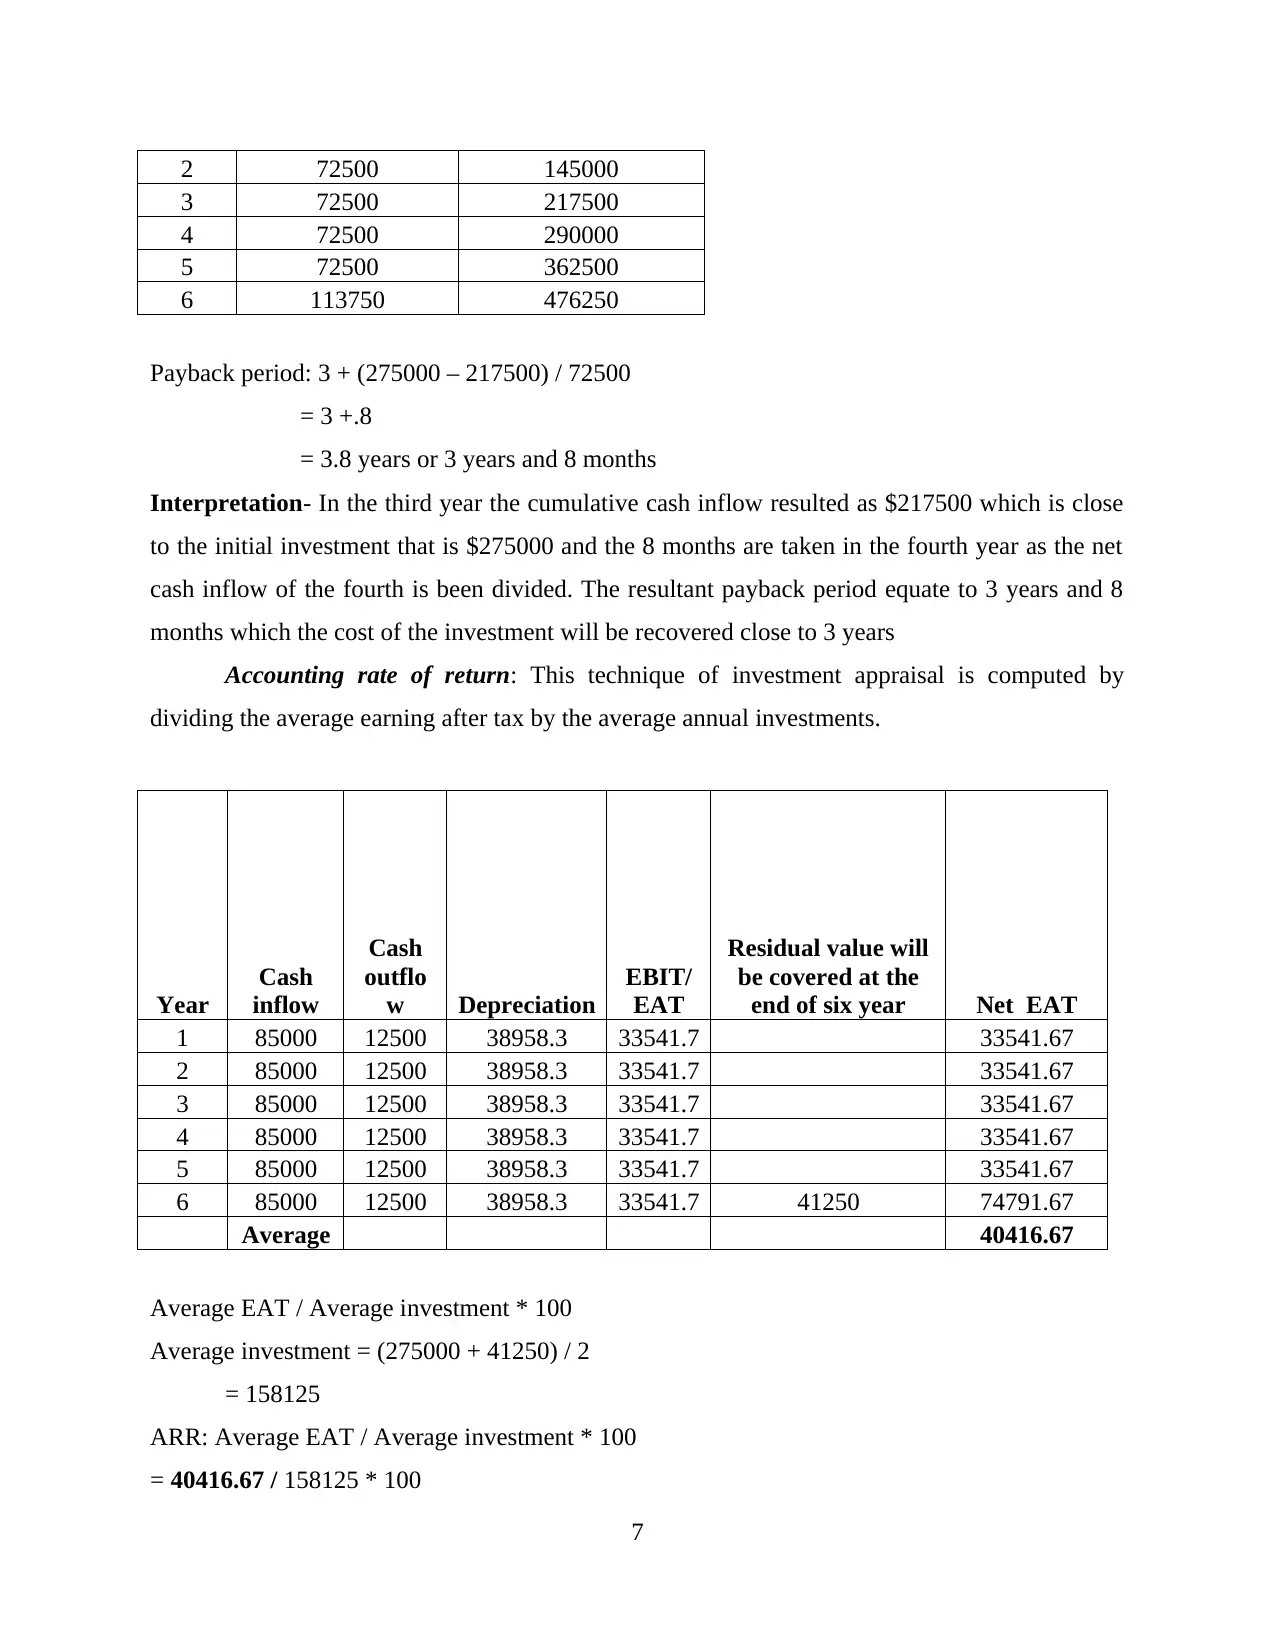
Payback period: 3 + (275000 – 217500) / 72500
= 3 +.8
= 3.8 years or 3 years and 8 months
Interpretation- In the third year the cumulative cash inflow resulted as $217500 which is close
to the initial investment that is $275000 and the 8 months are taken in the fourth year as the net
cash inflow of the fourth is been divided. The resultant payback period equate to 3 years and 8
months which the cost of the investment will be recovered close to 3 years
Accounting rate of return: This technique of investment appraisal is computed by
dividing the average earning after tax by the average annual investments.
Year
Cash
inflow
Cash
outflo
w Depreciation
EBIT/
EAT
Residual value will
be covered at the
end of six year Net EAT
1 85000 12500 38958.3 33541.7 33541.67
2 85000 12500 38958.3 33541.7 33541.67
3 85000 12500 38958.3 33541.7 33541.67
4 85000 12500 38958.3 33541.7 33541.67
5 85000 12500 38958.3 33541.7 33541.67
6 85000 12500 38958.3 33541.7 41250 74791.67
Average 40416.67
Average EAT / Average investment * 100
Average investment = (275000 + 41250) / 2
= 158125
ARR: Average EAT / Average investment * 100
= 40416.67 / 158125 * 100
7
3 72500 217500
4 72500 290000
5 72500 362500
6 113750 476250
Payback period: 3 + (275000 – 217500) / 72500
= 3 +.8
= 3.8 years or 3 years and 8 months
Interpretation- In the third year the cumulative cash inflow resulted as $217500 which is close
to the initial investment that is $275000 and the 8 months are taken in the fourth year as the net
cash inflow of the fourth is been divided. The resultant payback period equate to 3 years and 8
months which the cost of the investment will be recovered close to 3 years
Accounting rate of return: This technique of investment appraisal is computed by
dividing the average earning after tax by the average annual investments.
Year
Cash
inflow
Cash
outflo
w Depreciation
EBIT/
EAT
Residual value will
be covered at the
end of six year Net EAT
1 85000 12500 38958.3 33541.7 33541.67
2 85000 12500 38958.3 33541.7 33541.67
3 85000 12500 38958.3 33541.7 33541.67
4 85000 12500 38958.3 33541.7 33541.67
5 85000 12500 38958.3 33541.7 33541.67
6 85000 12500 38958.3 33541.7 41250 74791.67
Average 40416.67
Average EAT / Average investment * 100
Average investment = (275000 + 41250) / 2
= 158125
ARR: Average EAT / Average investment * 100
= 40416.67 / 158125 * 100
7
⊘ This is a preview!⊘
Do you want full access?
Subscribe today to unlock all pages.
Trusted by 1+ million students worldwide
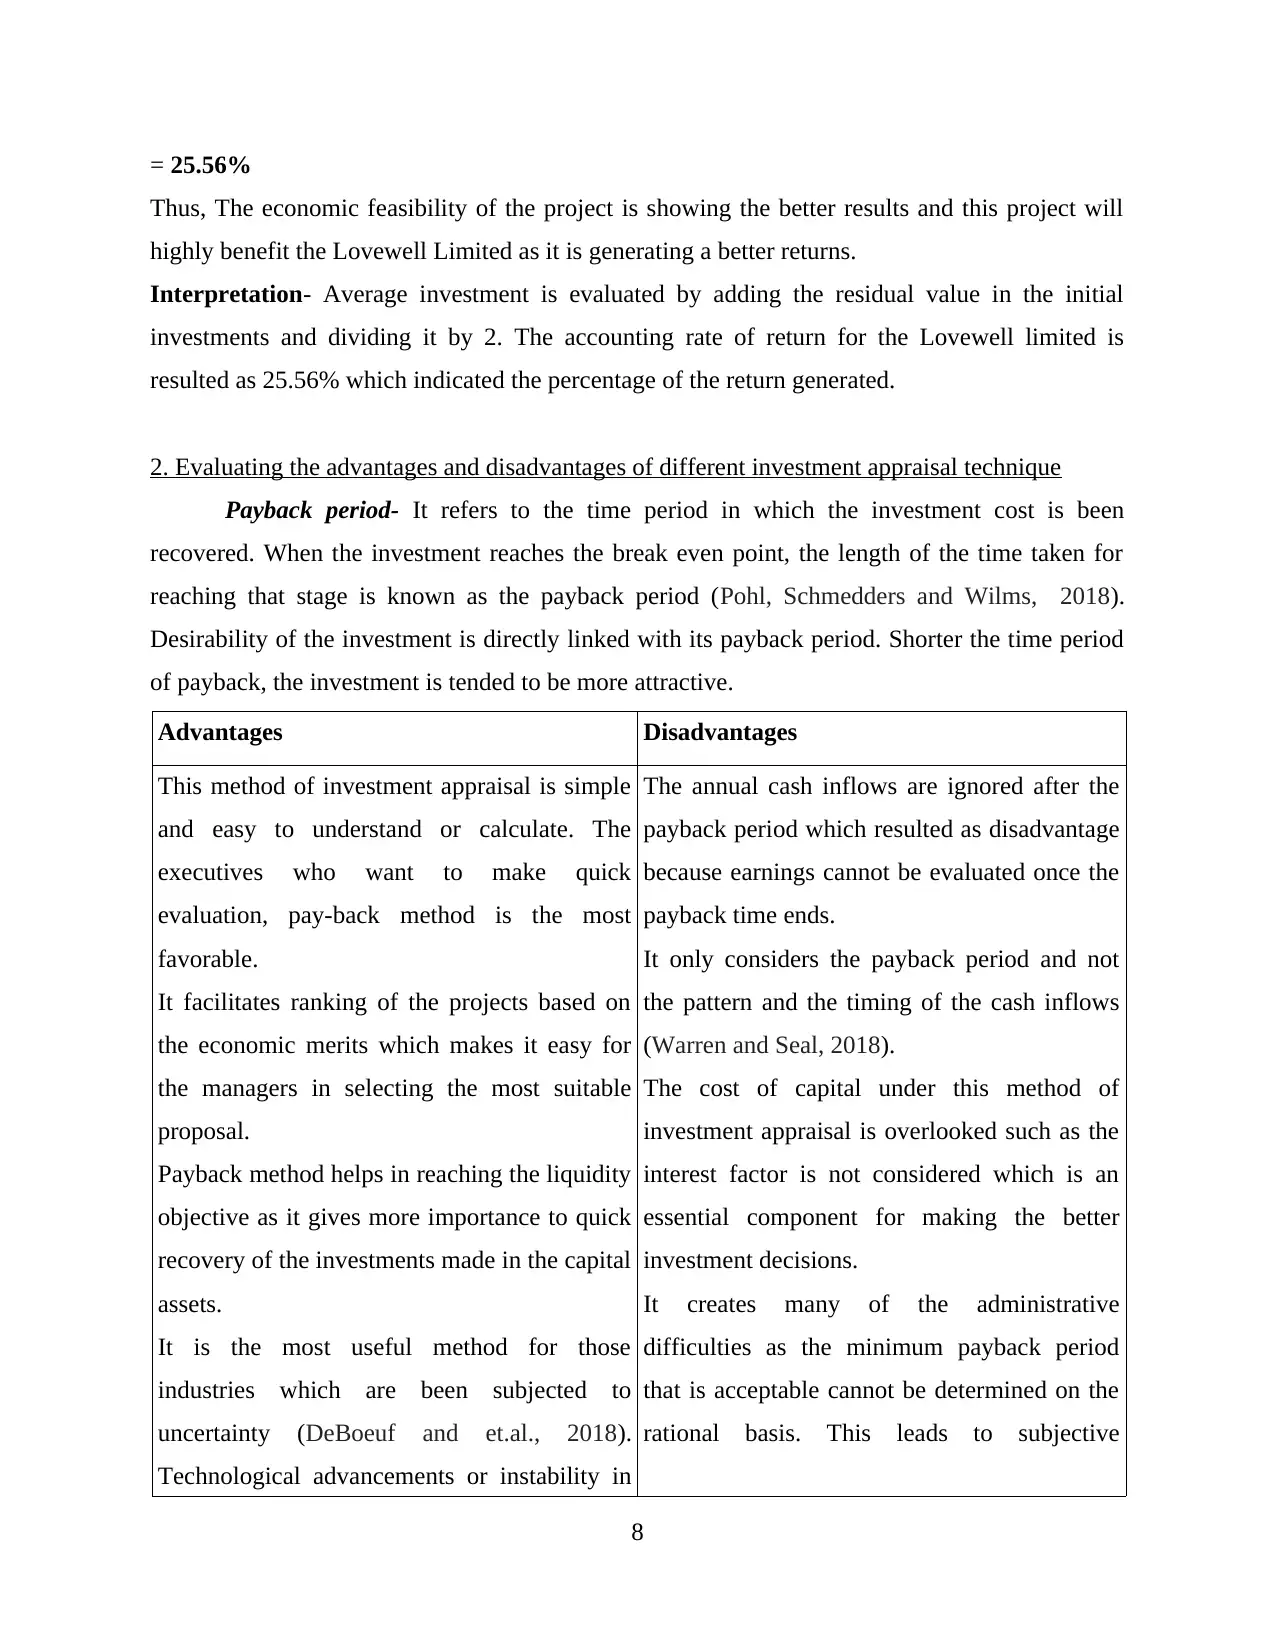
= 25.56%
Thus, The economic feasibility of the project is showing the better results and this project will
highly benefit the Lovewell Limited as it is generating a better returns.
Interpretation- Average investment is evaluated by adding the residual value in the initial
investments and dividing it by 2. The accounting rate of return for the Lovewell limited is
resulted as 25.56% which indicated the percentage of the return generated.
2. Evaluating the advantages and disadvantages of different investment appraisal technique
Payback period- It refers to the time period in which the investment cost is been
recovered. When the investment reaches the break even point, the length of the time taken for
reaching that stage is known as the payback period (Pohl, Schmedders and Wilms, 2018).
Desirability of the investment is directly linked with its payback period. Shorter the time period
of payback, the investment is tended to be more attractive.
Advantages Disadvantages
This method of investment appraisal is simple
and easy to understand or calculate. The
executives who want to make quick
evaluation, pay-back method is the most
favorable.
It facilitates ranking of the projects based on
the economic merits which makes it easy for
the managers in selecting the most suitable
proposal.
Payback method helps in reaching the liquidity
objective as it gives more importance to quick
recovery of the investments made in the capital
assets.
It is the most useful method for those
industries which are been subjected to
uncertainty (DeBoeuf and et.al., 2018).
Technological advancements or instability in
The annual cash inflows are ignored after the
payback period which resulted as disadvantage
because earnings cannot be evaluated once the
payback time ends.
It only considers the payback period and not
the pattern and the timing of the cash inflows
(Warren and Seal, 2018).
The cost of capital under this method of
investment appraisal is overlooked such as the
interest factor is not considered which is an
essential component for making the better
investment decisions.
It creates many of the administrative
difficulties as the minimum payback period
that is acceptable cannot be determined on the
rational basis. This leads to subjective
8
Paraphrase This Document
Need a fresh take? Get an instant paraphrase of this document with our AI Paraphraser
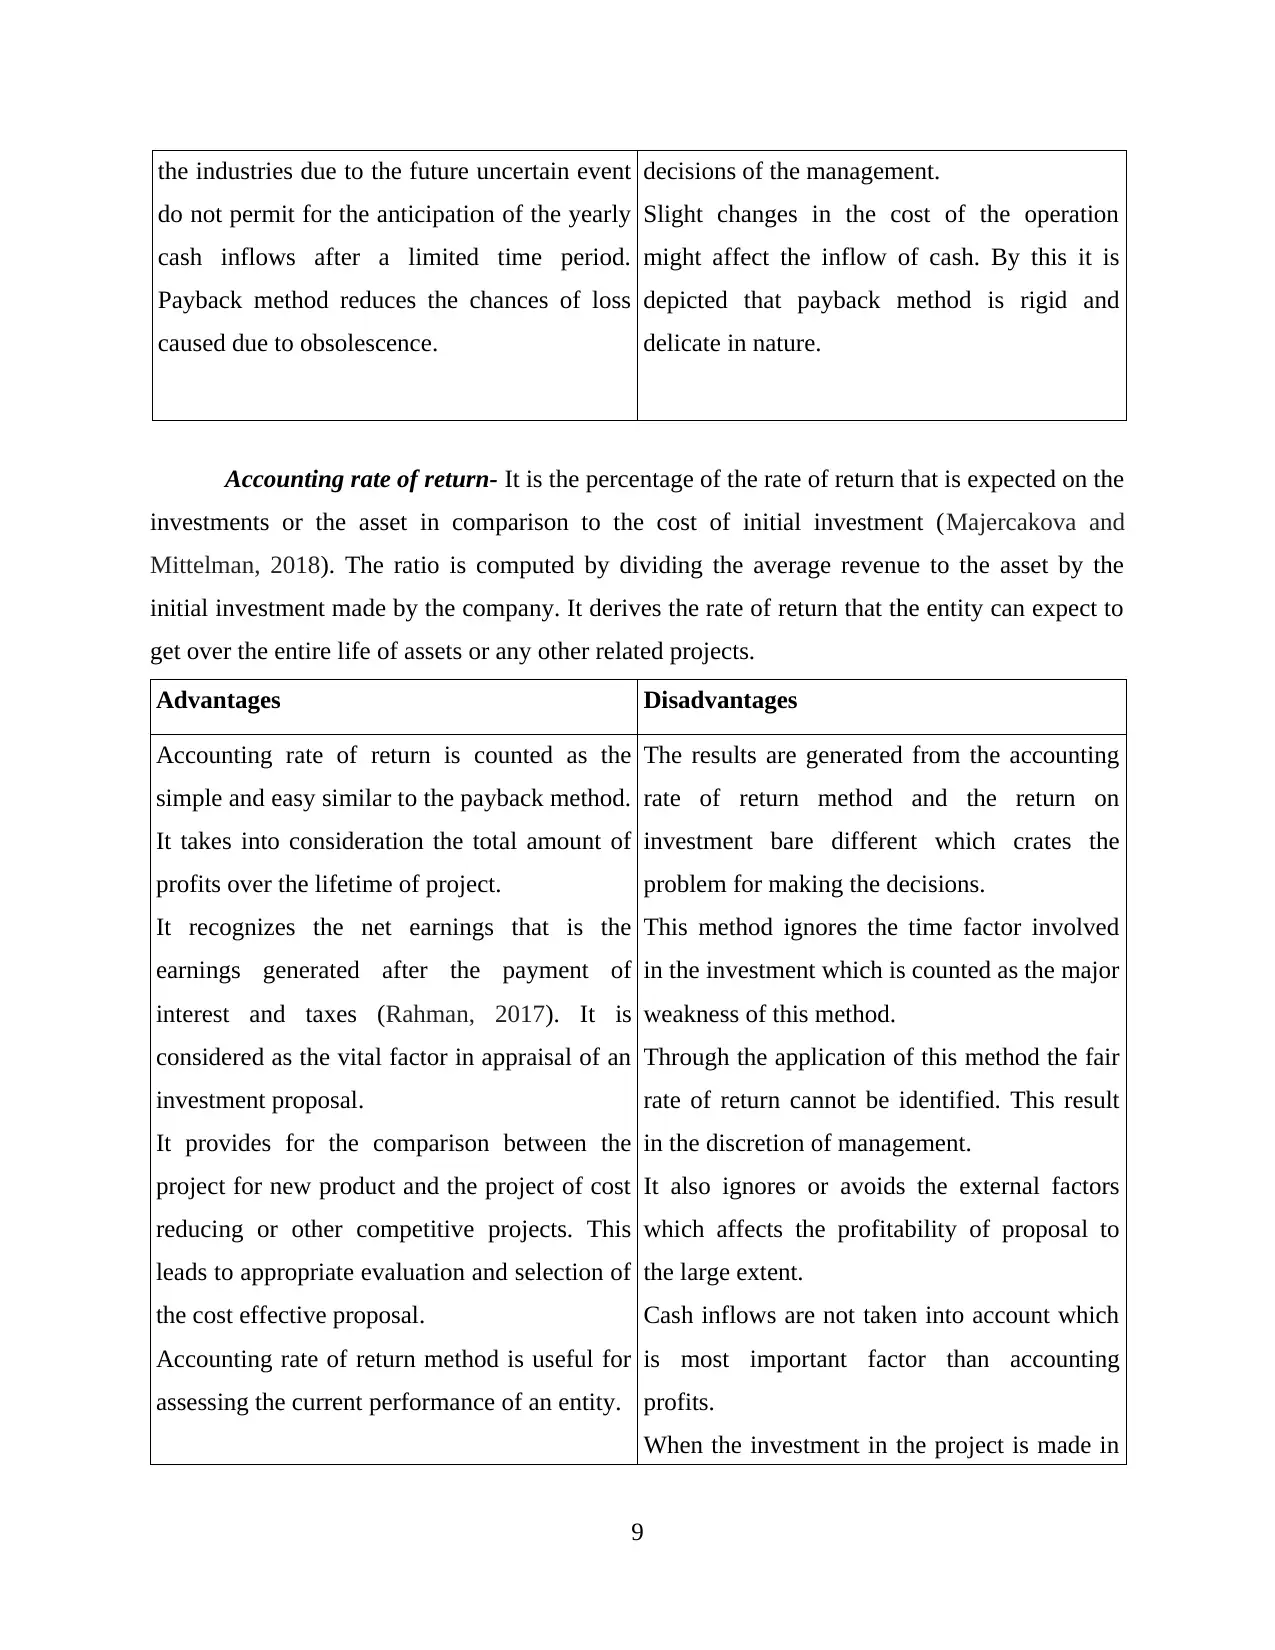
the industries due to the future uncertain event
do not permit for the anticipation of the yearly
cash inflows after a limited time period.
Payback method reduces the chances of loss
caused due to obsolescence.
decisions of the management.
Slight changes in the cost of the operation
might affect the inflow of cash. By this it is
depicted that payback method is rigid and
delicate in nature.
Accounting rate of return- It is the percentage of the rate of return that is expected on the
investments or the asset in comparison to the cost of initial investment (Majercakova and
Mittelman, 2018). The ratio is computed by dividing the average revenue to the asset by the
initial investment made by the company. It derives the rate of return that the entity can expect to
get over the entire life of assets or any other related projects.
Advantages Disadvantages
Accounting rate of return is counted as the
simple and easy similar to the payback method.
It takes into consideration the total amount of
profits over the lifetime of project.
It recognizes the net earnings that is the
earnings generated after the payment of
interest and taxes (Rahman, 2017). It is
considered as the vital factor in appraisal of an
investment proposal.
It provides for the comparison between the
project for new product and the project of cost
reducing or other competitive projects. This
leads to appropriate evaluation and selection of
the cost effective proposal.
Accounting rate of return method is useful for
assessing the current performance of an entity.
The results are generated from the accounting
rate of return method and the return on
investment bare different which crates the
problem for making the decisions.
This method ignores the time factor involved
in the investment which is counted as the major
weakness of this method.
Through the application of this method the fair
rate of return cannot be identified. This result
in the discretion of management.
It also ignores or avoids the external factors
which affects the profitability of proposal to
the large extent.
Cash inflows are not taken into account which
is most important factor than accounting
profits.
When the investment in the project is made in
9
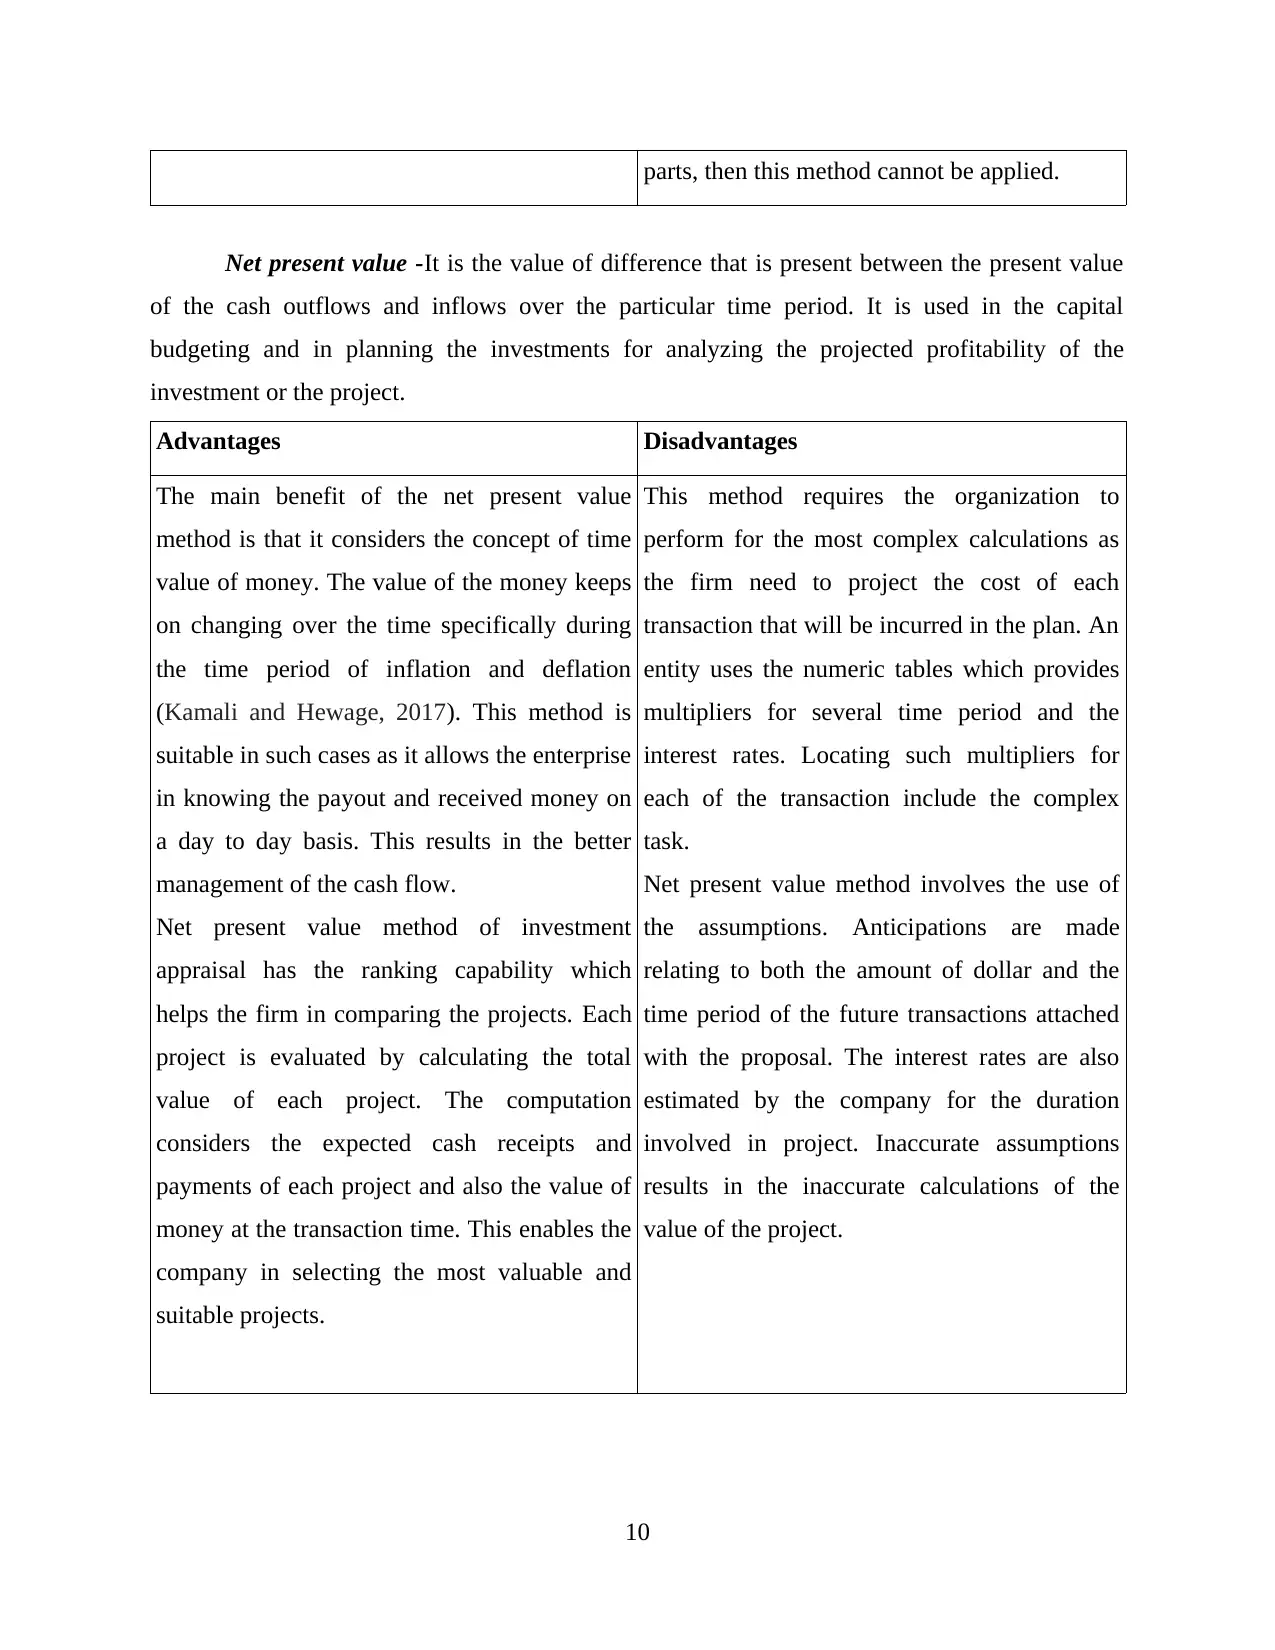
parts, then this method cannot be applied.
Net present value -It is the value of difference that is present between the present value
of the cash outflows and inflows over the particular time period. It is used in the capital
budgeting and in planning the investments for analyzing the projected profitability of the
investment or the project.
Advantages Disadvantages
The main benefit of the net present value
method is that it considers the concept of time
value of money. The value of the money keeps
on changing over the time specifically during
the time period of inflation and deflation
(Kamali and Hewage, 2017). This method is
suitable in such cases as it allows the enterprise
in knowing the payout and received money on
a day to day basis. This results in the better
management of the cash flow.
Net present value method of investment
appraisal has the ranking capability which
helps the firm in comparing the projects. Each
project is evaluated by calculating the total
value of each project. The computation
considers the expected cash receipts and
payments of each project and also the value of
money at the transaction time. This enables the
company in selecting the most valuable and
suitable projects.
This method requires the organization to
perform for the most complex calculations as
the firm need to project the cost of each
transaction that will be incurred in the plan. An
entity uses the numeric tables which provides
multipliers for several time period and the
interest rates. Locating such multipliers for
each of the transaction include the complex
task.
Net present value method involves the use of
the assumptions. Anticipations are made
relating to both the amount of dollar and the
time period of the future transactions attached
with the proposal. The interest rates are also
estimated by the company for the duration
involved in project. Inaccurate assumptions
results in the inaccurate calculations of the
value of the project.
10
⊘ This is a preview!⊘
Do you want full access?
Subscribe today to unlock all pages.
Trusted by 1+ million students worldwide
1 out of 15
Related Documents


Your All-in-One AI-Powered Toolkit for Academic Success.
+13062052269
info@desklib.com
Available 24*7 on WhatsApp / Email
![[object Object]](/_next/static/media/star-bottom.7253800d.svg)
Unlock your academic potential
Copyright © 2020–2026 A2Z Services. All Rights Reserved. Developed and managed by ZUCOL.