University Management Accounting: Financial Analysis and Budget Report
VerifiedAdded on 2021/05/31
|17
|2886
|111
Report
AI Summary
This report presents a comprehensive financial analysis of a company, encompassing profitability, liquidity, and asset utilization. It begins with an introduction outlining the report's objectives, the purpose of financial analysis, and the report's structure. The analysis includes the calculation and evaluation of various financial ratios, such as profitability (gross profit, net profit), liquidity (current, quick, and debt-equity ratios), inventory turnover, and accounts receivable. The report evaluates the business's profitability, financial stability, and asset utilization, providing detailed figures and comparisons. Recommendations are offered to improve sales, reduce debt, and optimize asset allocation. The report concludes with a summary of key findings, limitations of financial analysis, and a list of references. The report also includes a budget and addresses variances in projected sales and cost of goods.
Running head: MANAGEMENT ACCOUNTING
Management Accounting
Name of Student:
Name of University:
Author’s Note:
Management Accounting
Name of Student:
Name of University:
Author’s Note:
Paraphrase This Document
Need a fresh take? Get an instant paraphrase of this document with our AI Paraphraser
1MANAGEMENT ACCOUNTING
Table of Contents
Requirement One- Financial Analysis Report.................................................................................3
1. Introduction..................................................................................................................................3
a. Objective of the report.............................................................................................................3
b. Purpose of financial analysis...................................................................................................3
c. Description on the structure of report......................................................................................3
2. Financial Analysis.......................................................................................................................3
a. Calculation of the financial ratios............................................................................................4
i. Profitability Ratios................................................................................................................4
ii. Liquidity Ratios...................................................................................................................4
iii. Inventory Turnover ratios...................................................................................................4
iv. Accounts receivable ratio...................................................................................................5
b. Analysis and evaluation of the business’ profitability.............................................................6
c. Analysis and evaluation of business’ financial stability..........................................................7
d. Analysis and evaluation on the business’ asset utilisation......................................................8
Recommendations............................................................................................................................8
Conclusion.......................................................................................................................................8
a. Summarization of key points from the previous sections........................................................8
b. Limitations of financial analysis..............................................................................................9
References......................................................................................................................................10
Requirement Two – Budget...........................................................................................................11
Requirement Three- Financial Analysis Report............................................................................11
Part a and Part b.........................................................................................................................11
2MANAGEMENT ACCOUNTING
Part c..........................................................................................................................................11
Requirement Four – CVP..............................................................................................................11
Part a..........................................................................................................................................11
Part b..........................................................................................................................................12
Part c and Part d.........................................................................................................................13
List of Appendix- Budget..............................................................................................................14
⊘ This is a preview!⊘
Do you want full access?
Subscribe today to unlock all pages.
Trusted by 1+ million students worldwide
3MANAGEMENT ACCOUNTING
Requirement One- Financial Analysis Report
1. Introduction
a. Objective of the report
The reports intend to conduct a financial analysis calculating the various types of the
financial ratios such as gross profit., net profit and return on equity. Some of the liquid ratio
analysis has been performed with the evaluating of the current ratio, quick ratio and the
conduction of the equity ratio. The next aspect of the ratio analysis has conducted the ratio
analysis of the accounts receivable. This section of the report has bee seen to be followed by the
various types of the others discourse of the report which has been seen to be related to the
evaluation of the business profitability. The next important aspect of the report has been further
seen to be based on the conduction of the various aspects of the financial stability along with the
evaluating the business asset utilization.
b. Purpose of financial analysis
The main purpose of the financial analysis will be able to state on the facility of the
liquidity, efficiency and profitability of the company.
c. Description on the structure of report
The structure of the report has been divided into four main categories including several
types of the subsections in the study. The first discussion of the study has been seen to focus on
the main form of the evaluation of the financial ratios. The second subsection of the first part of
the report has been seen to be related to the conduction of the profitability analysis of the
company, evaluation of the nosiness financial stability and analysis of the business asset
utilization. The third section of the report has stated on recommendation which has been abet to
state on the relevant nature of the scope of the future financial improvements.
2. Financial Analysis
Paraphrase This Document
Need a fresh take? Get an instant paraphrase of this document with our AI Paraphraser
4MANAGEMENT ACCOUNTING
a. Calculation of the financial ratios
i. Profitability Ratios
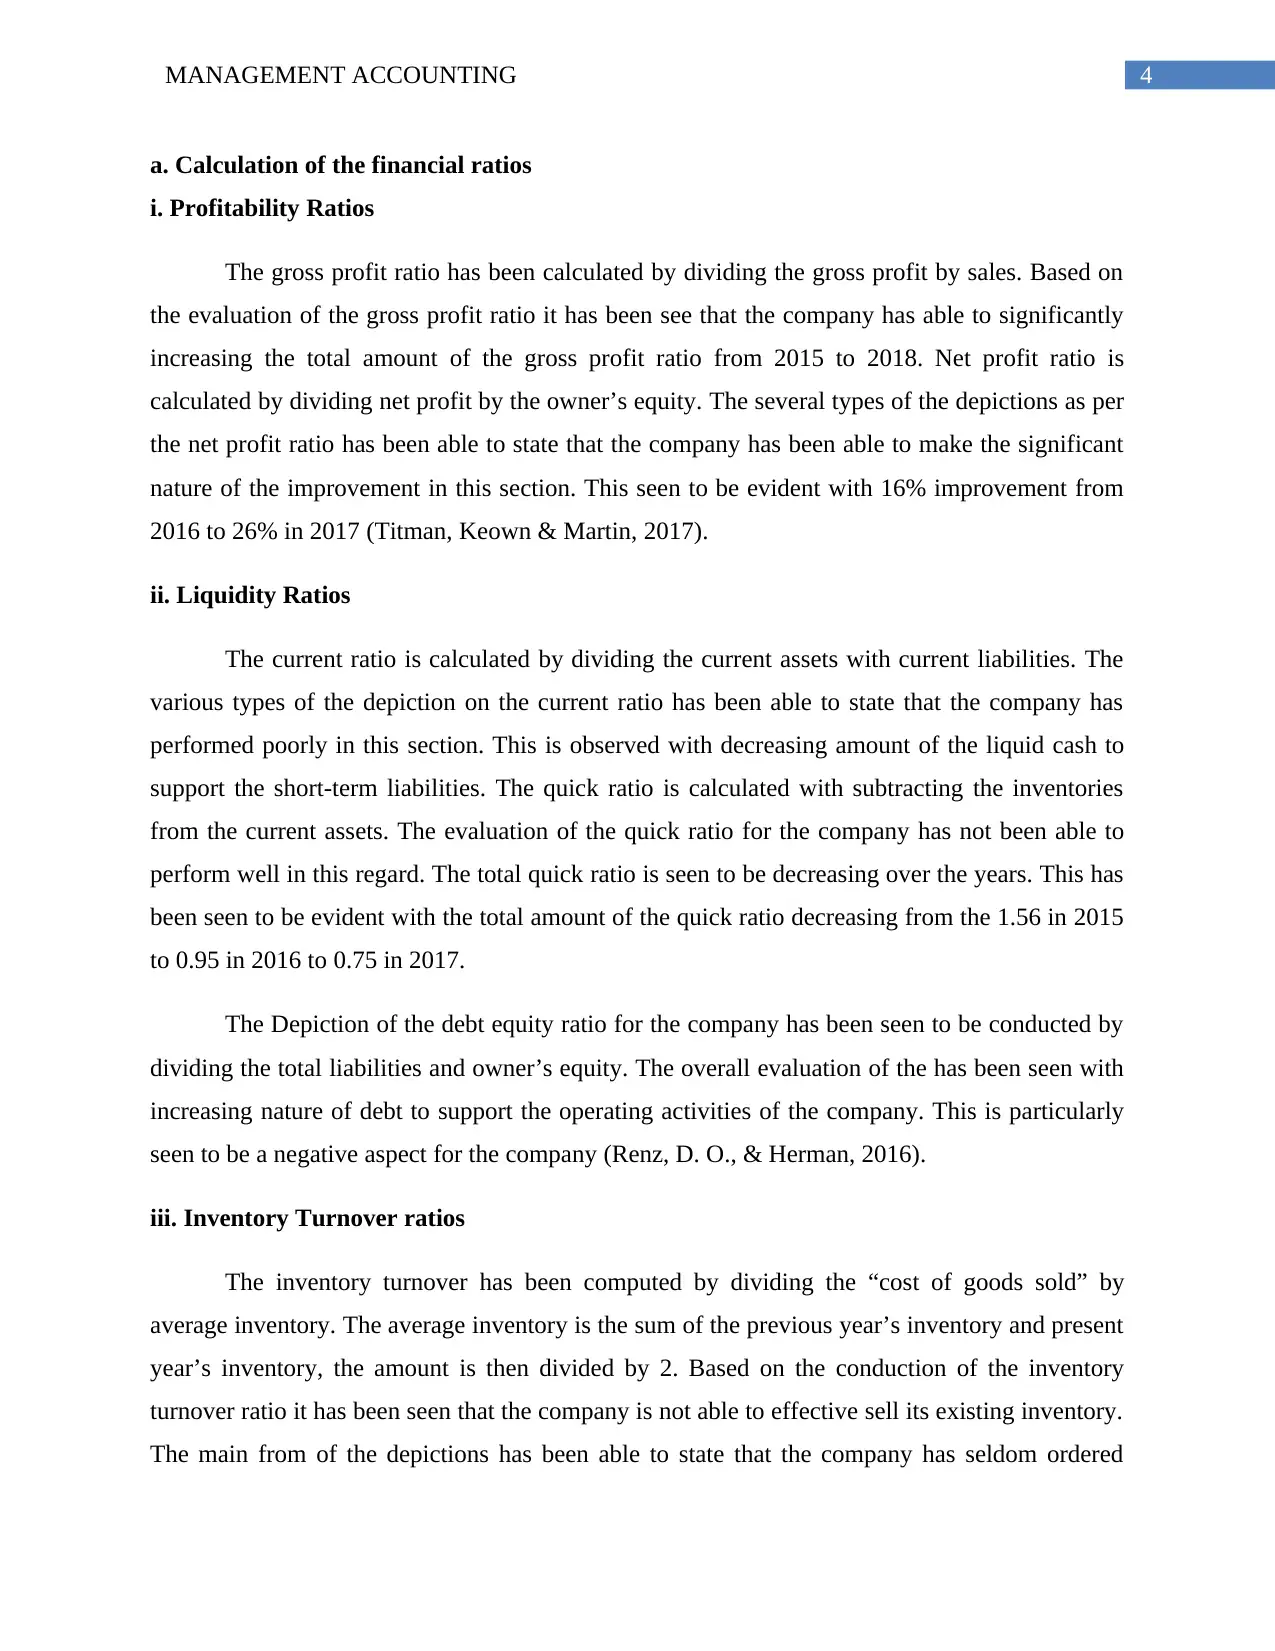
The gross profit ratio has been calculated by dividing the gross profit by sales. Based on
the evaluation of the gross profit ratio it has been see that the company has able to significantly
increasing the total amount of the gross profit ratio from 2015 to 2018. Net profit ratio is
calculated by dividing net profit by the owner’s equity. The several types of the depictions as per
the net profit ratio has been able to state that the company has been able to make the significant
nature of the improvement in this section. This seen to be evident with 16% improvement from
2016 to 26% in 2017 (Titman, Keown & Martin, 2017).
ii. Liquidity Ratios
The current ratio is calculated by dividing the current assets with current liabilities. The
various types of the depiction on the current ratio has been able to state that the company has
performed poorly in this section. This is observed with decreasing amount of the liquid cash to
support the short-term liabilities. The quick ratio is calculated with subtracting the inventories
from the current assets. The evaluation of the quick ratio for the company has not been able to
perform well in this regard. The total quick ratio is seen to be decreasing over the years. This has
been seen to be evident with the total amount of the quick ratio decreasing from the 1.56 in 2015
to 0.95 in 2016 to 0.75 in 2017.
The Depiction of the debt equity ratio for the company has been seen to be conducted by
dividing the total liabilities and owner’s equity. The overall evaluation of the has been seen with
increasing nature of debt to support the operating activities of the company. This is particularly
seen to be a negative aspect for the company (Renz, D. O., & Herman, 2016).
iii. Inventory Turnover ratios
The inventory turnover has been computed by dividing the “cost of goods sold” by
average inventory. The average inventory is the sum of the previous year’s inventory and present
year’s inventory, the amount is then divided by 2. Based on the conduction of the inventory
turnover ratio it has been seen that the company is not able to effective sell its existing inventory.
The main from of the depictions has been able to state that the company has seldom ordered
a. Calculation of the financial ratios
i. Profitability Ratios
The gross profit ratio has been calculated by dividing the gross profit by sales. Based on
the evaluation of the gross profit ratio it has been see that the company has able to significantly
increasing the total amount of the gross profit ratio from 2015 to 2018. Net profit ratio is
calculated by dividing net profit by the owner’s equity. The several types of the depictions as per
the net profit ratio has been able to state that the company has been able to make the significant
nature of the improvement in this section. This seen to be evident with 16% improvement from
2016 to 26% in 2017 (Titman, Keown & Martin, 2017).
ii. Liquidity Ratios
The current ratio is calculated by dividing the current assets with current liabilities. The
various types of the depiction on the current ratio has been able to state that the company has
performed poorly in this section. This is observed with decreasing amount of the liquid cash to
support the short-term liabilities. The quick ratio is calculated with subtracting the inventories
from the current assets. The evaluation of the quick ratio for the company has not been able to
perform well in this regard. The total quick ratio is seen to be decreasing over the years. This has
been seen to be evident with the total amount of the quick ratio decreasing from the 1.56 in 2015
to 0.95 in 2016 to 0.75 in 2017.
The Depiction of the debt equity ratio for the company has been seen to be conducted by
dividing the total liabilities and owner’s equity. The overall evaluation of the has been seen with
increasing nature of debt to support the operating activities of the company. This is particularly
seen to be a negative aspect for the company (Renz, D. O., & Herman, 2016).
iii. Inventory Turnover ratios
The inventory turnover has been computed by dividing the “cost of goods sold” by
average inventory. The average inventory is the sum of the previous year’s inventory and present
year’s inventory, the amount is then divided by 2. Based on the conduction of the inventory
turnover ratio it has been seen that the company is not able to effective sell its existing inventory.
The main from of the depictions has been able to state that the company has seldom ordered
5MANAGEMENT ACCOUNTING
form new stock in 2017 and 2018. Henceforth, it needs to pay more heed to increase the overall
amount of the times the inventory is freshly ordered. The conduction of the various types of the
analysis on the inventory turnover in days has been further able to depict that the company has
performed poorly in this section. This has been significantly stated with more number of days
requiring for the company to replenish the present inventory. The different types of the
conduction of the information in this aspect has been seen to be directly relevant to the different
types of information on the efficiency of the company (Bekaert & Hodrick, 2017).
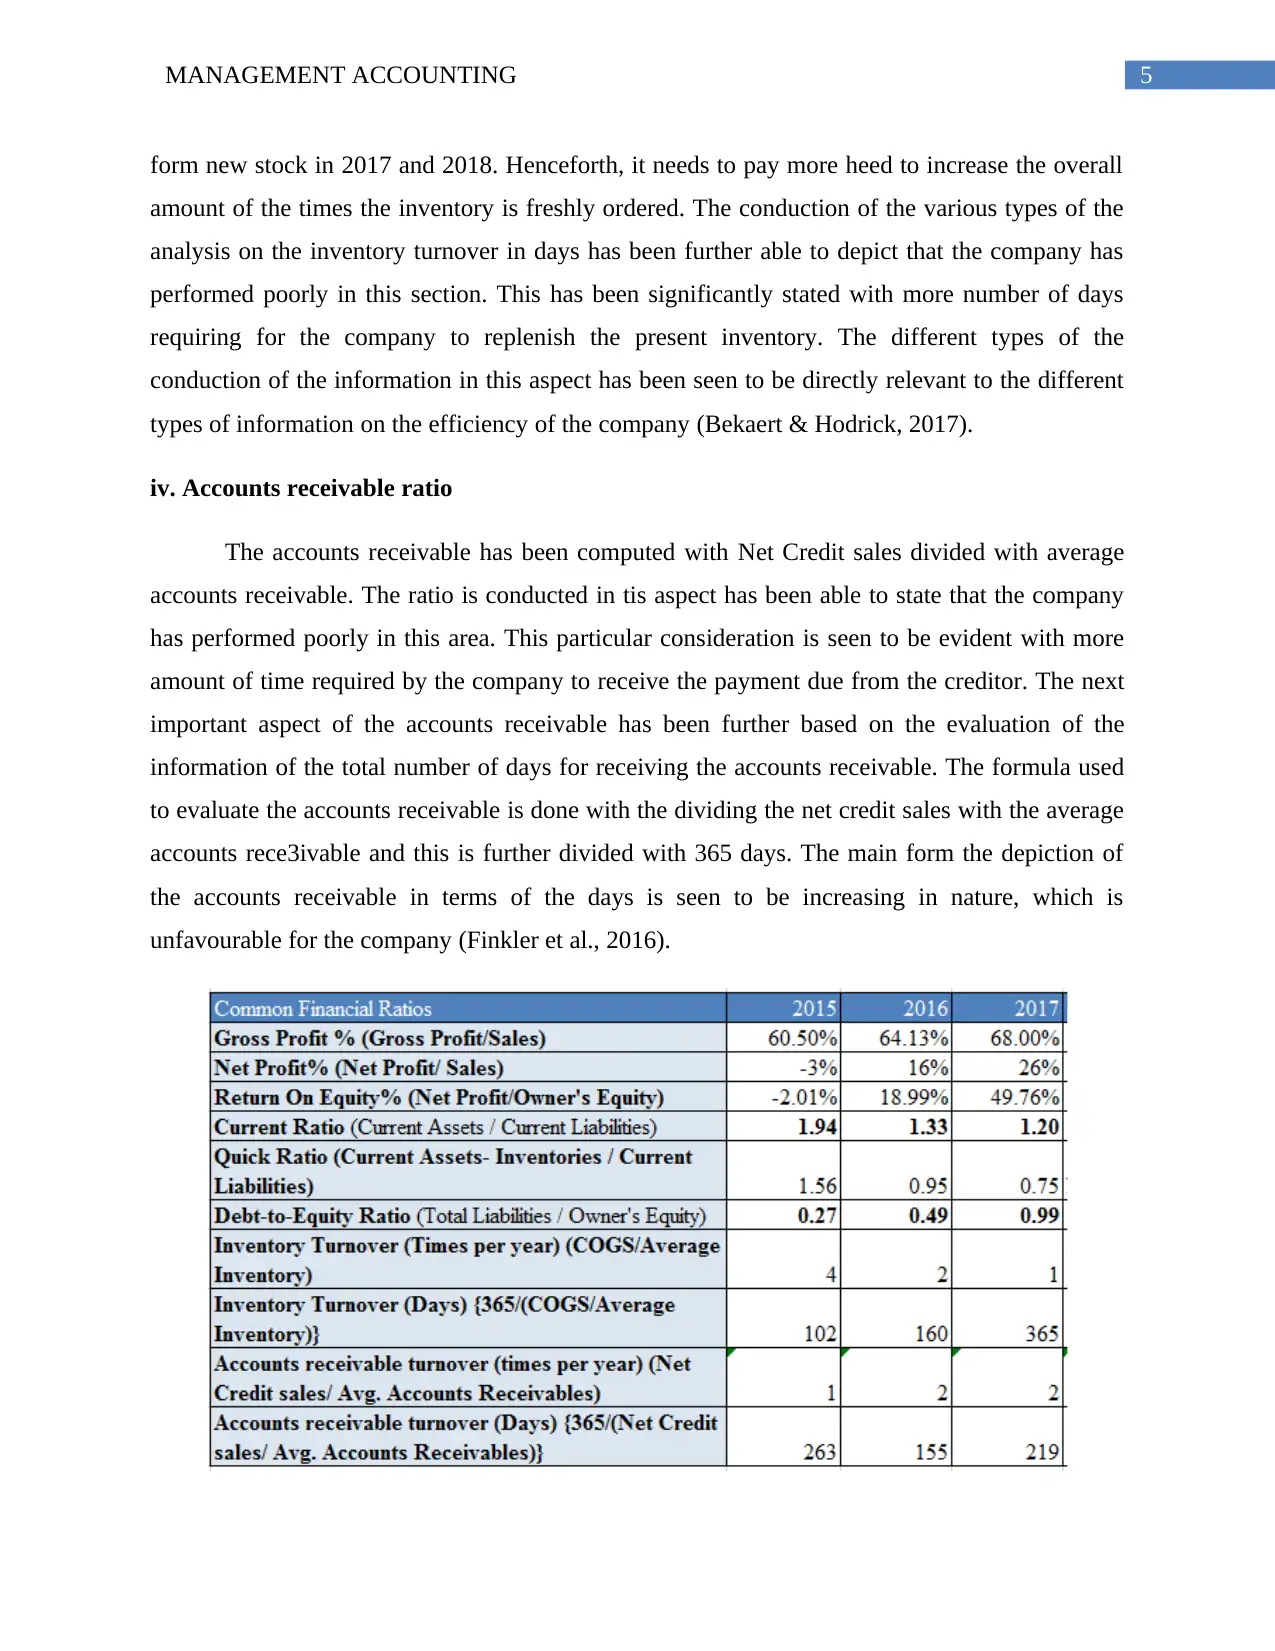
iv. Accounts receivable ratio
The accounts receivable has been computed with Net Credit sales divided with average
accounts receivable. The ratio is conducted in tis aspect has been able to state that the company
has performed poorly in this area. This particular consideration is seen to be evident with more
amount of time required by the company to receive the payment due from the creditor. The next
important aspect of the accounts receivable has been further based on the evaluation of the
information of the total number of days for receiving the accounts receivable. The formula used
to evaluate the accounts receivable is done with the dividing the net credit sales with the average
accounts rece3ivable and this is further divided with 365 days. The main form the depiction of
the accounts receivable in terms of the days is seen to be increasing in nature, which is
unfavourable for the company (Finkler et al., 2016).
form new stock in 2017 and 2018. Henceforth, it needs to pay more heed to increase the overall
amount of the times the inventory is freshly ordered. The conduction of the various types of the
analysis on the inventory turnover in days has been further able to depict that the company has
performed poorly in this section. This has been significantly stated with more number of days
requiring for the company to replenish the present inventory. The different types of the
conduction of the information in this aspect has been seen to be directly relevant to the different
types of information on the efficiency of the company (Bekaert & Hodrick, 2017).
iv. Accounts receivable ratio
The accounts receivable has been computed with Net Credit sales divided with average
accounts receivable. The ratio is conducted in tis aspect has been able to state that the company
has performed poorly in this area. This particular consideration is seen to be evident with more
amount of time required by the company to receive the payment due from the creditor. The next
important aspect of the accounts receivable has been further based on the evaluation of the
information of the total number of days for receiving the accounts receivable. The formula used
to evaluate the accounts receivable is done with the dividing the net credit sales with the average
accounts rece3ivable and this is further divided with 365 days. The main form the depiction of
the accounts receivable in terms of the days is seen to be increasing in nature, which is
unfavourable for the company (Finkler et al., 2016).
⊘ This is a preview!⊘
Do you want full access?
Subscribe today to unlock all pages.
Trusted by 1+ million students worldwide
6MANAGEMENT ACCOUNTING
Figure: Calculation of all the financial ratios
(Source: As stated by the author)
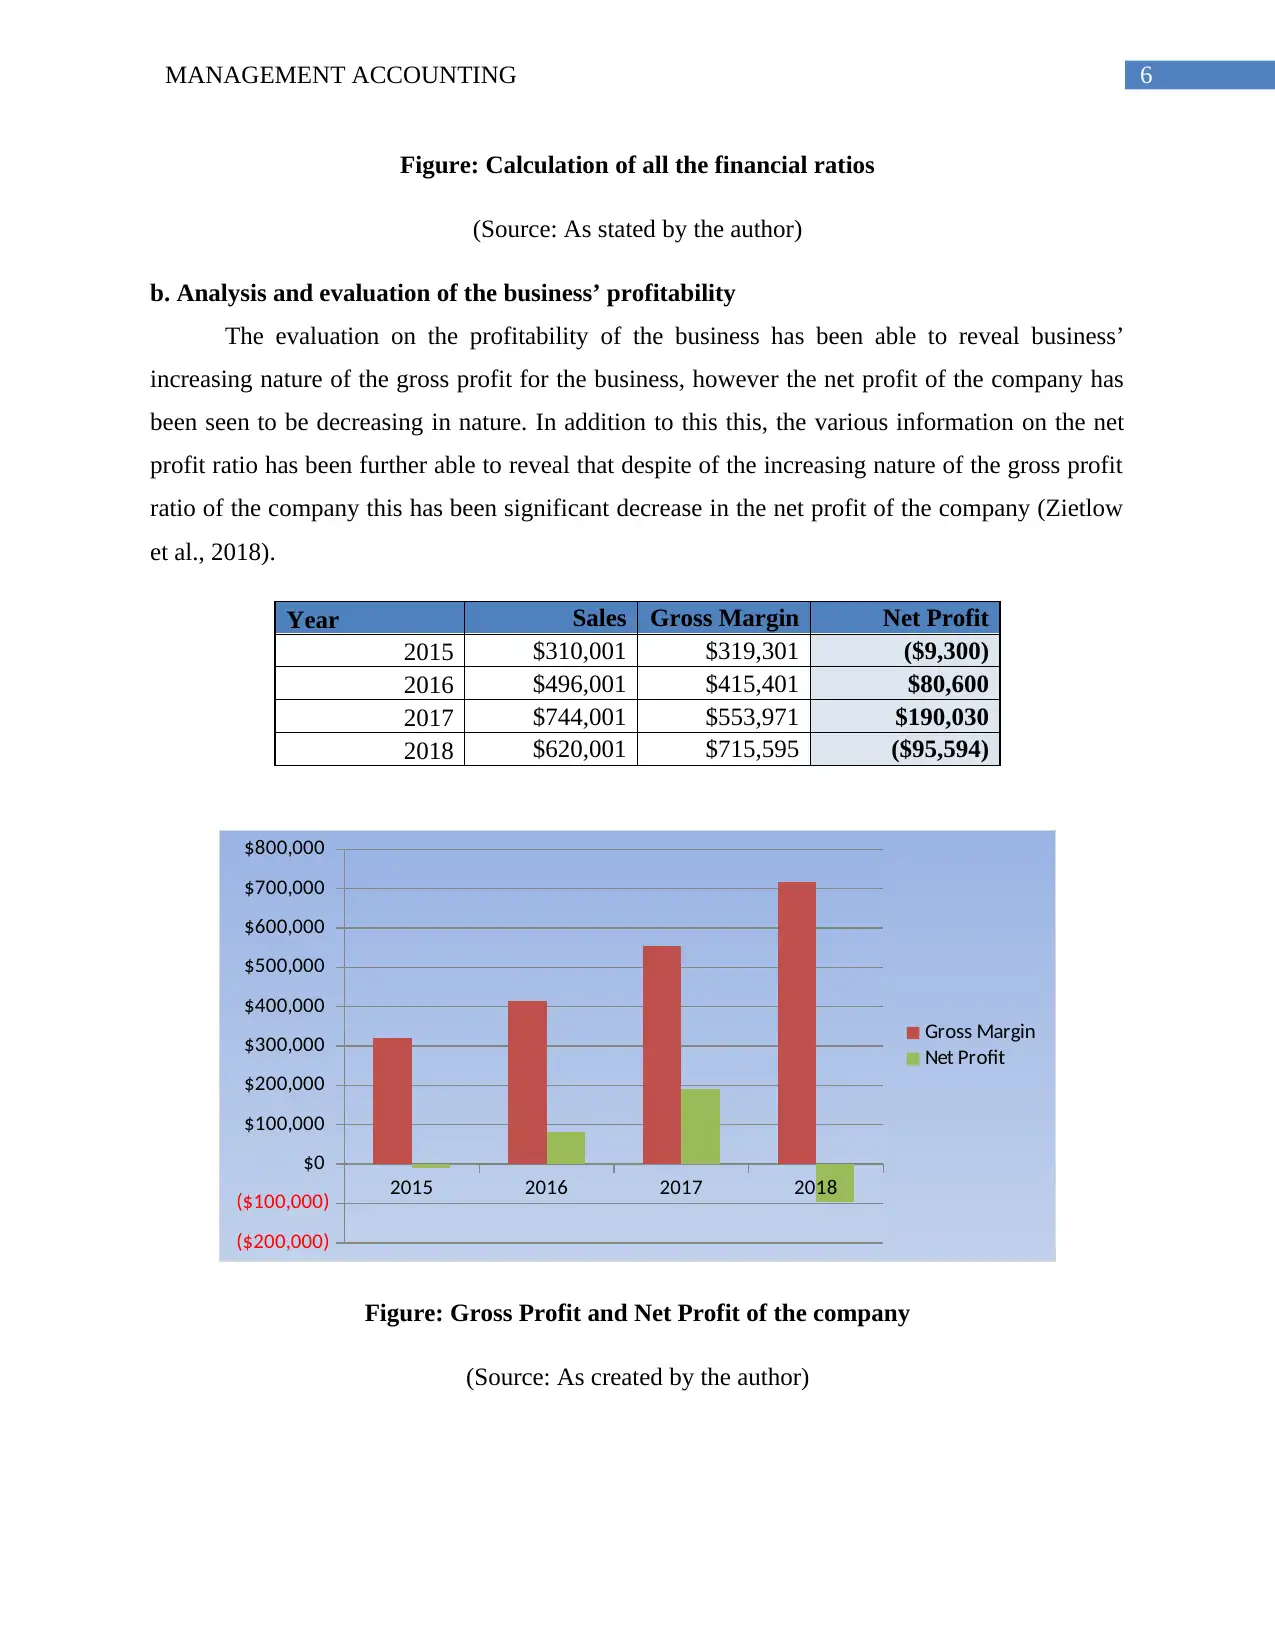
b. Analysis and evaluation of the business’ profitability
The evaluation on the profitability of the business has been able to reveal business’
increasing nature of the gross profit for the business, however the net profit of the company has
been seen to be decreasing in nature. In addition to this this, the various information on the net
profit ratio has been further able to reveal that despite of the increasing nature of the gross profit
ratio of the company this has been significant decrease in the net profit of the company (Zietlow
et al., 2018).
Year Sales Gross Margin Net Profit
2015 $310,001 $319,301 ($9,300)
2016 $496,001 $415,401 $80,600
2017 $744,001 $553,971 $190,030
2018 $620,001 $715,595 ($95,594)
2015 2016 2017 2018
($200,000)
($100,000)
$0
$100,000
$200,000
$300,000
$400,000
$500,000
$600,000
$700,000
$800,000
Gross Margin
Net Profit
Figure: Gross Profit and Net Profit of the company
(Source: As created by the author)
Figure: Calculation of all the financial ratios
(Source: As stated by the author)
b. Analysis and evaluation of the business’ profitability
The evaluation on the profitability of the business has been able to reveal business’
increasing nature of the gross profit for the business, however the net profit of the company has
been seen to be decreasing in nature. In addition to this this, the various information on the net
profit ratio has been further able to reveal that despite of the increasing nature of the gross profit
ratio of the company this has been significant decrease in the net profit of the company (Zietlow
et al., 2018).
Year Sales Gross Margin Net Profit
2015 $310,001 $319,301 ($9,300)
2016 $496,001 $415,401 $80,600
2017 $744,001 $553,971 $190,030
2018 $620,001 $715,595 ($95,594)
2015 2016 2017 2018
($200,000)
($100,000)
$0
$100,000
$200,000
$300,000
$400,000
$500,000
$600,000
$700,000
$800,000
Gross Margin
Net Profit
Figure: Gross Profit and Net Profit of the company
(Source: As created by the author)
Paraphrase This Document
Need a fresh take? Get an instant paraphrase of this document with our AI Paraphraser
7MANAGEMENT ACCOUNTING
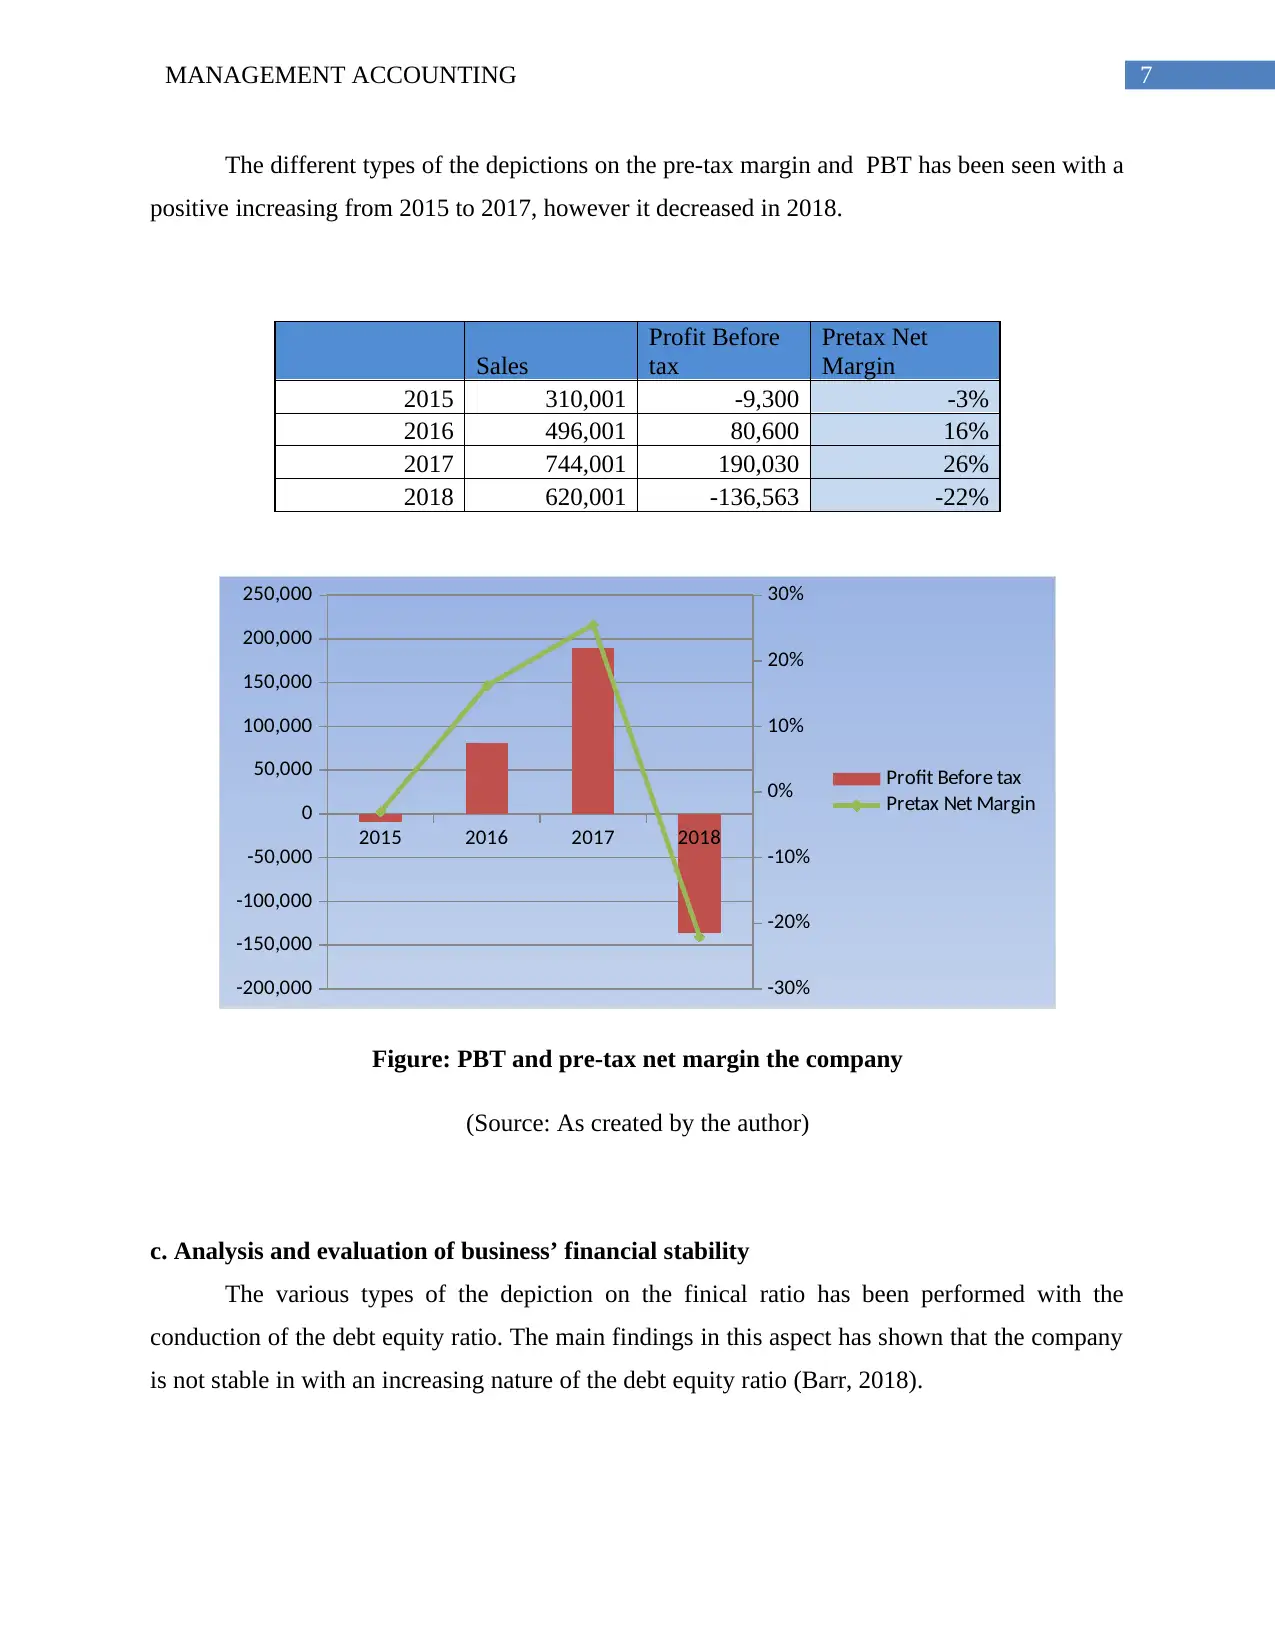
The different types of the depictions on the pre-tax margin and PBT has been seen with a
positive increasing from 2015 to 2017, however it decreased in 2018.
Sales
Profit Before
tax
Pretax Net
Margin
2015 310,001 -9,300 -3%
2016 496,001 80,600 16%
2017 744,001 190,030 26%
2018 620,001 -136,563 -22%
2015 2016 2017 2018
-200,000
-150,000
-100,000
-50,000
0
50,000
100,000
150,000
200,000
250,000
-30%
-20%
-10%
0%
10%
20%
30%
Profit Before tax
Pretax Net Margin
Figure: PBT and pre-tax net margin the company
(Source: As created by the author)
c. Analysis and evaluation of business’ financial stability
The various types of the depiction on the finical ratio has been performed with the
conduction of the debt equity ratio. The main findings in this aspect has shown that the company
is not stable in with an increasing nature of the debt equity ratio (Barr, 2018).
8MANAGEMENT ACCOUNTING
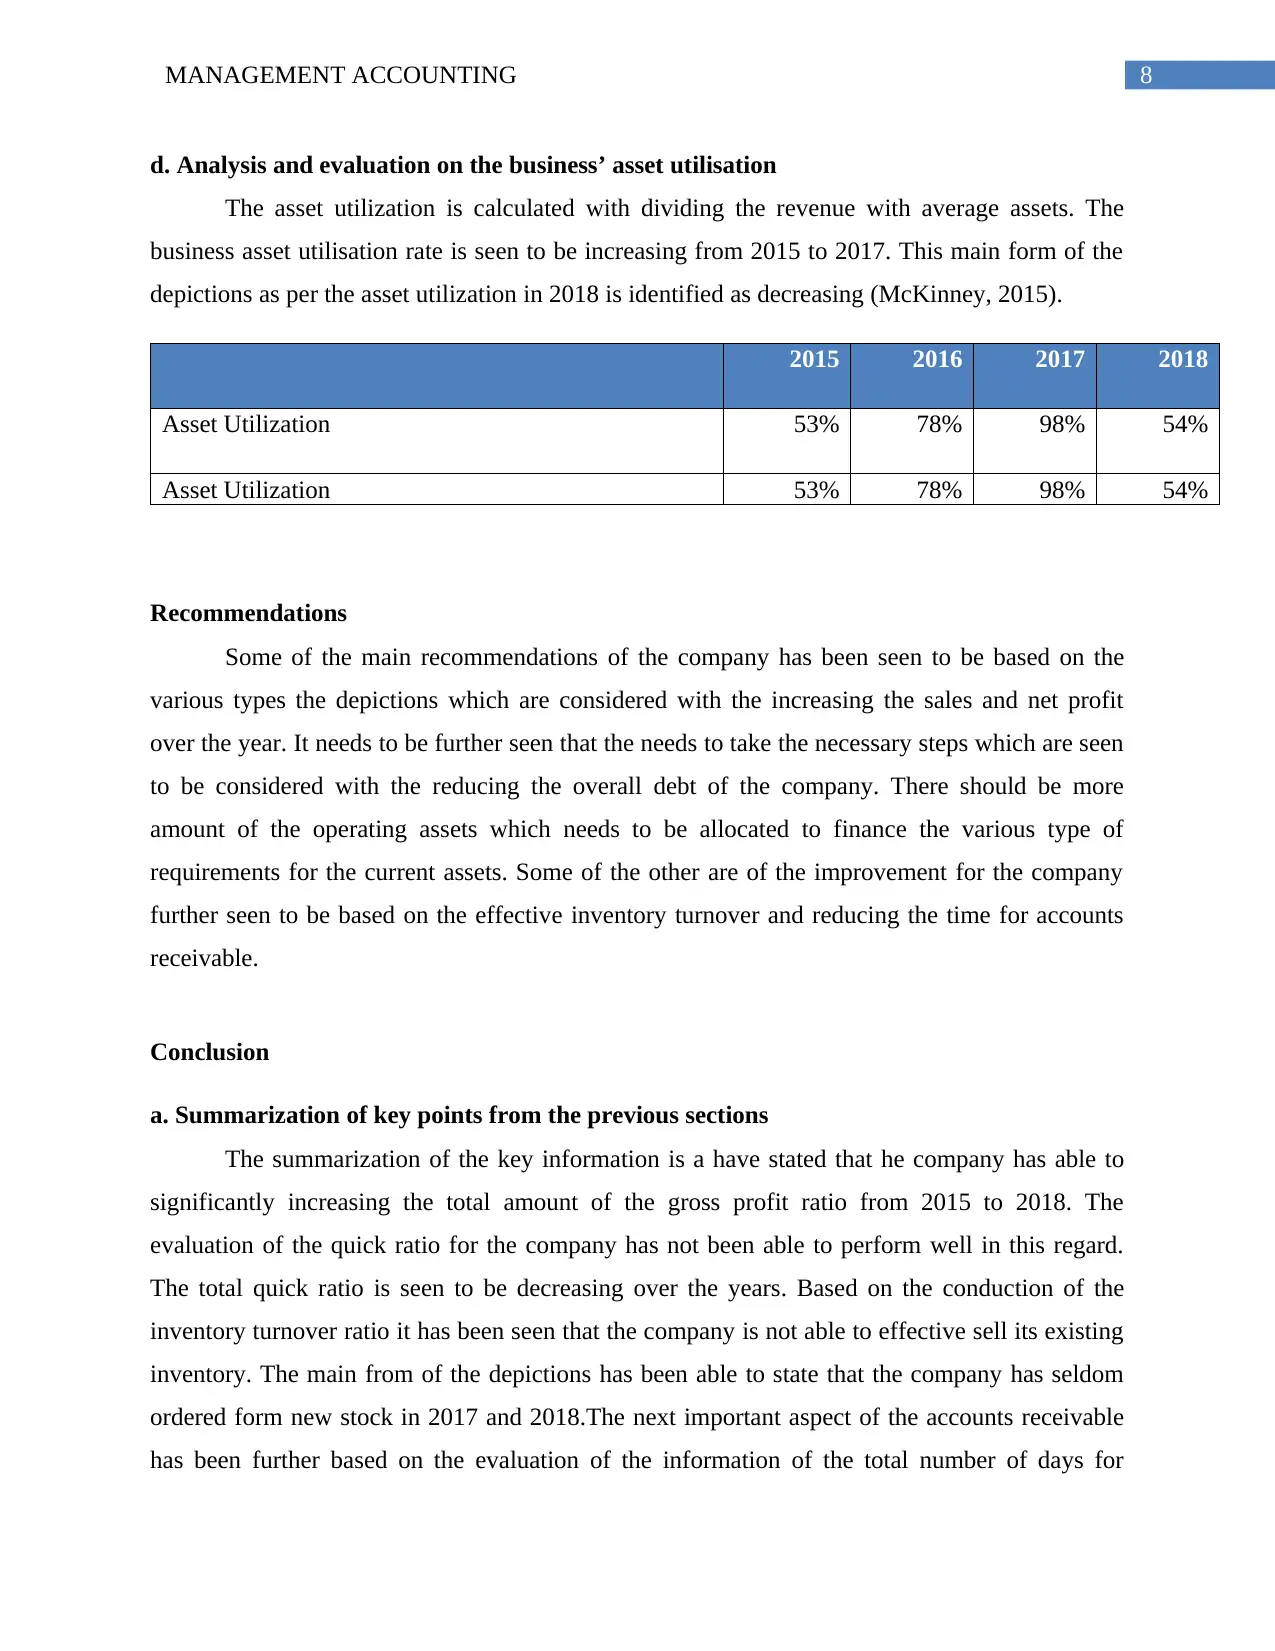
d. Analysis and evaluation on the business’ asset utilisation
The asset utilization is calculated with dividing the revenue with average assets. The
business asset utilisation rate is seen to be increasing from 2015 to 2017. This main form of the
depictions as per the asset utilization in 2018 is identified as decreasing (McKinney, 2015).
2015 2016 2017 2018
Asset Utilization 53% 78% 98% 54%
Asset Utilization 53% 78% 98% 54%
Recommendations
Some of the main recommendations of the company has been seen to be based on the
various types the depictions which are considered with the increasing the sales and net profit
over the year. It needs to be further seen that the needs to take the necessary steps which are seen
to be considered with the reducing the overall debt of the company. There should be more
amount of the operating assets which needs to be allocated to finance the various type of
requirements for the current assets. Some of the other are of the improvement for the company
further seen to be based on the effective inventory turnover and reducing the time for accounts
receivable.
Conclusion
a. Summarization of key points from the previous sections
The summarization of the key information is a have stated that he company has able to
significantly increasing the total amount of the gross profit ratio from 2015 to 2018. The
evaluation of the quick ratio for the company has not been able to perform well in this regard.
The total quick ratio is seen to be decreasing over the years. Based on the conduction of the
inventory turnover ratio it has been seen that the company is not able to effective sell its existing
inventory. The main from of the depictions has been able to state that the company has seldom
ordered form new stock in 2017 and 2018.The next important aspect of the accounts receivable
has been further based on the evaluation of the information of the total number of days for
⊘ This is a preview!⊘
Do you want full access?
Subscribe today to unlock all pages.
Trusted by 1+ million students worldwide
9MANAGEMENT ACCOUNTING
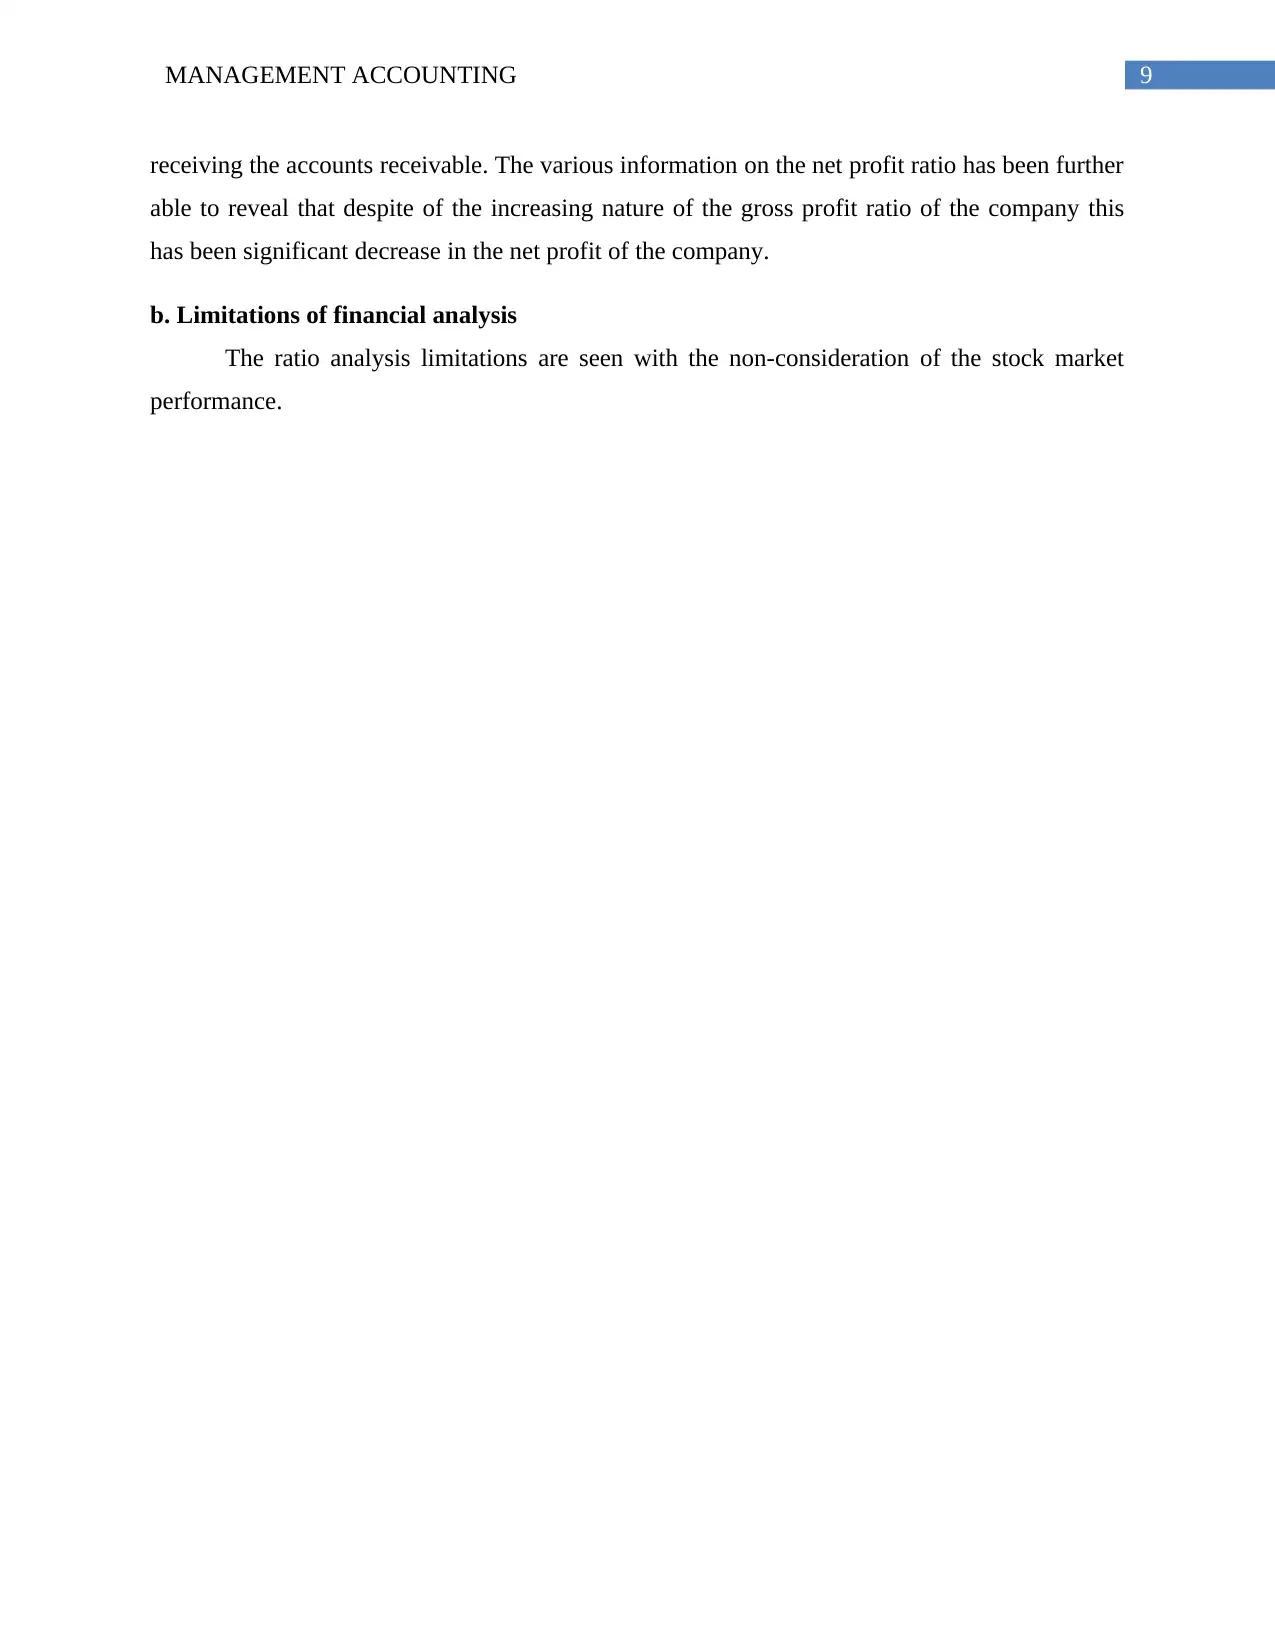
receiving the accounts receivable. The various information on the net profit ratio has been further
able to reveal that despite of the increasing nature of the gross profit ratio of the company this
has been significant decrease in the net profit of the company.
b. Limitations of financial analysis
The ratio analysis limitations are seen with the non-consideration of the stock market
performance.
Paraphrase This Document
Need a fresh take? Get an instant paraphrase of this document with our AI Paraphraser
10MANAGEMENT ACCOUNTING
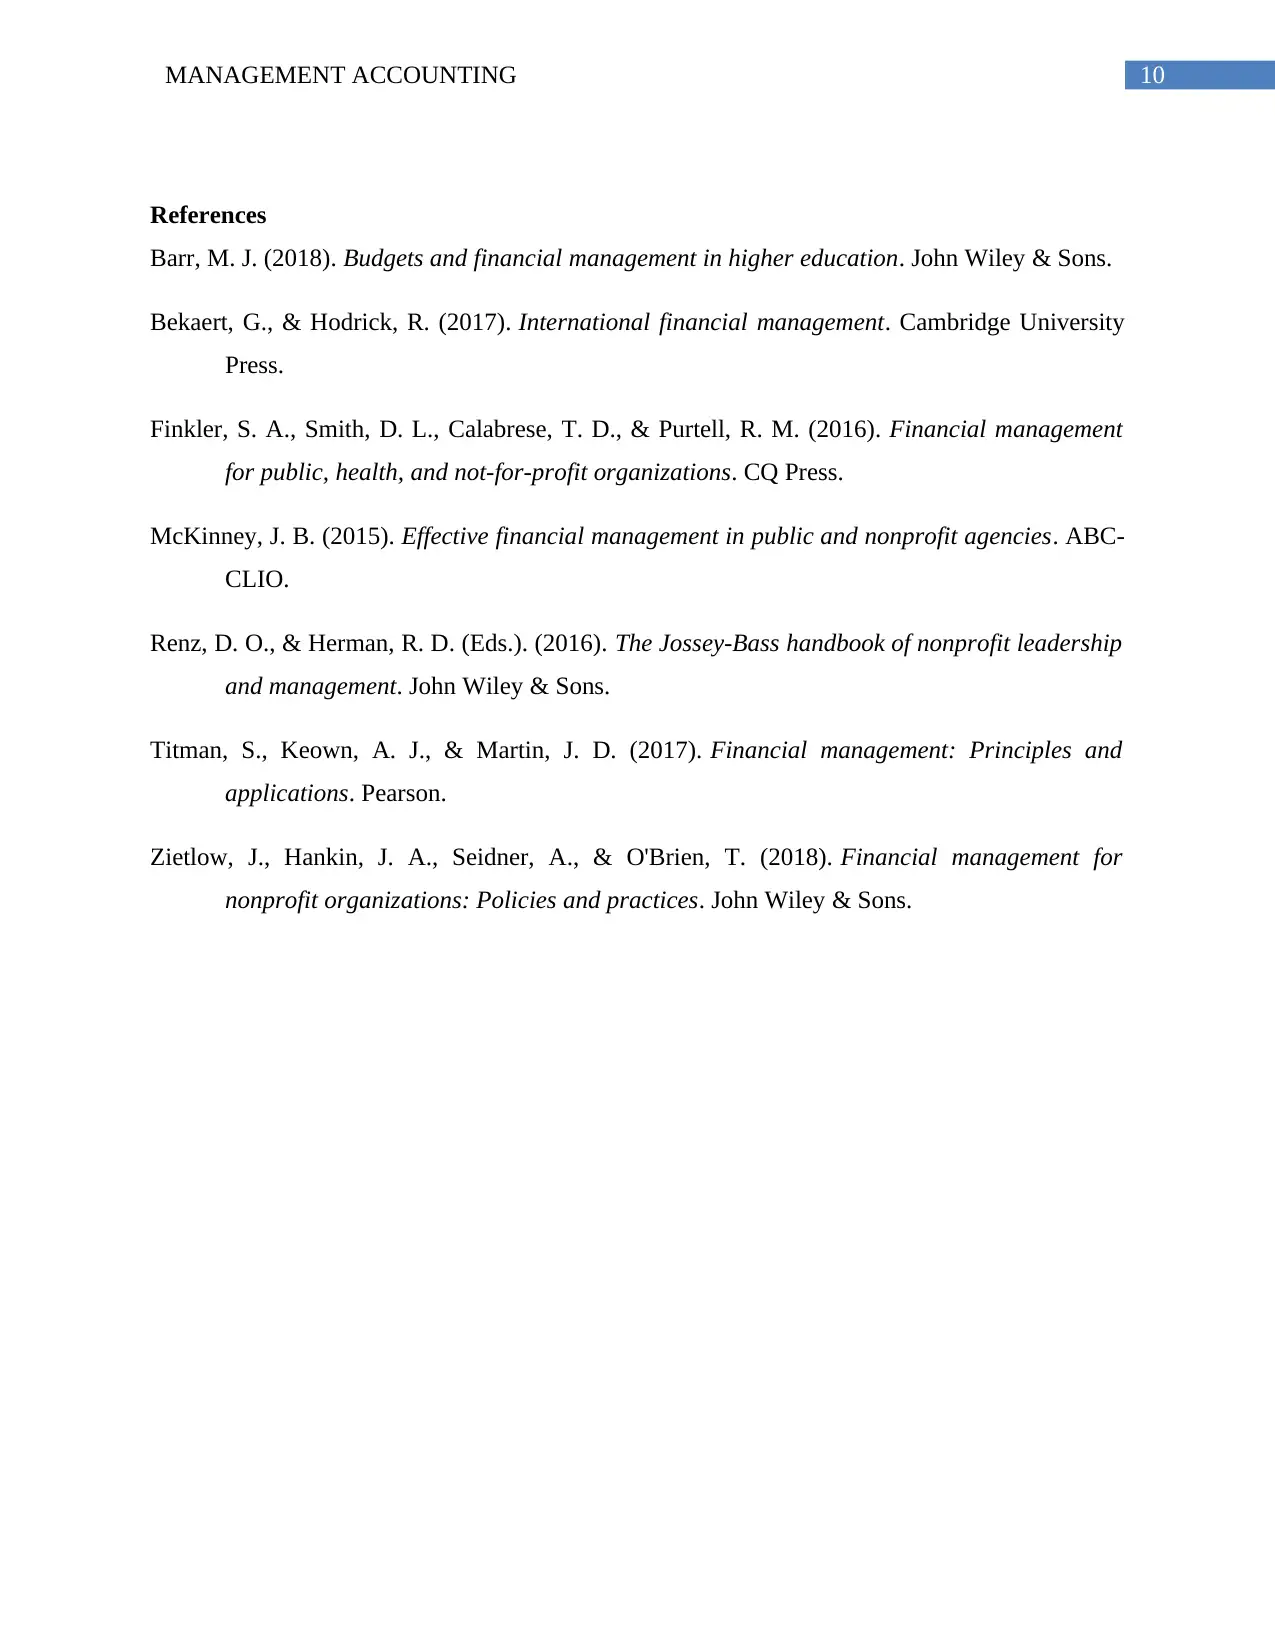
References
Barr, M. J. (2018). Budgets and financial management in higher education. John Wiley & Sons.
Bekaert, G., & Hodrick, R. (2017). International financial management. Cambridge University
Press.
Finkler, S. A., Smith, D. L., Calabrese, T. D., & Purtell, R. M. (2016). Financial management
for public, health, and not-for-profit organizations. CQ Press.
McKinney, J. B. (2015). Effective financial management in public and nonprofit agencies. ABC-
CLIO.
Renz, D. O., & Herman, R. D. (Eds.). (2016). The Jossey-Bass handbook of nonprofit leadership
and management. John Wiley & Sons.
Titman, S., Keown, A. J., & Martin, J. D. (2017). Financial management: Principles and
applications. Pearson.
Zietlow, J., Hankin, J. A., Seidner, A., & O'Brien, T. (2018). Financial management for
nonprofit organizations: Policies and practices. John Wiley & Sons.
11MANAGEMENT ACCOUNTING
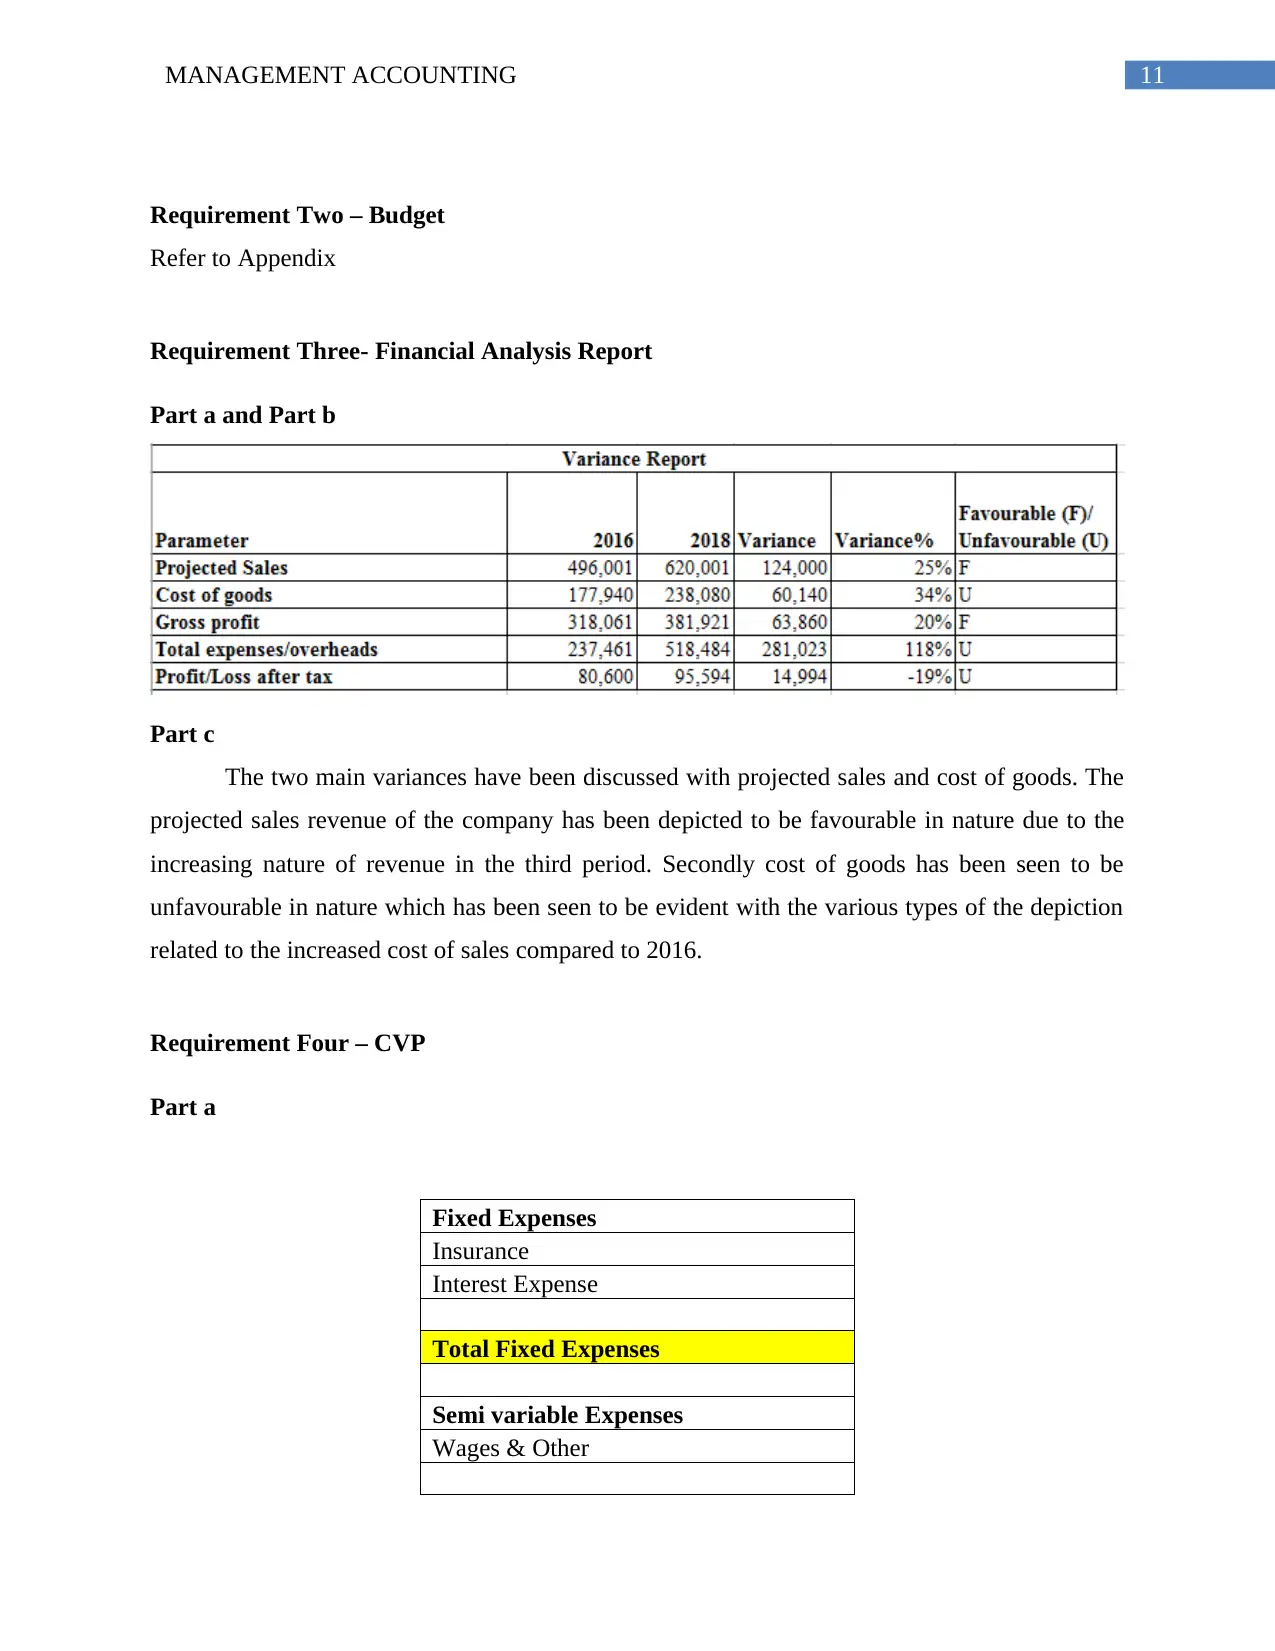
Requirement Two – Budget
Refer to Appendix
Requirement Three- Financial Analysis Report
Part a and Part b
Part c
The two main variances have been discussed with projected sales and cost of goods. The
projected sales revenue of the company has been depicted to be favourable in nature due to the
increasing nature of revenue in the third period. Secondly cost of goods has been seen to be
unfavourable in nature which has been seen to be evident with the various types of the depiction
related to the increased cost of sales compared to 2016.
Requirement Four – CVP
Part a
Fixed Expenses
Insurance
Interest Expense
Total Fixed Expenses
Semi variable Expenses
Wages & Other
⊘ This is a preview!⊘
Do you want full access?
Subscribe today to unlock all pages.
Trusted by 1+ million students worldwide
1 out of 17
Related Documents


Your All-in-One AI-Powered Toolkit for Academic Success.
+13062052269
info@desklib.com
Available 24*7 on WhatsApp / Email
![[object Object]](/_next/static/media/star-bottom.7253800d.svg)
Unlock your academic potential
Copyright © 2020–2026 A2Z Services. All Rights Reserved. Developed and managed by ZUCOL.