Financial Analysis Report: Marshall Motor Holdings PLC and Lookers PLC
VerifiedAdded on 2020/04/21
|26
|6131
|45
Project
AI Summary
This project report undertakes a comprehensive financial analysis of Marshall Motor Holdings PLC, evaluating its performance against its competitor, Lookers PLC. The report begins with an overview of both companies, including their backgrounds, missions, and visions. A detailed financial analysis follows, examining key financial statements such as income statements, balance sheets, and cash flow statements. Various financial ratios, including profitability, liquidity, and efficiency ratios, are calculated and compared over a five-year period to assess trends and performance. The analysis covers net margins, return on equity, current ratios, quick ratios, receivables collection periods, asset turnover ratios, and payable payment periods. The report concludes by comparing the financial positions of both companies to determine investment potential and market standing. The report uses financial data to determine which company is performing better in the market.
Running Head: Financial analysis and management
1
Project report: Financial analysis and management
1
Project report: Financial analysis and management
Paraphrase This Document
Need a fresh take? Get an instant paraphrase of this document with our AI Paraphraser
Financial analysis and management 2
Introduction:
It is requisite for every investor and the financial analyst to evaluate the position of
the market as well as the company to identify the bets market situation and the company to
invest their amount. Various techniques and methods have been invented through which it
becomes easy for the analyst as well as the investor to identify and analyze the market and
make a better decision about the performance and the situation of the company.
In this report, Marshall Motor Holdings Plc has been analyzed to identify that how
this company is performing in the market in context of the financial information. This
analysis has been done to make a decision about investment or not to invest into the business
of the company. For this, various ratio analysis, financial analysis and market situation of the
company has been analyzed so that a better decision could be made and it becomes easy for
the investors to analyze the position of the investments in the company.
More, in this report, competitive company of Marshal Motor Holdings plc which is
Lookers plc has also been analyzed and it has been found that how this company is
performing in the market and what is the current position of this company in the market? The
best company has been evaluated according to the market position in this report.
Company overview:
Firstly, the study has been done over the background, mission and vision of both the
companies which are as follows:
Marshal Motor holdings plc:
MARSHAL MOTOR HOLDINGS PLC is operating its business into the London
stock exchange. The main business and functions of this company is to sales the new and old
vehicles as well as repair them to enhance their utilization timing. This company also
provides the commercial vehicle and passenger vehicle on lease. Currently, this company has
total 103 franchises all over the world which has dealt with around 24 brands of the vehicle
and this company is operating its business in 25 countries in which 86 sites are managing by
this company (Home, 2017). The main mission and vision of this company is to maintain the
good relationship with the current clients and grab the entire car dealership market through
dealing with every brand.
Lookers plc:
Financial analysis and management 3
LOOKERS PLC is operating its business into the London stock exchange. The main
business and functions of this company is car dealership chain. This company reveals about
various motor brands. Currently, this company has diversifies its market into various
countries and it is enhancing its market through cracking the various new deals with various
car making companies (Home, 2017). The main mission and vision of this company is to
maintain the good relationship with the current clients and make new deals with the car
manufacturing companies so that the market share of the company could be enhanced.
Financial analysis:
Further, the study has been done over the financial position of both the companies to
analyze and evaluate the position of both the companies. For this study, various tools have
been analyzed. The main activities and the figures of both the company have been analyzed
for this report. The study of financial statement of both the companies is as follows:
Marshal Motor holdings plc:
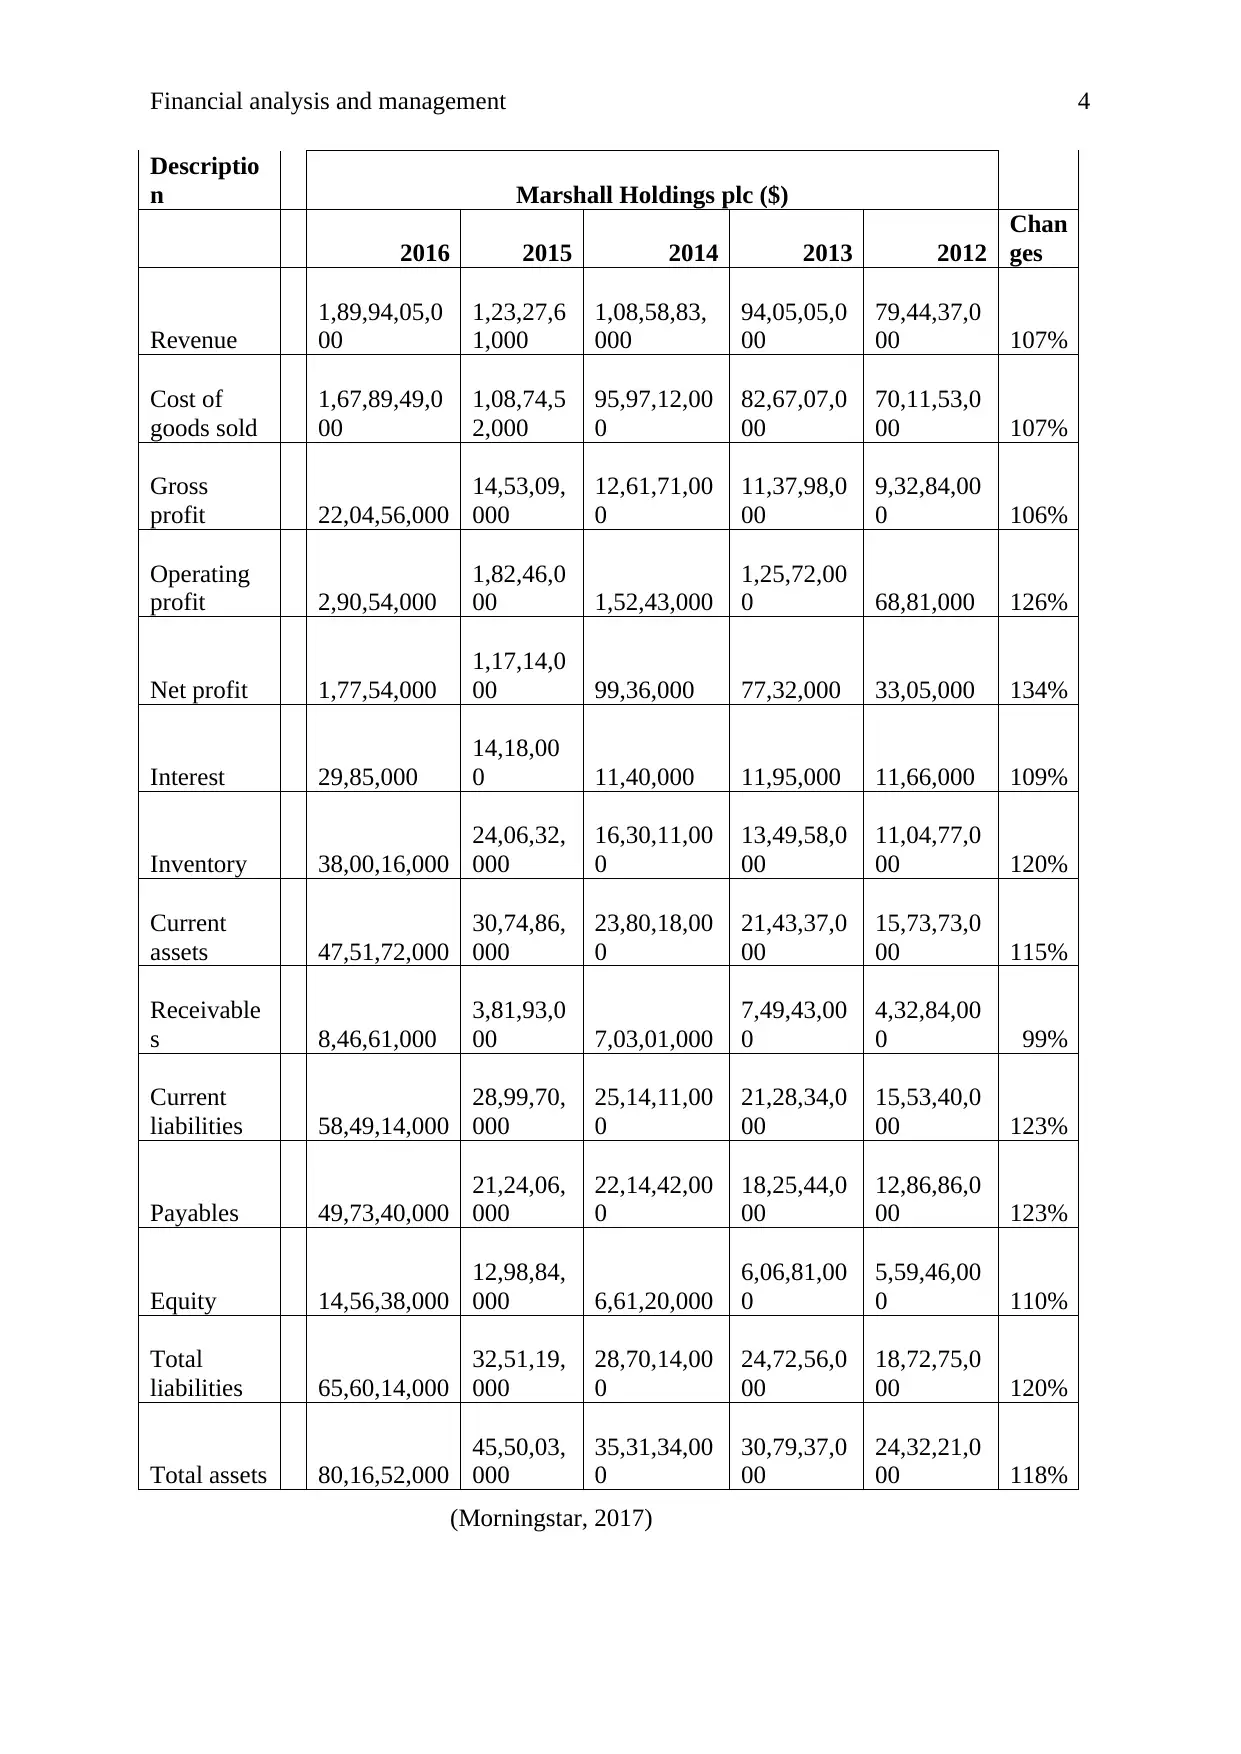
Through the financial statements of the MARSHAL MOTO HOLDINGS PLC, it has
been analyzed that the position of this company is getting better day by day. Firstly, the study
over the total revenues of the company depict that the total revenues has been enhanced by
107% in last 5 years. Further, the other aspect of the income statement, balance sheet and
cash flow has also been analyzed to evaluate the position of the company. The gross profit
position and the net profit position of the company depict that the operating profit has been
enhanced by 106% and net profit has been enhanced by 134% from last 5 years which depict
about the less operating expenses in last 5 years (Schlichting, 2013).
Further, the study has been done over the balance sheet of the company and it has
been found that the current assets and current liabilities of the company has been enhanced by
115% and 123% from last 5 years which depict that the company has enhanced the level of
the current assets as well as current liabilities according to the operations of the company so
that the working capital could be managed properly (Phillips and Stawarski, 2016).
More, the study has been done over the total assets, total liabilities and the total equity
of the company. Through the analysis over all the three aspects, it has been found that the
118%, 120% and 110% changes have taken place into the total assets, total liabilities and the
total equity of the company respectively (Palicka, 2011).
Financial Data
LOOKERS PLC is operating its business into the London stock exchange. The main
business and functions of this company is car dealership chain. This company reveals about
various motor brands. Currently, this company has diversifies its market into various
countries and it is enhancing its market through cracking the various new deals with various
car making companies (Home, 2017). The main mission and vision of this company is to
maintain the good relationship with the current clients and make new deals with the car
manufacturing companies so that the market share of the company could be enhanced.
Financial analysis:
Further, the study has been done over the financial position of both the companies to
analyze and evaluate the position of both the companies. For this study, various tools have
been analyzed. The main activities and the figures of both the company have been analyzed
for this report. The study of financial statement of both the companies is as follows:
Marshal Motor holdings plc:
Through the financial statements of the MARSHAL MOTO HOLDINGS PLC, it has
been analyzed that the position of this company is getting better day by day. Firstly, the study
over the total revenues of the company depict that the total revenues has been enhanced by
107% in last 5 years. Further, the other aspect of the income statement, balance sheet and
cash flow has also been analyzed to evaluate the position of the company. The gross profit
position and the net profit position of the company depict that the operating profit has been
enhanced by 106% and net profit has been enhanced by 134% from last 5 years which depict
about the less operating expenses in last 5 years (Schlichting, 2013).
Further, the study has been done over the balance sheet of the company and it has
been found that the current assets and current liabilities of the company has been enhanced by
115% and 123% from last 5 years which depict that the company has enhanced the level of
the current assets as well as current liabilities according to the operations of the company so
that the working capital could be managed properly (Phillips and Stawarski, 2016).
More, the study has been done over the total assets, total liabilities and the total equity
of the company. Through the analysis over all the three aspects, it has been found that the
118%, 120% and 110% changes have taken place into the total assets, total liabilities and the
total equity of the company respectively (Palicka, 2011).
Financial Data
⊘ This is a preview!⊘
Do you want full access?
Subscribe today to unlock all pages.
Trusted by 1+ million students worldwide
Financial analysis and management 4
Descriptio
n Marshall Holdings plc ($)
2016 2015 2014 2013 2012
Chan
ges
Revenue
1,89,94,05,0
00
1,23,27,6
1,000
1,08,58,83,
000
94,05,05,0
00
79,44,37,0
00 107%
Cost of
goods sold
1,67,89,49,0
00
1,08,74,5
2,000
95,97,12,00
0
82,67,07,0
00
70,11,53,0
00 107%
Gross
profit 22,04,56,000
14,53,09,
000
12,61,71,00
0
11,37,98,0
00
9,32,84,00
0 106%
Operating
profit 2,90,54,000
1,82,46,0
00 1,52,43,000
1,25,72,00
0 68,81,000 126%
Net profit 1,77,54,000
1,17,14,0
00 99,36,000 77,32,000 33,05,000 134%
Interest 29,85,000
14,18,00
0 11,40,000 11,95,000 11,66,000 109%
Inventory 38,00,16,000
24,06,32,
000
16,30,11,00
0
13,49,58,0
00
11,04,77,0
00 120%
Current
assets 47,51,72,000
30,74,86,
000
23,80,18,00
0
21,43,37,0
00
15,73,73,0
00 115%
Receivable
s 8,46,61,000
3,81,93,0
00 7,03,01,000
7,49,43,00
0
4,32,84,00
0 99%
Current
liabilities 58,49,14,000
28,99,70,
000
25,14,11,00
0
21,28,34,0
00
15,53,40,0
00 123%
Payables 49,73,40,000
21,24,06,
000
22,14,42,00
0
18,25,44,0
00
12,86,86,0
00 123%
Equity 14,56,38,000
12,98,84,
000 6,61,20,000
6,06,81,00
0
5,59,46,00
0 110%
Total
liabilities 65,60,14,000
32,51,19,
000
28,70,14,00
0
24,72,56,0
00
18,72,75,0
00 120%
Total assets 80,16,52,000
45,50,03,
000
35,31,34,00
0
30,79,37,0
00
24,32,21,0
00 118%
(Morningstar, 2017)
Paraphrase This Document
Need a fresh take? Get an instant paraphrase of this document with our AI Paraphraser
Financial analysis and management 5
Through the analysis, it has been found that various positive changes have taken place
into the performance and the position of the company in last five years which depicts about
the better position of the company in the industry.
Lookers plc:
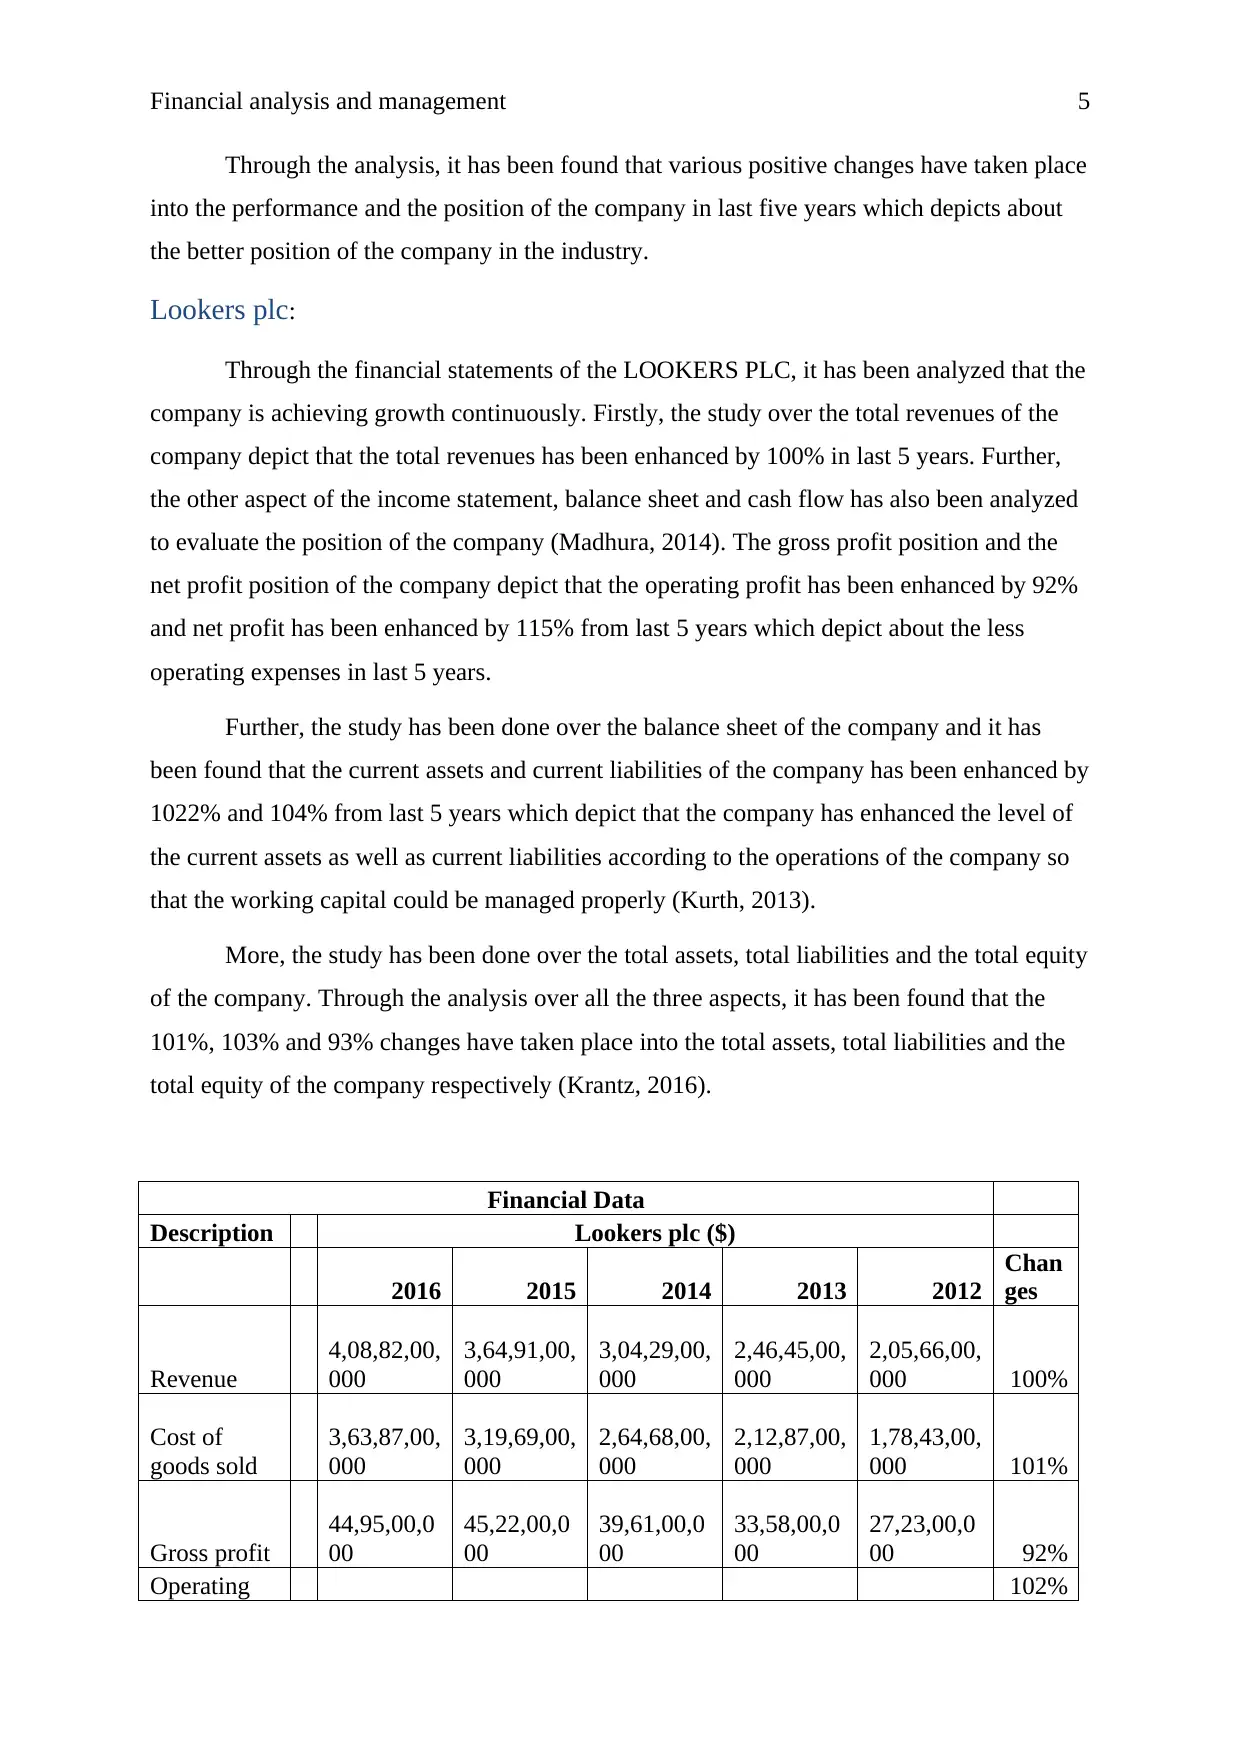
Through the financial statements of the LOOKERS PLC, it has been analyzed that the
company is achieving growth continuously. Firstly, the study over the total revenues of the
company depict that the total revenues has been enhanced by 100% in last 5 years. Further,
the other aspect of the income statement, balance sheet and cash flow has also been analyzed
to evaluate the position of the company (Madhura, 2014). The gross profit position and the
net profit position of the company depict that the operating profit has been enhanced by 92%
and net profit has been enhanced by 115% from last 5 years which depict about the less
operating expenses in last 5 years.
Further, the study has been done over the balance sheet of the company and it has
been found that the current assets and current liabilities of the company has been enhanced by
1022% and 104% from last 5 years which depict that the company has enhanced the level of
the current assets as well as current liabilities according to the operations of the company so
that the working capital could be managed properly (Kurth, 2013).
More, the study has been done over the total assets, total liabilities and the total equity
of the company. Through the analysis over all the three aspects, it has been found that the
101%, 103% and 93% changes have taken place into the total assets, total liabilities and the
total equity of the company respectively (Krantz, 2016).
Financial Data
Description Lookers plc ($)
2016 2015 2014 2013 2012
Chan
ges
Revenue
4,08,82,00,
000
3,64,91,00,
000
3,04,29,00,
000
2,46,45,00,
000
2,05,66,00,
000 100%
Cost of
goods sold
3,63,87,00,
000
3,19,69,00,
000
2,64,68,00,
000
2,12,87,00,
000
1,78,43,00,
000 101%
Gross profit
44,95,00,0
00
45,22,00,0
00
39,61,00,0
00
33,58,00,0
00
27,23,00,0
00 92%
Operating 102%
Through the analysis, it has been found that various positive changes have taken place
into the performance and the position of the company in last five years which depicts about
the better position of the company in the industry.
Lookers plc:
Through the financial statements of the LOOKERS PLC, it has been analyzed that the
company is achieving growth continuously. Firstly, the study over the total revenues of the
company depict that the total revenues has been enhanced by 100% in last 5 years. Further,
the other aspect of the income statement, balance sheet and cash flow has also been analyzed
to evaluate the position of the company (Madhura, 2014). The gross profit position and the
net profit position of the company depict that the operating profit has been enhanced by 92%
and net profit has been enhanced by 115% from last 5 years which depict about the less
operating expenses in last 5 years.
Further, the study has been done over the balance sheet of the company and it has
been found that the current assets and current liabilities of the company has been enhanced by
1022% and 104% from last 5 years which depict that the company has enhanced the level of
the current assets as well as current liabilities according to the operations of the company so
that the working capital could be managed properly (Kurth, 2013).
More, the study has been done over the total assets, total liabilities and the total equity
of the company. Through the analysis over all the three aspects, it has been found that the
101%, 103% and 93% changes have taken place into the total assets, total liabilities and the
total equity of the company respectively (Krantz, 2016).
Financial Data
Description Lookers plc ($)
2016 2015 2014 2013 2012
Chan
ges
Revenue
4,08,82,00,
000
3,64,91,00,
000
3,04,29,00,
000
2,46,45,00,
000
2,05,66,00,
000 100%
Cost of
goods sold
3,63,87,00,
000
3,19,69,00,
000
2,64,68,00,
000
2,12,87,00,
000
1,78,43,00,
000 101%
Gross profit
44,95,00,0
00
45,22,00,0
00
39,61,00,0
00
33,58,00,0
00
27,23,00,0
00 92%
Operating 102%
Financial analysis and management 6
profit
10,08,00,0
00
8,06,00,00
0
7,42,00,00
0
5,70,00,00
0
4,79,00,00
0
Net profit
8,13,00,00
0
5,08,00,00
0
4,68,00,00
0
3,60,00,00
0
2,70,00,00
0 115%
Interest
1,76,00,00
0
1,41,00,00
0
1,19,00,00
0
1,05,00,00
0
1,26,00,00
0 83%
Inventory
83,94,00,0
00
81,60,00,0
00
54,88,00,0
00
44,67,00,0
00
38,41,00,0
00 103%
Current
assets
1,17,13,00,
000
1,14,39,00,
000
79,12,00,0
00
65,93,00,0
00
55,92,00,0
00 102%
Receivables
26,64,00,0
00
30,14,00,0
00
21,46,00,0
00
18,95,00,0
00
15,04,00,0
00 95%
Current
liabilities
1,13,03,00,
000
1,08,54,00,
000
72,52,00,0
00
61,03,00,0
00
51,30,00,0
00 104%
Payables
26,67,00,0
00
26,57,00,0
00
19,33,00,0
00
17,20,00,0
00
14,92,00,0
00 95%
Equity
34,17,00,0
00
29,78,00,0
00
25,69,00,0
00
22,73,00,0
00
20,33,00,0
00 93%
Total
liabilities
1,36,61,00,
000
1,28,73,00,
000
86,41,00,0
00
72,41,00,0
00
62,92,00,0
00 103%
Total assets
1,70,78,00,
000
1,58,51,00,
000
1,12,10,00,
000
95,14,00,0
00
83,25,00,0
00 101%
(Morningstar, 2017)
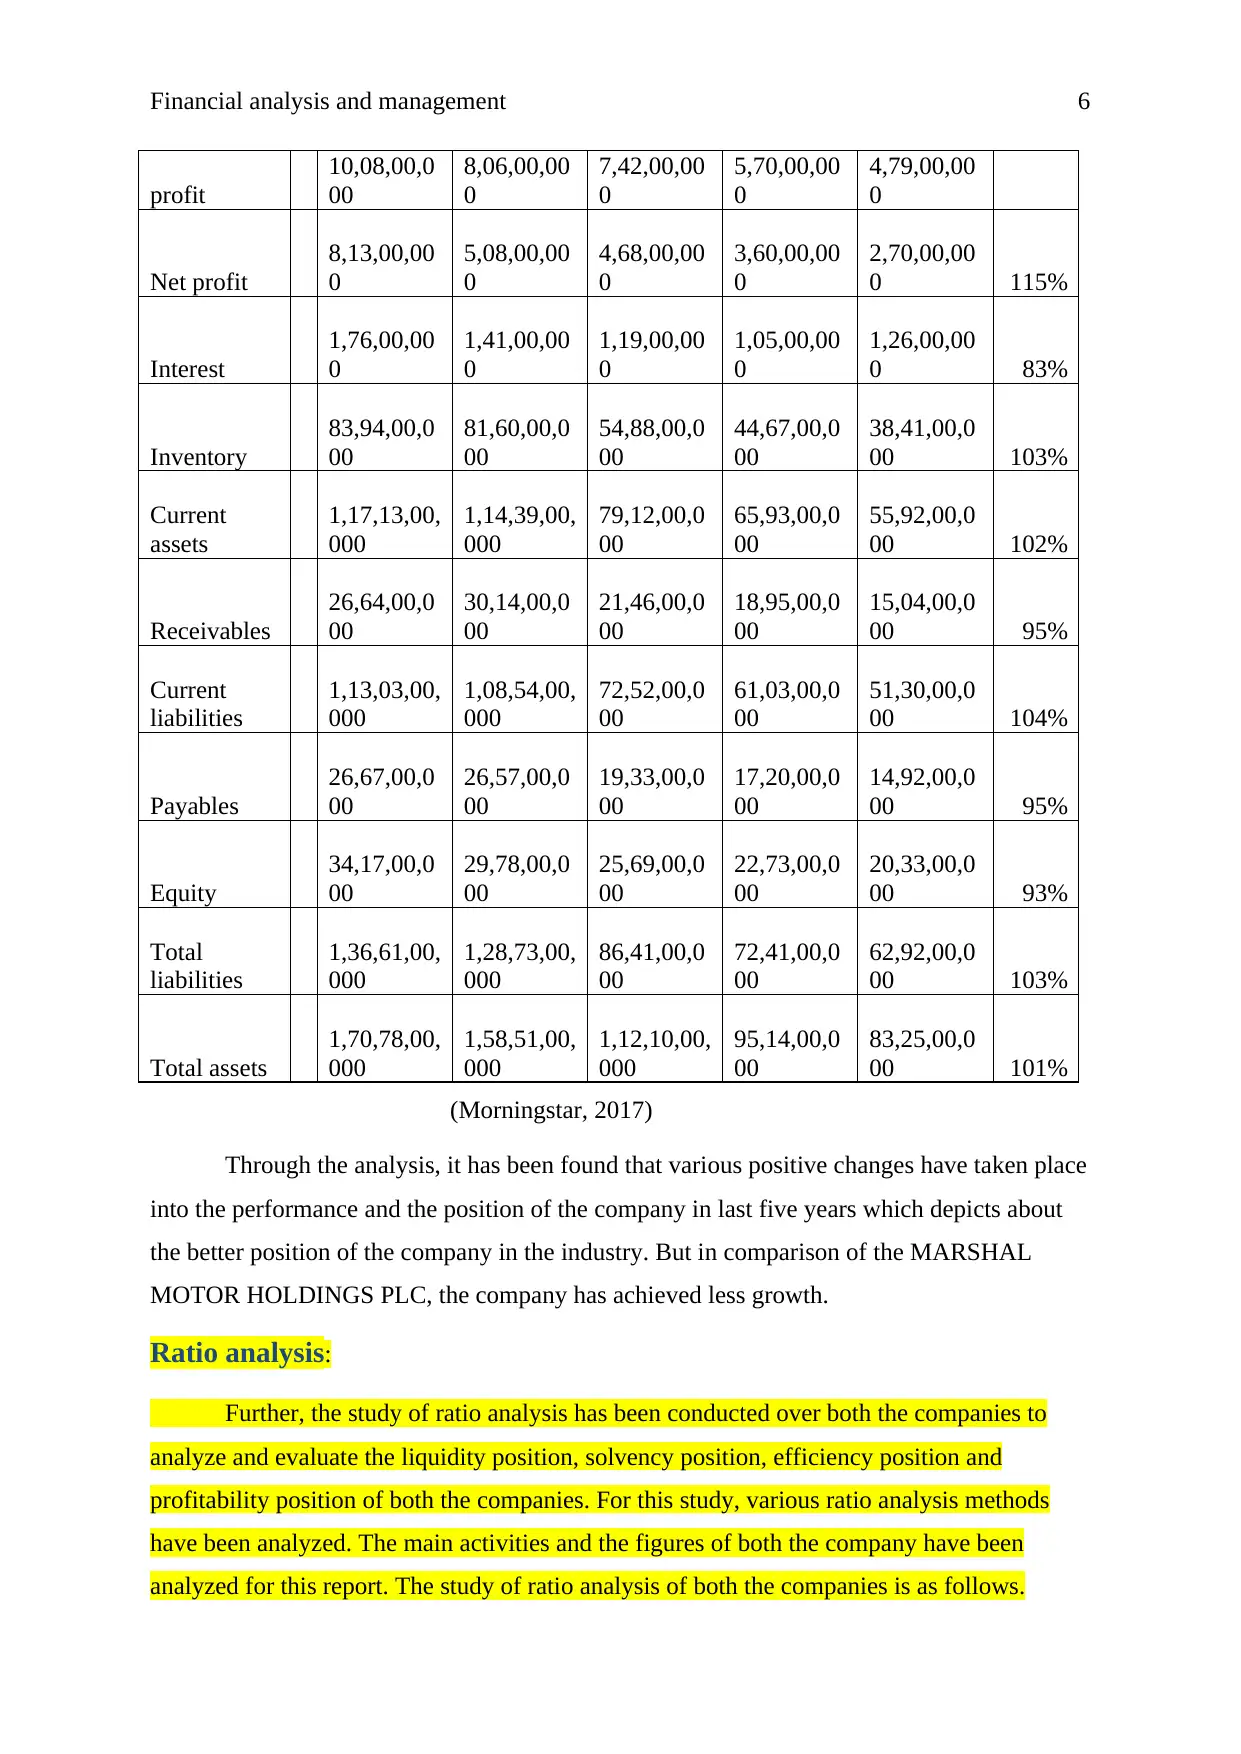
Through the analysis, it has been found that various positive changes have taken place
into the performance and the position of the company in last five years which depicts about
the better position of the company in the industry. But in comparison of the MARSHAL
MOTOR HOLDINGS PLC, the company has achieved less growth.
Ratio analysis:
Further, the study of ratio analysis has been conducted over both the companies to
analyze and evaluate the liquidity position, solvency position, efficiency position and
profitability position of both the companies. For this study, various ratio analysis methods
have been analyzed. The main activities and the figures of both the company have been
analyzed for this report. The study of ratio analysis of both the companies is as follows.
profit
10,08,00,0
00
8,06,00,00
0
7,42,00,00
0
5,70,00,00
0
4,79,00,00
0
Net profit
8,13,00,00
0
5,08,00,00
0
4,68,00,00
0
3,60,00,00
0
2,70,00,00
0 115%
Interest
1,76,00,00
0
1,41,00,00
0
1,19,00,00
0
1,05,00,00
0
1,26,00,00
0 83%
Inventory
83,94,00,0
00
81,60,00,0
00
54,88,00,0
00
44,67,00,0
00
38,41,00,0
00 103%
Current
assets
1,17,13,00,
000
1,14,39,00,
000
79,12,00,0
00
65,93,00,0
00
55,92,00,0
00 102%
Receivables
26,64,00,0
00
30,14,00,0
00
21,46,00,0
00
18,95,00,0
00
15,04,00,0
00 95%
Current
liabilities
1,13,03,00,
000
1,08,54,00,
000
72,52,00,0
00
61,03,00,0
00
51,30,00,0
00 104%
Payables
26,67,00,0
00
26,57,00,0
00
19,33,00,0
00
17,20,00,0
00
14,92,00,0
00 95%
Equity
34,17,00,0
00
29,78,00,0
00
25,69,00,0
00
22,73,00,0
00
20,33,00,0
00 93%
Total
liabilities
1,36,61,00,
000
1,28,73,00,
000
86,41,00,0
00
72,41,00,0
00
62,92,00,0
00 103%
Total assets
1,70,78,00,
000
1,58,51,00,
000
1,12,10,00,
000
95,14,00,0
00
83,25,00,0
00 101%
(Morningstar, 2017)
Through the analysis, it has been found that various positive changes have taken place
into the performance and the position of the company in last five years which depicts about
the better position of the company in the industry. But in comparison of the MARSHAL
MOTOR HOLDINGS PLC, the company has achieved less growth.
Ratio analysis:
Further, the study of ratio analysis has been conducted over both the companies to
analyze and evaluate the liquidity position, solvency position, efficiency position and
profitability position of both the companies. For this study, various ratio analysis methods
have been analyzed. The main activities and the figures of both the company have been
analyzed for this report. The study of ratio analysis of both the companies is as follows.
⊘ This is a preview!⊘
Do you want full access?
Subscribe today to unlock all pages.
Trusted by 1+ million students worldwide
Financial analysis and management 7
Firstly, the study has been done over MARSHAL MOTOR HOLDINGS PLC and
LOOKERS PLC to analyze the liquidity position, solvency position, efficiency position and
profitability position.
Profitability ratio:
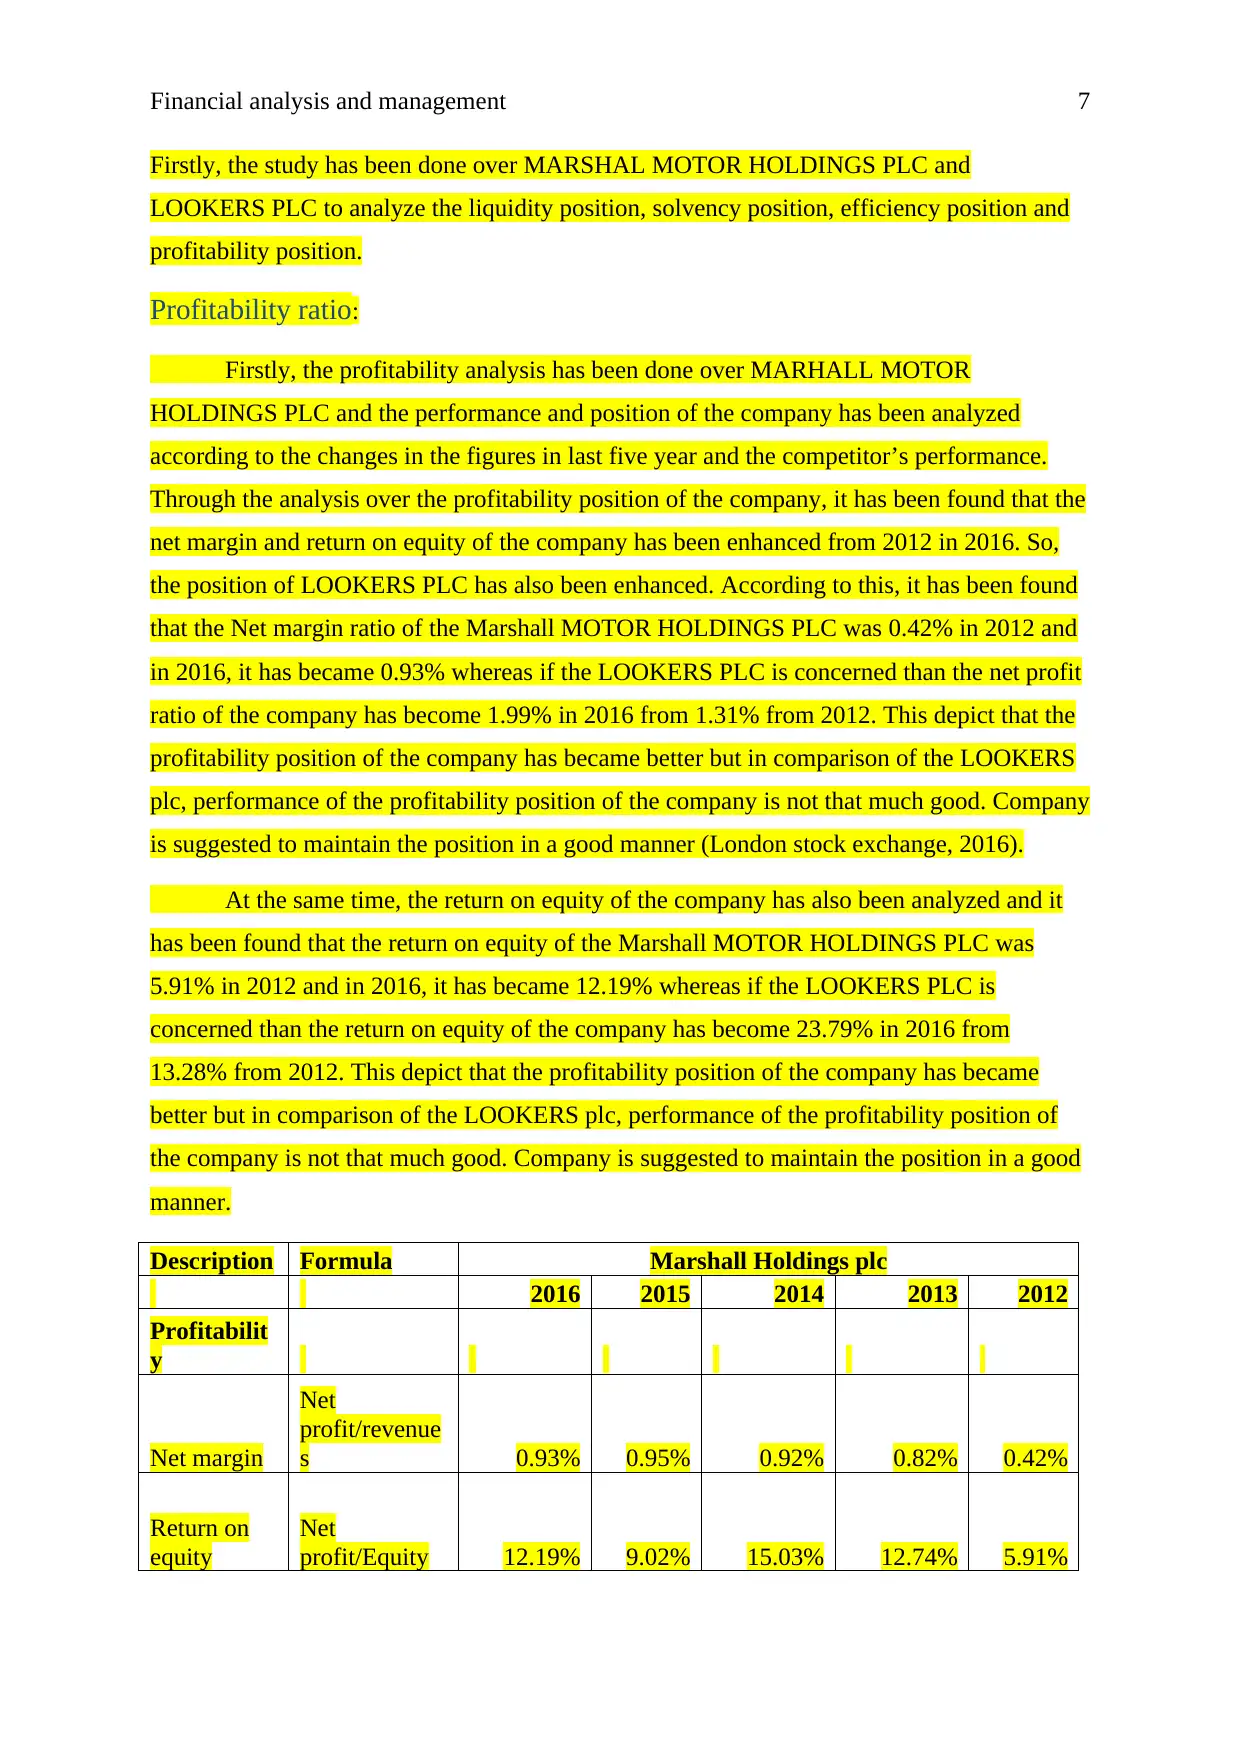
Firstly, the profitability analysis has been done over MARHALL MOTOR
HOLDINGS PLC and the performance and position of the company has been analyzed
according to the changes in the figures in last five year and the competitor’s performance.
Through the analysis over the profitability position of the company, it has been found that the
net margin and return on equity of the company has been enhanced from 2012 in 2016. So,
the position of LOOKERS PLC has also been enhanced. According to this, it has been found
that the Net margin ratio of the Marshall MOTOR HOLDINGS PLC was 0.42% in 2012 and
in 2016, it has became 0.93% whereas if the LOOKERS PLC is concerned than the net profit
ratio of the company has become 1.99% in 2016 from 1.31% from 2012. This depict that the
profitability position of the company has became better but in comparison of the LOOKERS
plc, performance of the profitability position of the company is not that much good. Company
is suggested to maintain the position in a good manner (London stock exchange, 2016).
At the same time, the return on equity of the company has also been analyzed and it
has been found that the return on equity of the Marshall MOTOR HOLDINGS PLC was
5.91% in 2012 and in 2016, it has became 12.19% whereas if the LOOKERS PLC is
concerned than the return on equity of the company has become 23.79% in 2016 from
13.28% from 2012. This depict that the profitability position of the company has became
better but in comparison of the LOOKERS plc, performance of the profitability position of
the company is not that much good. Company is suggested to maintain the position in a good
manner.
Description Formula Marshall Holdings plc
2016 2015 2014 2013 2012
Profitabilit
y
Net margin
Net
profit/revenue
s 0.93% 0.95% 0.92% 0.82% 0.42%
Return on
equity
Net
profit/Equity 12.19% 9.02% 15.03% 12.74% 5.91%
Firstly, the study has been done over MARSHAL MOTOR HOLDINGS PLC and
LOOKERS PLC to analyze the liquidity position, solvency position, efficiency position and
profitability position.
Profitability ratio:
Firstly, the profitability analysis has been done over MARHALL MOTOR
HOLDINGS PLC and the performance and position of the company has been analyzed
according to the changes in the figures in last five year and the competitor’s performance.
Through the analysis over the profitability position of the company, it has been found that the
net margin and return on equity of the company has been enhanced from 2012 in 2016. So,
the position of LOOKERS PLC has also been enhanced. According to this, it has been found
that the Net margin ratio of the Marshall MOTOR HOLDINGS PLC was 0.42% in 2012 and
in 2016, it has became 0.93% whereas if the LOOKERS PLC is concerned than the net profit
ratio of the company has become 1.99% in 2016 from 1.31% from 2012. This depict that the
profitability position of the company has became better but in comparison of the LOOKERS
plc, performance of the profitability position of the company is not that much good. Company
is suggested to maintain the position in a good manner (London stock exchange, 2016).
At the same time, the return on equity of the company has also been analyzed and it
has been found that the return on equity of the Marshall MOTOR HOLDINGS PLC was
5.91% in 2012 and in 2016, it has became 12.19% whereas if the LOOKERS PLC is
concerned than the return on equity of the company has become 23.79% in 2016 from
13.28% from 2012. This depict that the profitability position of the company has became
better but in comparison of the LOOKERS plc, performance of the profitability position of
the company is not that much good. Company is suggested to maintain the position in a good
manner.
Description Formula Marshall Holdings plc
2016 2015 2014 2013 2012
Profitabilit
y
Net margin
Net
profit/revenue
s 0.93% 0.95% 0.92% 0.82% 0.42%
Return on
equity
Net
profit/Equity 12.19% 9.02% 15.03% 12.74% 5.91%
Paraphrase This Document
Need a fresh take? Get an instant paraphrase of this document with our AI Paraphraser
Financial analysis and management 8
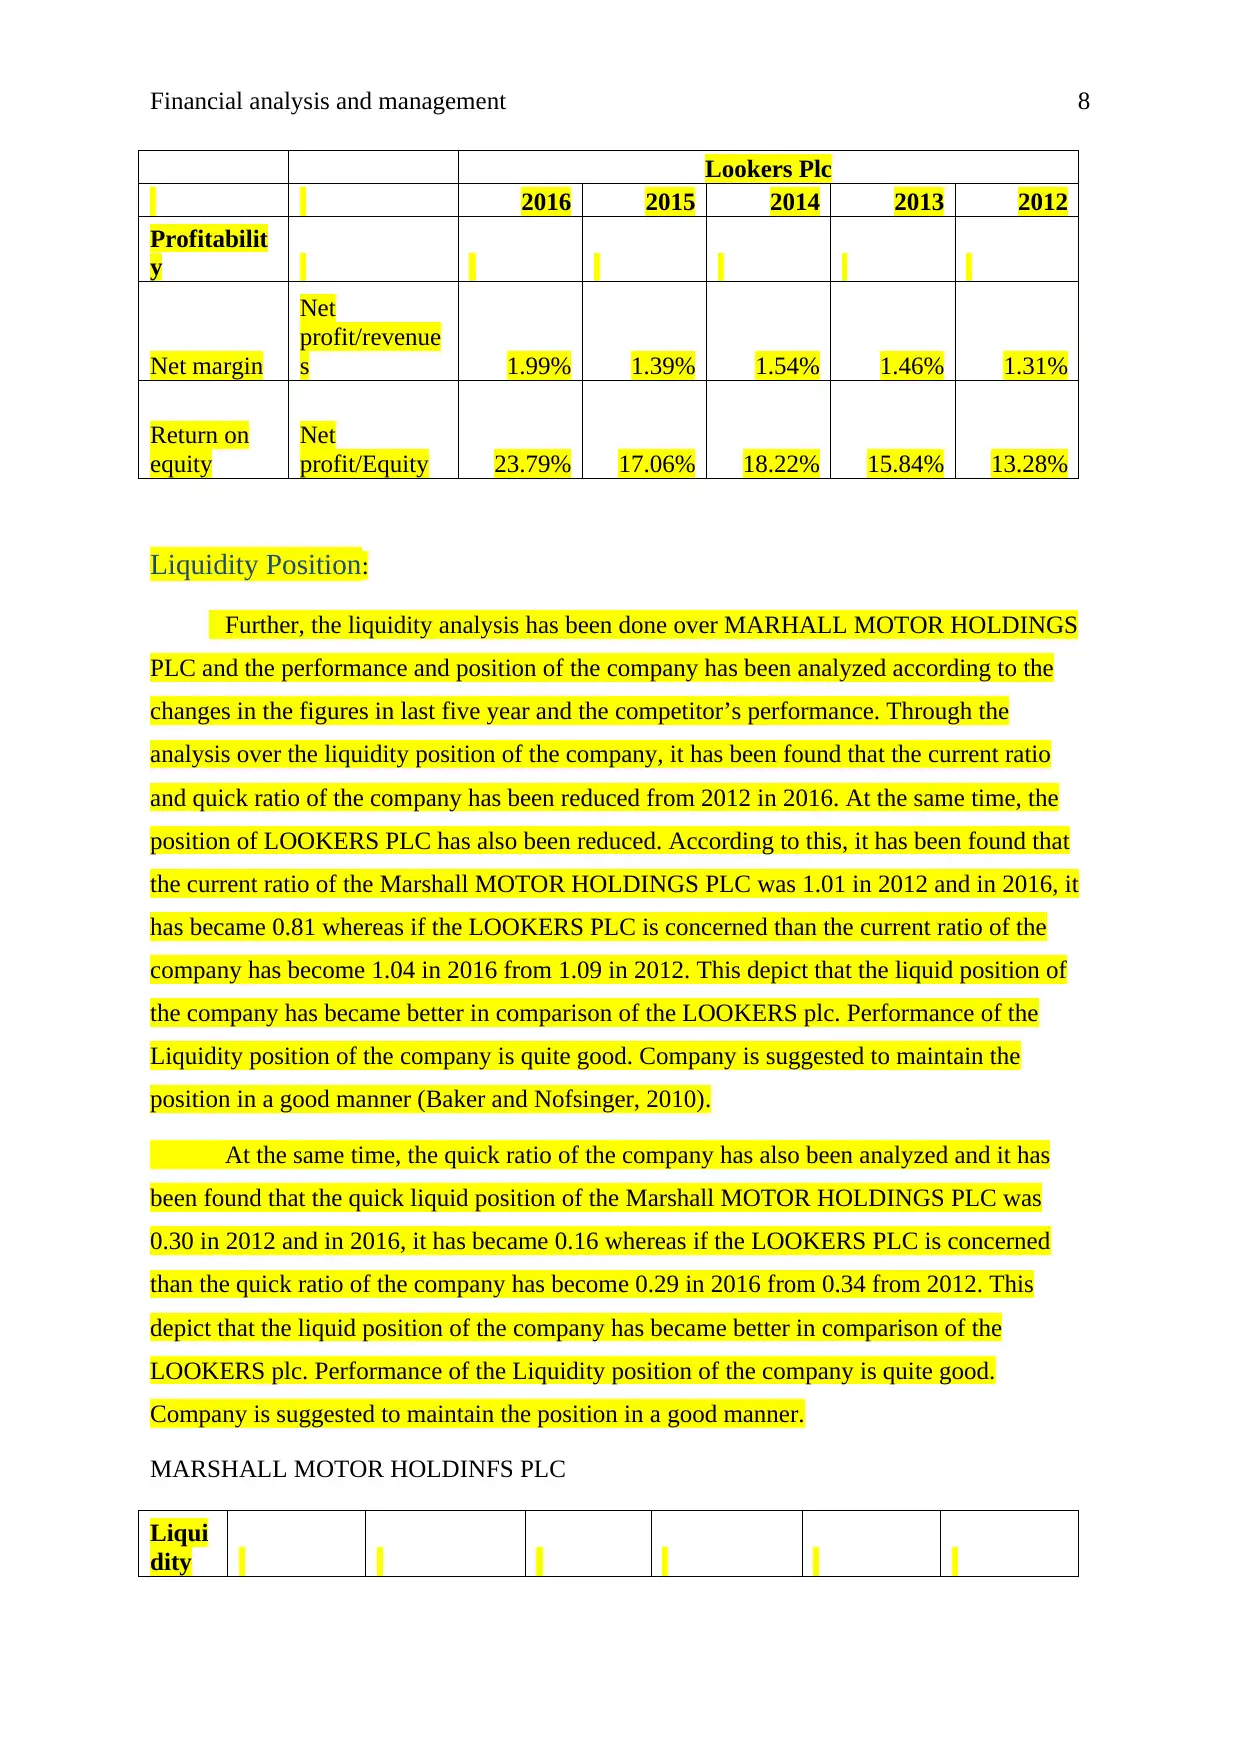
Lookers Plc
2016 2015 2014 2013 2012
Profitabilit
y
Net margin
Net
profit/revenue
s 1.99% 1.39% 1.54% 1.46% 1.31%
Return on
equity
Net
profit/Equity 23.79% 17.06% 18.22% 15.84% 13.28%
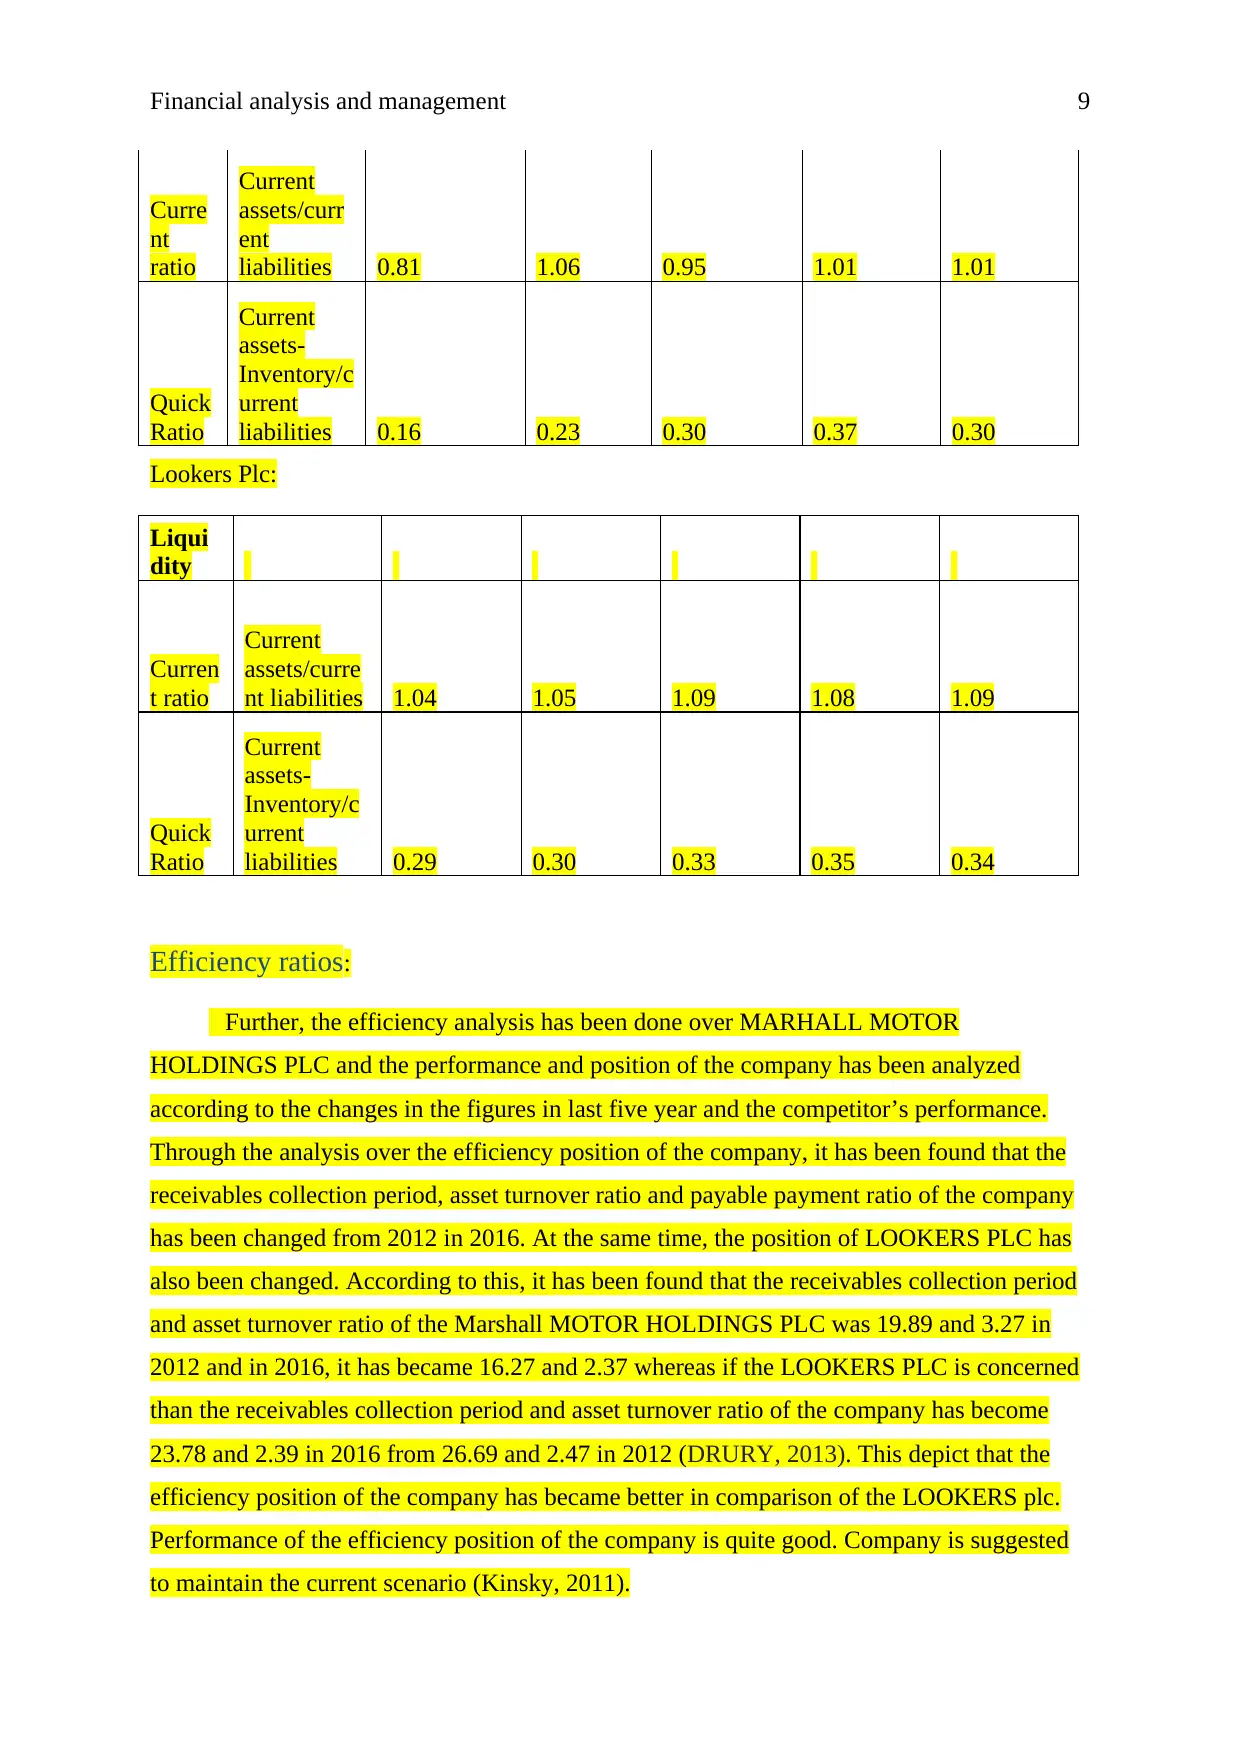
Liquidity Position:
Further, the liquidity analysis has been done over MARHALL MOTOR HOLDINGS
PLC and the performance and position of the company has been analyzed according to the
changes in the figures in last five year and the competitor’s performance. Through the
analysis over the liquidity position of the company, it has been found that the current ratio
and quick ratio of the company has been reduced from 2012 in 2016. At the same time, the
position of LOOKERS PLC has also been reduced. According to this, it has been found that
the current ratio of the Marshall MOTOR HOLDINGS PLC was 1.01 in 2012 and in 2016, it
has became 0.81 whereas if the LOOKERS PLC is concerned than the current ratio of the
company has become 1.04 in 2016 from 1.09 in 2012. This depict that the liquid position of
the company has became better in comparison of the LOOKERS plc. Performance of the
Liquidity position of the company is quite good. Company is suggested to maintain the
position in a good manner (Baker and Nofsinger, 2010).
At the same time, the quick ratio of the company has also been analyzed and it has
been found that the quick liquid position of the Marshall MOTOR HOLDINGS PLC was
0.30 in 2012 and in 2016, it has became 0.16 whereas if the LOOKERS PLC is concerned
than the quick ratio of the company has become 0.29 in 2016 from 0.34 from 2012. This
depict that the liquid position of the company has became better in comparison of the
LOOKERS plc. Performance of the Liquidity position of the company is quite good.
Company is suggested to maintain the position in a good manner.
MARSHALL MOTOR HOLDINFS PLC
Liqui
dity
Lookers Plc
2016 2015 2014 2013 2012
Profitabilit
y
Net margin
Net
profit/revenue
s 1.99% 1.39% 1.54% 1.46% 1.31%
Return on
equity
Net
profit/Equity 23.79% 17.06% 18.22% 15.84% 13.28%
Liquidity Position:
Further, the liquidity analysis has been done over MARHALL MOTOR HOLDINGS
PLC and the performance and position of the company has been analyzed according to the
changes in the figures in last five year and the competitor’s performance. Through the
analysis over the liquidity position of the company, it has been found that the current ratio
and quick ratio of the company has been reduced from 2012 in 2016. At the same time, the
position of LOOKERS PLC has also been reduced. According to this, it has been found that
the current ratio of the Marshall MOTOR HOLDINGS PLC was 1.01 in 2012 and in 2016, it
has became 0.81 whereas if the LOOKERS PLC is concerned than the current ratio of the
company has become 1.04 in 2016 from 1.09 in 2012. This depict that the liquid position of
the company has became better in comparison of the LOOKERS plc. Performance of the
Liquidity position of the company is quite good. Company is suggested to maintain the
position in a good manner (Baker and Nofsinger, 2010).
At the same time, the quick ratio of the company has also been analyzed and it has
been found that the quick liquid position of the Marshall MOTOR HOLDINGS PLC was
0.30 in 2012 and in 2016, it has became 0.16 whereas if the LOOKERS PLC is concerned
than the quick ratio of the company has become 0.29 in 2016 from 0.34 from 2012. This
depict that the liquid position of the company has became better in comparison of the
LOOKERS plc. Performance of the Liquidity position of the company is quite good.
Company is suggested to maintain the position in a good manner.
MARSHALL MOTOR HOLDINFS PLC
Liqui
dity
Financial analysis and management 9
Curre
nt
ratio
Current
assets/curr
ent
liabilities 0.81 1.06 0.95 1.01 1.01
Quick
Ratio
Current
assets-
Inventory/c
urrent
liabilities 0.16 0.23 0.30 0.37 0.30
Lookers Plc:
Liqui
dity
Curren
t ratio
Current
assets/curre
nt liabilities 1.04 1.05 1.09 1.08 1.09
Quick
Ratio
Current
assets-
Inventory/c
urrent
liabilities 0.29 0.30 0.33 0.35 0.34
Efficiency ratios:
Further, the efficiency analysis has been done over MARHALL MOTOR
HOLDINGS PLC and the performance and position of the company has been analyzed
according to the changes in the figures in last five year and the competitor’s performance.
Through the analysis over the efficiency position of the company, it has been found that the
receivables collection period, asset turnover ratio and payable payment ratio of the company
has been changed from 2012 in 2016. At the same time, the position of LOOKERS PLC has
also been changed. According to this, it has been found that the receivables collection period
and asset turnover ratio of the Marshall MOTOR HOLDINGS PLC was 19.89 and 3.27 in
2012 and in 2016, it has became 16.27 and 2.37 whereas if the LOOKERS PLC is concerned
than the receivables collection period and asset turnover ratio of the company has become
23.78 and 2.39 in 2016 from 26.69 and 2.47 in 2012 (DRURY, 2013). This depict that the
efficiency position of the company has became better in comparison of the LOOKERS plc.
Performance of the efficiency position of the company is quite good. Company is suggested
to maintain the current scenario (Kinsky, 2011).
⊘ This is a preview!⊘
Do you want full access?
Subscribe today to unlock all pages.
Trusted by 1+ million students worldwide
Financial analysis and management 10
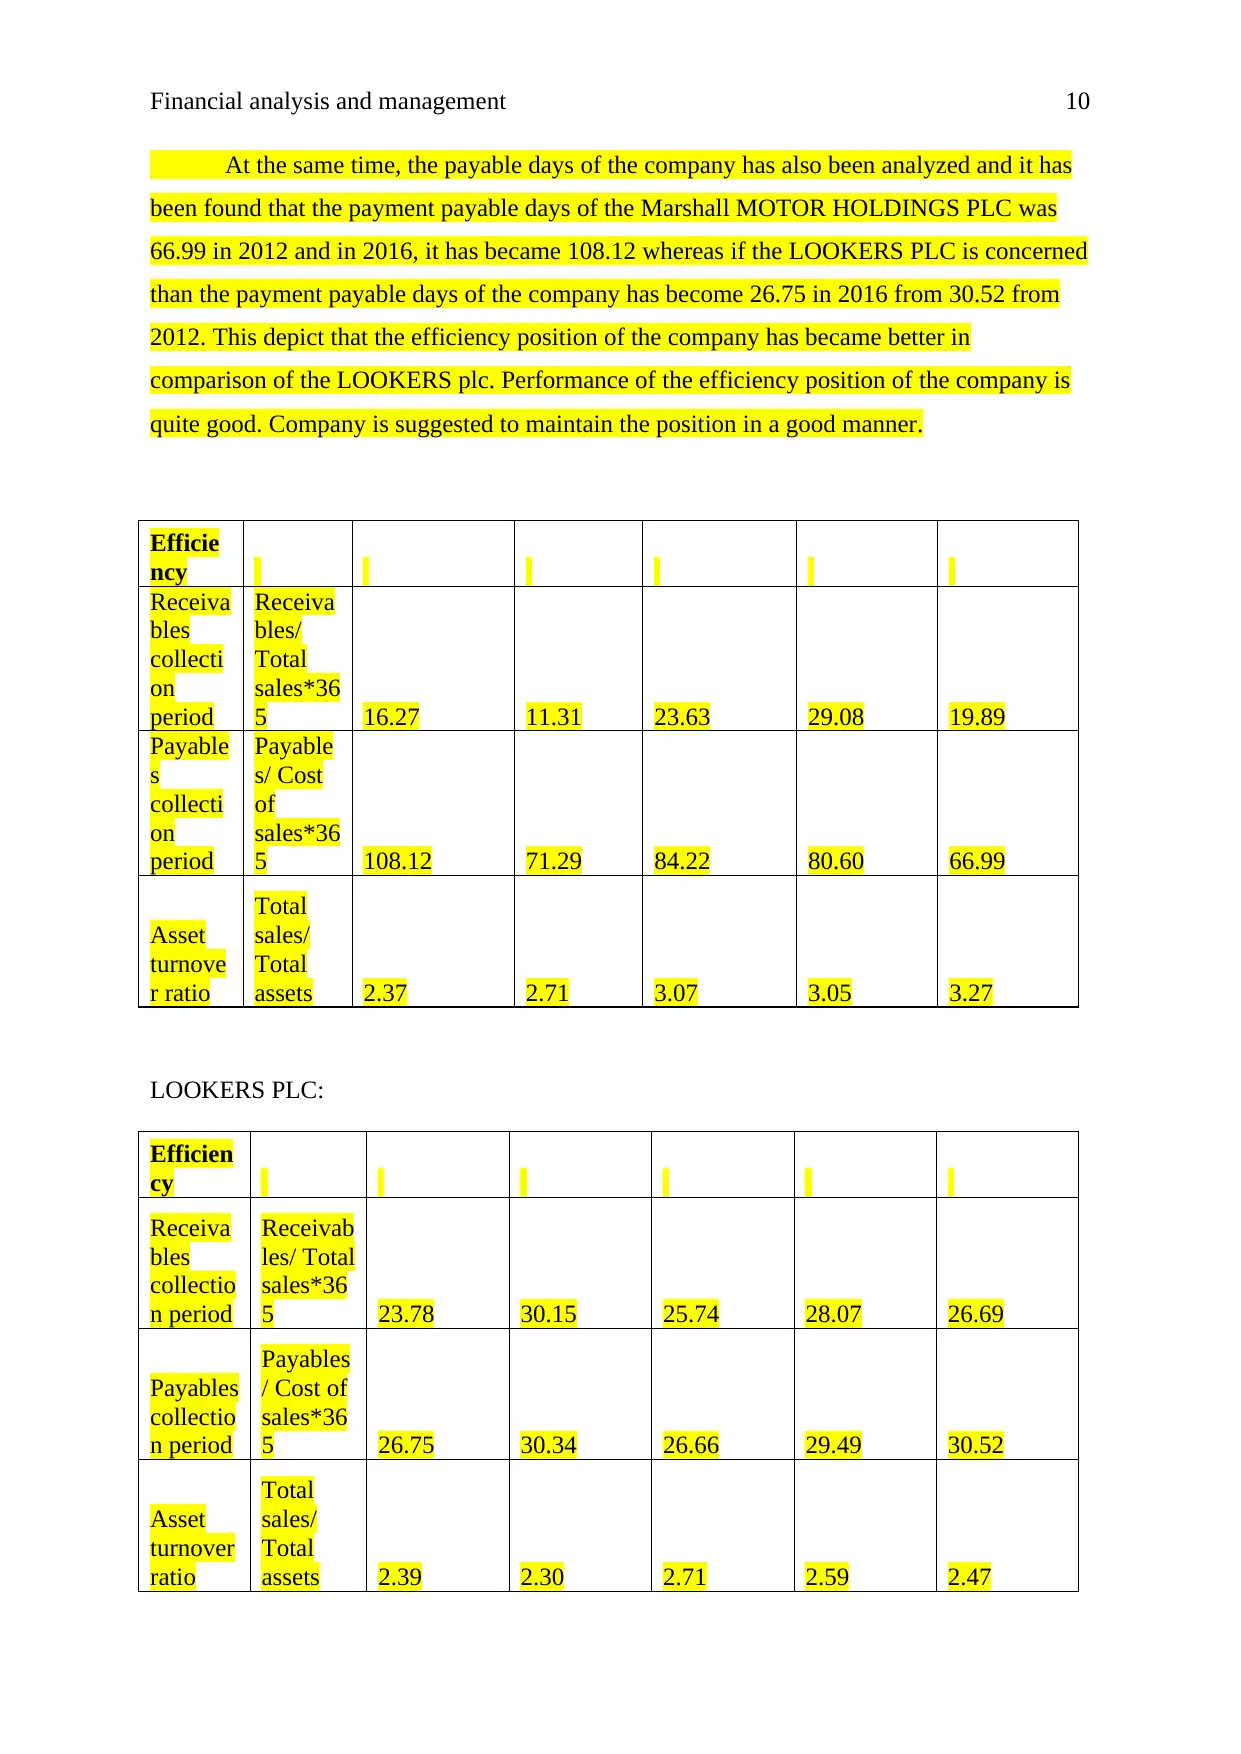
At the same time, the payable days of the company has also been analyzed and it has
been found that the payment payable days of the Marshall MOTOR HOLDINGS PLC was
66.99 in 2012 and in 2016, it has became 108.12 whereas if the LOOKERS PLC is concerned
than the payment payable days of the company has become 26.75 in 2016 from 30.52 from
2012. This depict that the efficiency position of the company has became better in
comparison of the LOOKERS plc. Performance of the efficiency position of the company is
quite good. Company is suggested to maintain the position in a good manner.
Efficie
ncy
Receiva
bles
collecti
on
period
Receiva
bles/
Total
sales*36
5 16.27 11.31 23.63 29.08 19.89
Payable
s
collecti
on
period
Payable
s/ Cost
of
sales*36
5 108.12 71.29 84.22 80.60 66.99
Asset
turnove
r ratio
Total
sales/
Total
assets 2.37 2.71 3.07 3.05 3.27
LOOKERS PLC:
Efficien
cy
Receiva
bles
collectio
n period
Receivab
les/ Total
sales*36
5 23.78 30.15 25.74 28.07 26.69
Payables
collectio
n period
Payables
/ Cost of
sales*36
5 26.75 30.34 26.66 29.49 30.52
Asset
turnover
ratio
Total
sales/
Total
assets 2.39 2.30 2.71 2.59 2.47
Paraphrase This Document
Need a fresh take? Get an instant paraphrase of this document with our AI Paraphraser
Financial analysis and management 11
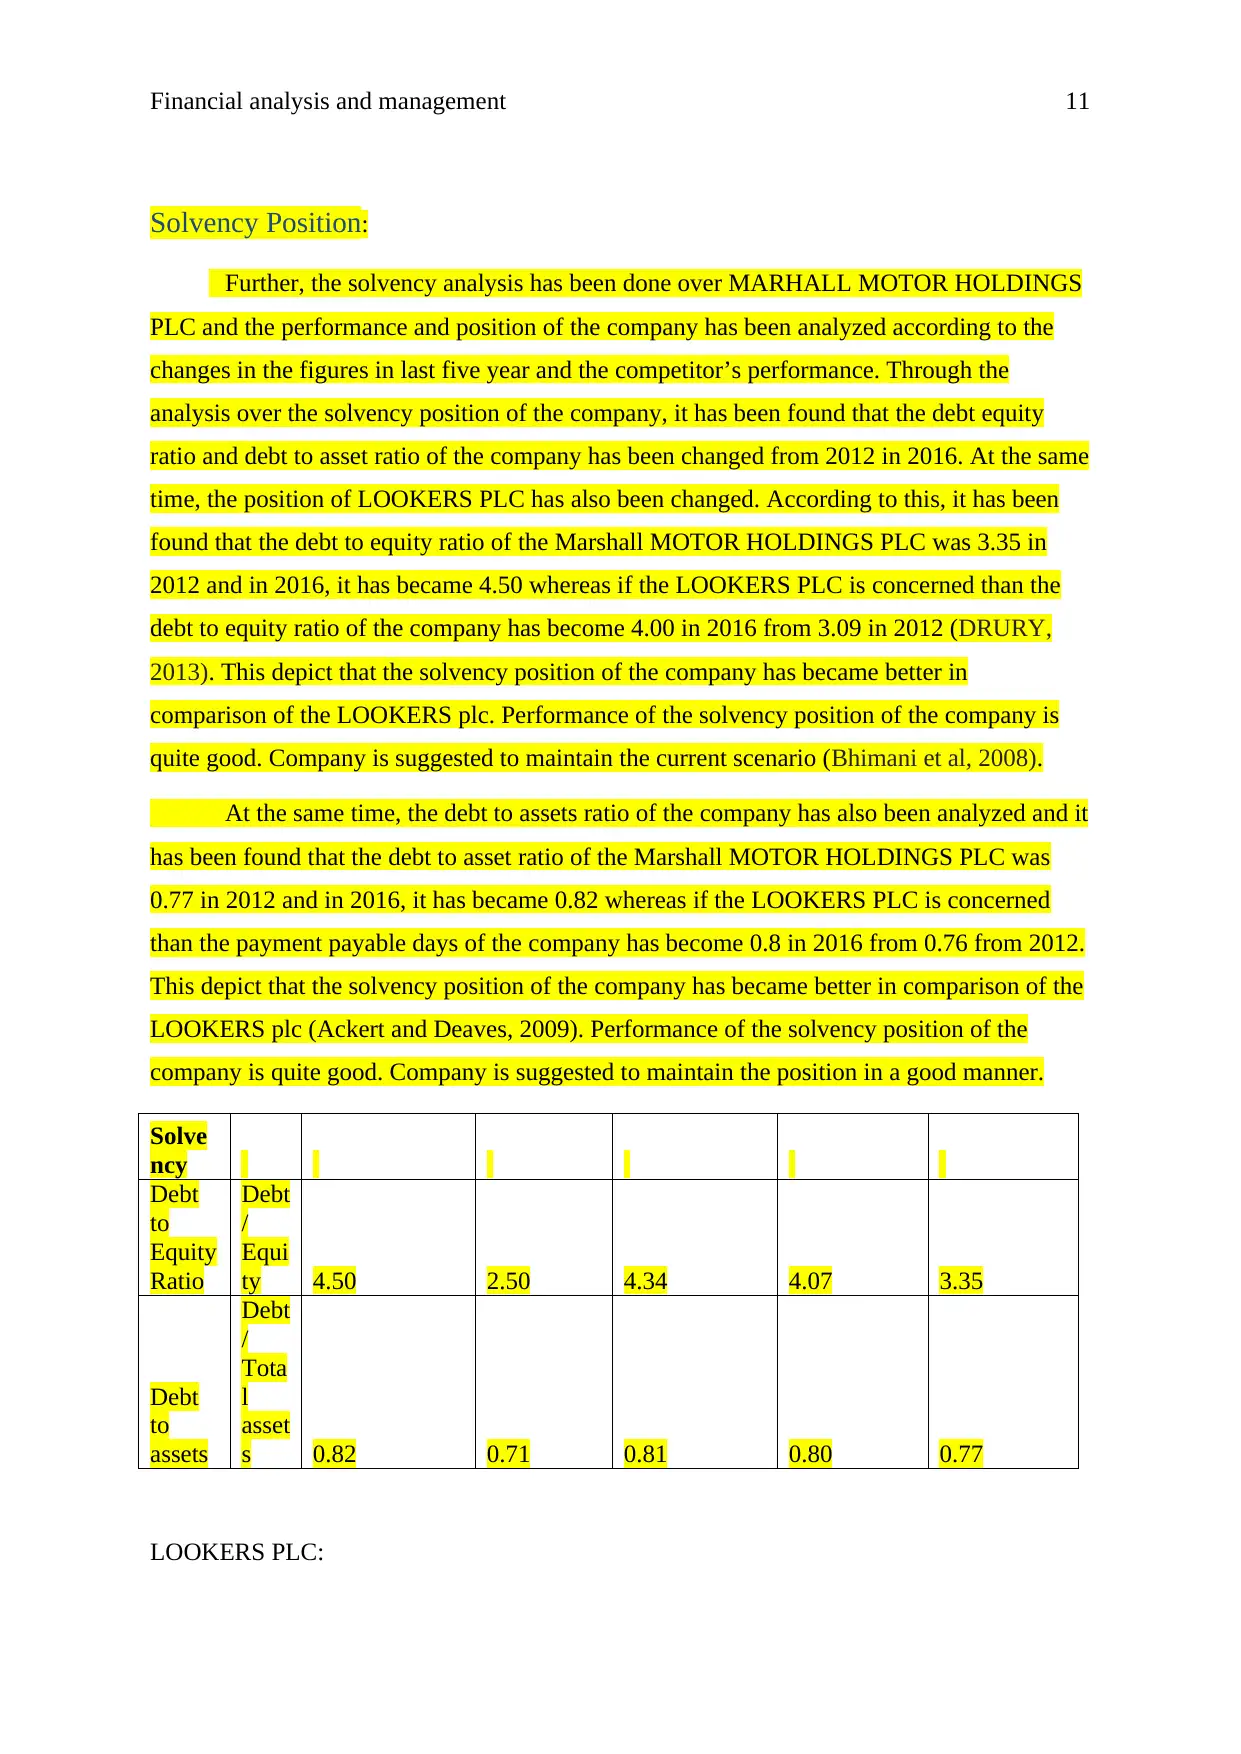
Solvency Position:
Further, the solvency analysis has been done over MARHALL MOTOR HOLDINGS
PLC and the performance and position of the company has been analyzed according to the
changes in the figures in last five year and the competitor’s performance. Through the
analysis over the solvency position of the company, it has been found that the debt equity
ratio and debt to asset ratio of the company has been changed from 2012 in 2016. At the same
time, the position of LOOKERS PLC has also been changed. According to this, it has been
found that the debt to equity ratio of the Marshall MOTOR HOLDINGS PLC was 3.35 in
2012 and in 2016, it has became 4.50 whereas if the LOOKERS PLC is concerned than the
debt to equity ratio of the company has become 4.00 in 2016 from 3.09 in 2012 (DRURY,
2013). This depict that the solvency position of the company has became better in
comparison of the LOOKERS plc. Performance of the solvency position of the company is
quite good. Company is suggested to maintain the current scenario (Bhimani et al, 2008).
At the same time, the debt to assets ratio of the company has also been analyzed and it
has been found that the debt to asset ratio of the Marshall MOTOR HOLDINGS PLC was
0.77 in 2012 and in 2016, it has became 0.82 whereas if the LOOKERS PLC is concerned
than the payment payable days of the company has become 0.8 in 2016 from 0.76 from 2012.
This depict that the solvency position of the company has became better in comparison of the
LOOKERS plc (Ackert and Deaves, 2009). Performance of the solvency position of the
company is quite good. Company is suggested to maintain the position in a good manner.
Solve
ncy
Debt
to
Equity
Ratio
Debt
/
Equi
ty 4.50 2.50 4.34 4.07 3.35
Debt
to
assets
Debt
/
Tota
l
asset
s 0.82 0.71 0.81 0.80 0.77
LOOKERS PLC:
Financial analysis and management 12
Solven
cy
Debt to
Equity
Ratio
Debt
/
Equi
ty 4.00 4.32 3.36 3.19 3.09
Debt to
assets
Debt
/
Total
asset
s 0.80 0.81 0.77 0.76 0.76
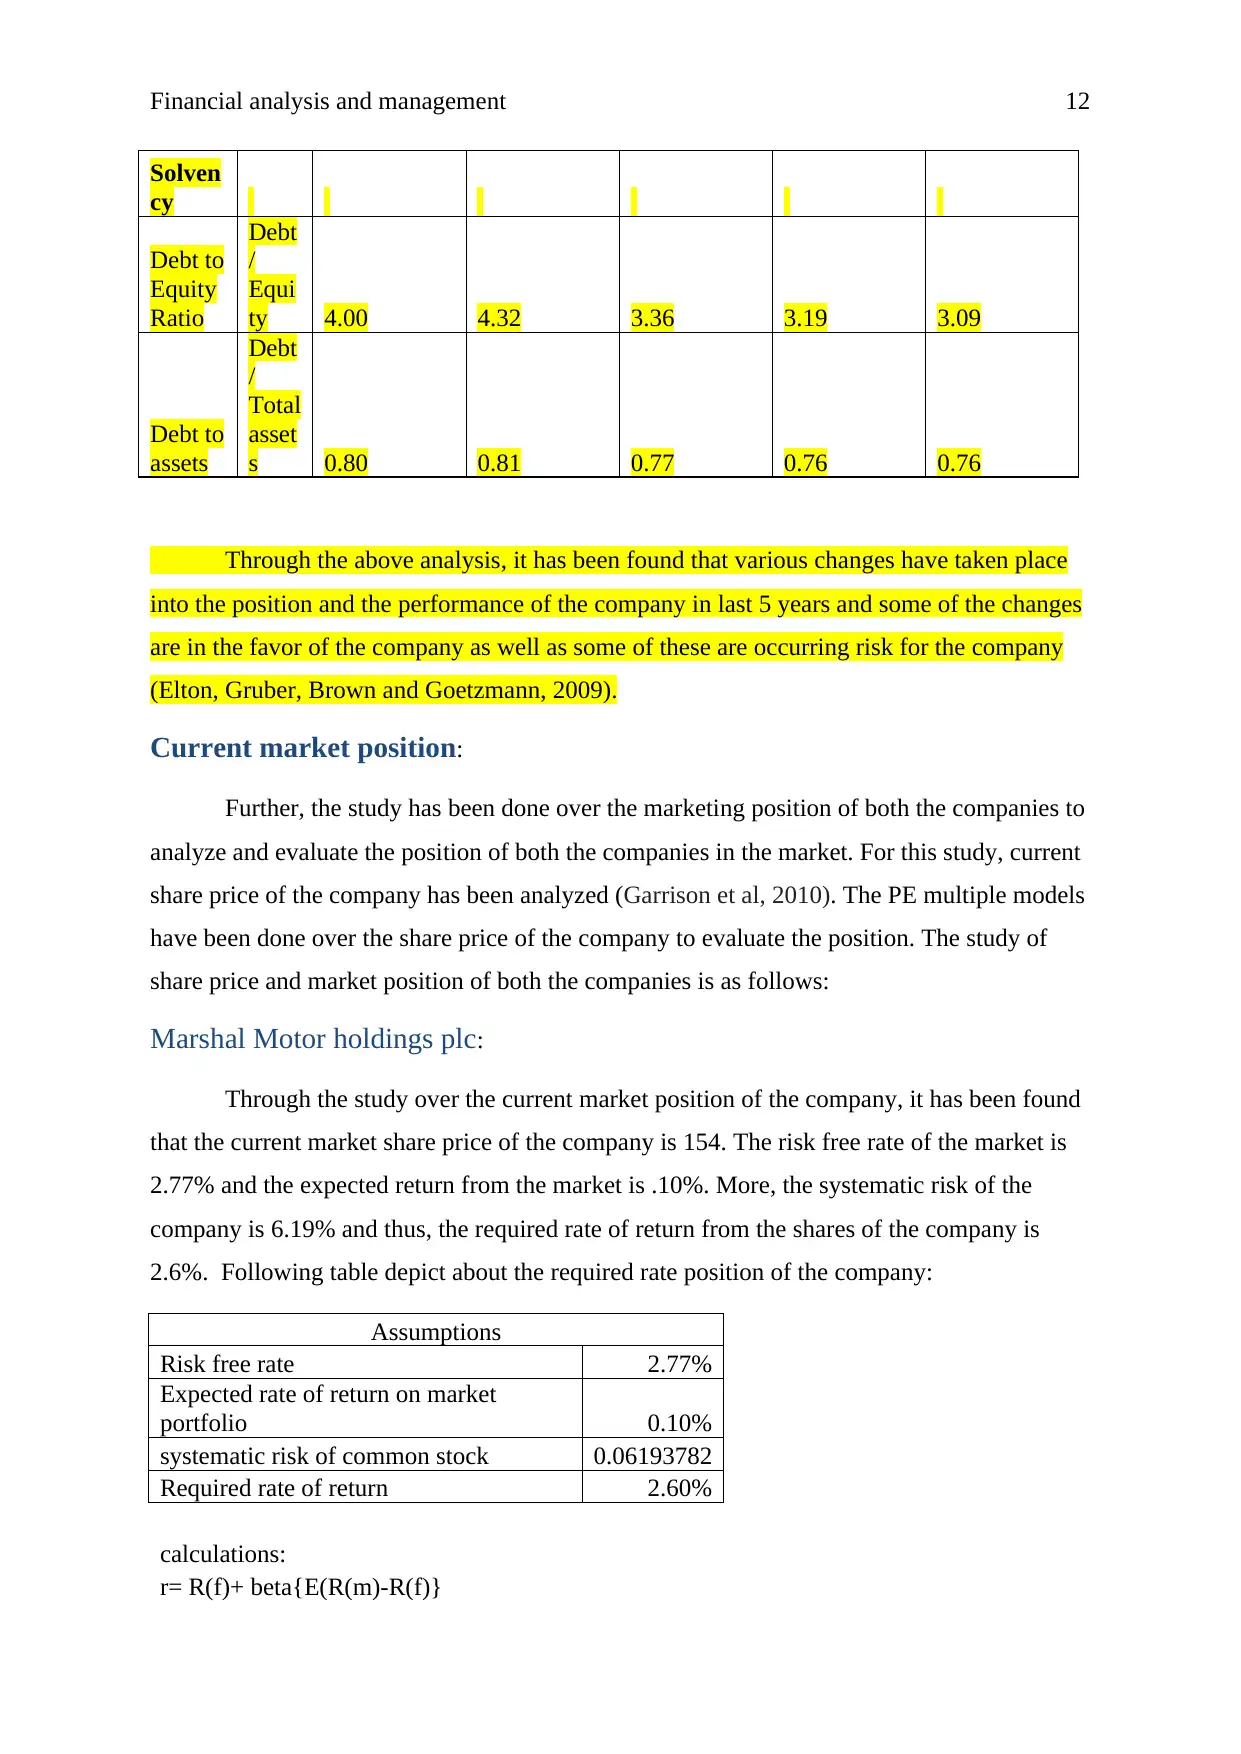
Through the above analysis, it has been found that various changes have taken place
into the position and the performance of the company in last 5 years and some of the changes
are in the favor of the company as well as some of these are occurring risk for the company
(Elton, Gruber, Brown and Goetzmann, 2009).
Current market position:
Further, the study has been done over the marketing position of both the companies to
analyze and evaluate the position of both the companies in the market. For this study, current
share price of the company has been analyzed (Garrison et al, 2010). The PE multiple models
have been done over the share price of the company to evaluate the position. The study of
share price and market position of both the companies is as follows:
Marshal Motor holdings plc:
Through the study over the current market position of the company, it has been found
that the current market share price of the company is 154. The risk free rate of the market is
2.77% and the expected return from the market is .10%. More, the systematic risk of the
company is 6.19% and thus, the required rate of return from the shares of the company is
2.6%. Following table depict about the required rate position of the company:
Assumptions
Risk free rate 2.77%
Expected rate of return on market
portfolio 0.10%
systematic risk of common stock 0.06193782
Required rate of return 2.60%
calculations:
r= R(f)+ beta{E(R(m)-R(f)}
Solven
cy
Debt to
Equity
Ratio
Debt
/
Equi
ty 4.00 4.32 3.36 3.19 3.09
Debt to
assets
Debt
/
Total
asset
s 0.80 0.81 0.77 0.76 0.76
Through the above analysis, it has been found that various changes have taken place
into the position and the performance of the company in last 5 years and some of the changes
are in the favor of the company as well as some of these are occurring risk for the company
(Elton, Gruber, Brown and Goetzmann, 2009).
Current market position:
Further, the study has been done over the marketing position of both the companies to
analyze and evaluate the position of both the companies in the market. For this study, current
share price of the company has been analyzed (Garrison et al, 2010). The PE multiple models
have been done over the share price of the company to evaluate the position. The study of
share price and market position of both the companies is as follows:
Marshal Motor holdings plc:
Through the study over the current market position of the company, it has been found
that the current market share price of the company is 154. The risk free rate of the market is
2.77% and the expected return from the market is .10%. More, the systematic risk of the
company is 6.19% and thus, the required rate of return from the shares of the company is
2.6%. Following table depict about the required rate position of the company:
Assumptions
Risk free rate 2.77%
Expected rate of return on market
portfolio 0.10%
systematic risk of common stock 0.06193782
Required rate of return 2.60%
calculations:
r= R(f)+ beta{E(R(m)-R(f)}
⊘ This is a preview!⊘
Do you want full access?
Subscribe today to unlock all pages.
Trusted by 1+ million students worldwide
1 out of 26
Related Documents


Your All-in-One AI-Powered Toolkit for Academic Success.
+13062052269
info@desklib.com
Available 24*7 on WhatsApp / Email
![[object Object]](/_next/static/media/star-bottom.7253800d.svg)
Unlock your academic potential
Copyright © 2020–2026 A2Z Services. All Rights Reserved. Developed and managed by ZUCOL.