Project Report: Advanced Financial Accounting and Reporting Analysis
VerifiedAdded on 2021/04/21
|25
|6682
|67
Project
AI Summary
This project report provides a comprehensive financial analysis of ABR Holdings Limited and BreadTalk Group Limited, two Singaporean food and beverage companies. The analysis includes a company brief for each, followed by detailed financial evaluations using vertical analysis, horizontal analysis, and ratio analysis to assess their financial positions and performance. Cash flow analysis and segment analysis are also included to provide a holistic view of the companies' financial health. The report compares the two companies, offering insights into their strengths, weaknesses, and overall investment potential, culminating in a recommendation and conclusion based on the findings. Trend analysis, vertical analysis, ratio analysis, cash flow analysis, and segment analysis are presented in the appendices to support the main findings.
Running Head: Advanced financial accounting and reporting
1
Project Report: Advanced financial accounting and reporting
1
Project Report: Advanced financial accounting and reporting
Paraphrase This Document
Need a fresh take? Get an instant paraphrase of this document with our AI Paraphraser
Advanced financial accounting and reporting 2
Contents
Introduction.......................................................................................................................3
Company brief..................................................................................................................3
ABR holdings limited...................................................................................................3
BreadTalk Group limited..............................................................................................3
Financial analysis..............................................................................................................4
Vertical analysis................................................................................................................4
Horizontal analysis...........................................................................................................5
Ratio analysis....................................................................................................................6
Cash flow analysis............................................................................................................7
Segment analysis..............................................................................................................7
Recommendation and Conclusion....................................................................................8
References.........................................................................................................................9
Appendix.........................................................................................................................11
Trend analysis.............................................................................................................11
Vertical analysis..........................................................................................................14
Ratio analysis..............................................................................................................18
Cash flow....................................................................................................................20
Segment analysis........................................................................................................22
Advanced financial accounting and reporting 3
Introduction:
The report has been prepared to evaluate the financial position and performance of
ABR Holdings Limited and BreadTalk Group Limited. Financial position and performance of
an organization could be evaluated through analyzing the financial statement of the company.
In the report, income statement, balance sheet, cash flow statement of the company has been
analyzed with the help of trend analysis, vertical analysis, ratio analysis etc. Financial
statement analysis makes it easy for the investors and the analyst to make decision about the
company’s performance and investment in the company.
Company brief:
ABR holdings limited:
ABR holdings limited are a food and beverage company in Singapore. The company
is listed on Singapore exchange, Sesdaq. Company has been established in 1978 and firstly,
Swensen’s franchise has been held by company. The company holds the casual dining
restaurant’s franchise in Oceania and Asia which has restaurant in Malaysia and Singapore.
Basically, the company manufactures the ice-cream together with its subsidiaries. The
company is involving into various functions such as managing, operating, franchising of food
and beverage companies and various brands like Yogen Fruz, coffees, Pizza, the Cocoa trees
etc. the main strength of the company is its reduced labour cost, domestic market, skilled
workforce, high refutability and turnover, barriers of market entry etc. (Home, 2018). On the
other hand, the weakness of the company is small business unit. Opportunities of the
organization are new markets and growth rate of the industry and profitability. On the other
hand, the main threats of the company are technology issues, competitor’s issues, increasing
rate of interest etc.
BreadTalk Group limited:
BreadTalk group limited is an international food and beverage company in Singapore.
The company is listed on Singapore exchange, Sesdaq. Company has been established in
2000 and headquarter of the company is at Paya Lebar in Singapore. The main USP of the
company is its brand that inspires people to think differently. Basically, the company targets
on people who experience food and follow the food trend. The company is involving into
various functions such as managing, operating, and franchising of food and beverage
companies and various brands (Home, 2018). The main strength of the company is its 40
⊘ This is a preview!⊘
Do you want full access?
Subscribe today to unlock all pages.
Trusted by 1+ million students worldwide
Advanced financial accounting and reporting 4
retail stores in Singapore, wide range of cakes, buns, bread and pastries, presence in many
countries, global strength of 7000 employees. On the other hand, the weakness of the
company is invisibility of brand, low barriers, various retail brand in the same industry etc.
Opportunities of the organization are new markets and growth rate of the industry and
profitability. On the other hand, the main threats of the company are technology issues,
competitor’s issues, increasing rate of interest etc.
Financial analysis:
Financial analysis is a procedure which evaluates the business, budgets, projects and
various other projects related to finance of an organization to determine the sustainability and
performance of the organization. Financial analysis is usually done to evaluate that whether
an organization is liquid, solvent, stable, and profitable enough to manage its financial
functions (Ackert and Deaves, 2009). Financial analyst mainly evaluates the financial
statement of an organization to evaluate the performance. In the report, financial position and
performance of ABR holdings and BreadTalk has been evaluated to reach over a conclusion
about better company in relation to investment.
Vertical analysis:
Vertical analysis is a process to evaluate the financial statement of an organization. In
vertical analysis, each entry for three major categories of revenue, liabilities and assets are
represented as a part of total account. Vertical analysis is also used to evaluate the financial
statement as a % measure. The vertical analysis on income statement of ABR holdings
limited and BreadTalk limited has been evaluated. It expresses about the changes in the
income statement from last year as well as it compares the accounts and transaction from the
comparative company (Baker and Weigand, 2015). The analysis expresses that the cost of
revenue of ABR holdings have been enhanced from last year and due to it, the gross profit of
the company has been reduced. Further, it explains about total operating expenses, operating
income, net income etc of the company. Operating expenses of the company has become
39.30% from 38.07% and the operating income of the company has been lowered by 2.73%
whereas the net profit of the company has been has also been lowered from last year
(Morningstar, 2018).
Same study on BreadTalk explains that cost of revenue of company has been reduced
from last year and due to it, the gross profit of the company has been enhanced in 2016.
Further, it explains about total operating expenses which has been enhanced to 53.94%,
Paraphrase This Document
Need a fresh take? Get an instant paraphrase of this document with our AI Paraphraser
Advanced financial accounting and reporting 5
operating income which have been lowered to 0.94% from 1.88% in 2016, net income has
been enhanced to 1.86% from last year (Barman, 2008).
The comparative study on both the income statement explains that the gross profit of
BreadTalk is quite higher than ABR holdings. But at the same time, operating expenses of
BreadTalk is also higher, due to which, net profit of ABR holdings is higher than the net
profit of BreadTalk. It explains that the ABR holding is performing better on the market.
Vertical analysis study on balance sheet has also been conducted and it has been
found that the total current assets of ABR holdings limited is 77.89% of total assets whereas
tithe total current liabilities of company is 13.39% and total liabilities of the company are
14.97% of total liabilities and stock holder’s equity (Arnold, 2013). It explains about the
financial structure of the company. Balance sheet of BreadTalk limited explains that the total
current assets of ABR holdings limited is 39.62% of total assets whereas the total current
liabilities of company is 40.43% and total liabilities of the company are 75.27% of total
liabilities and stock holder’s equity. The comparative study on both the balance sheet
explains that the capital structure of ABR holdings is better. The company has managed total
current assets, liabilities, equity etc in competitive way.
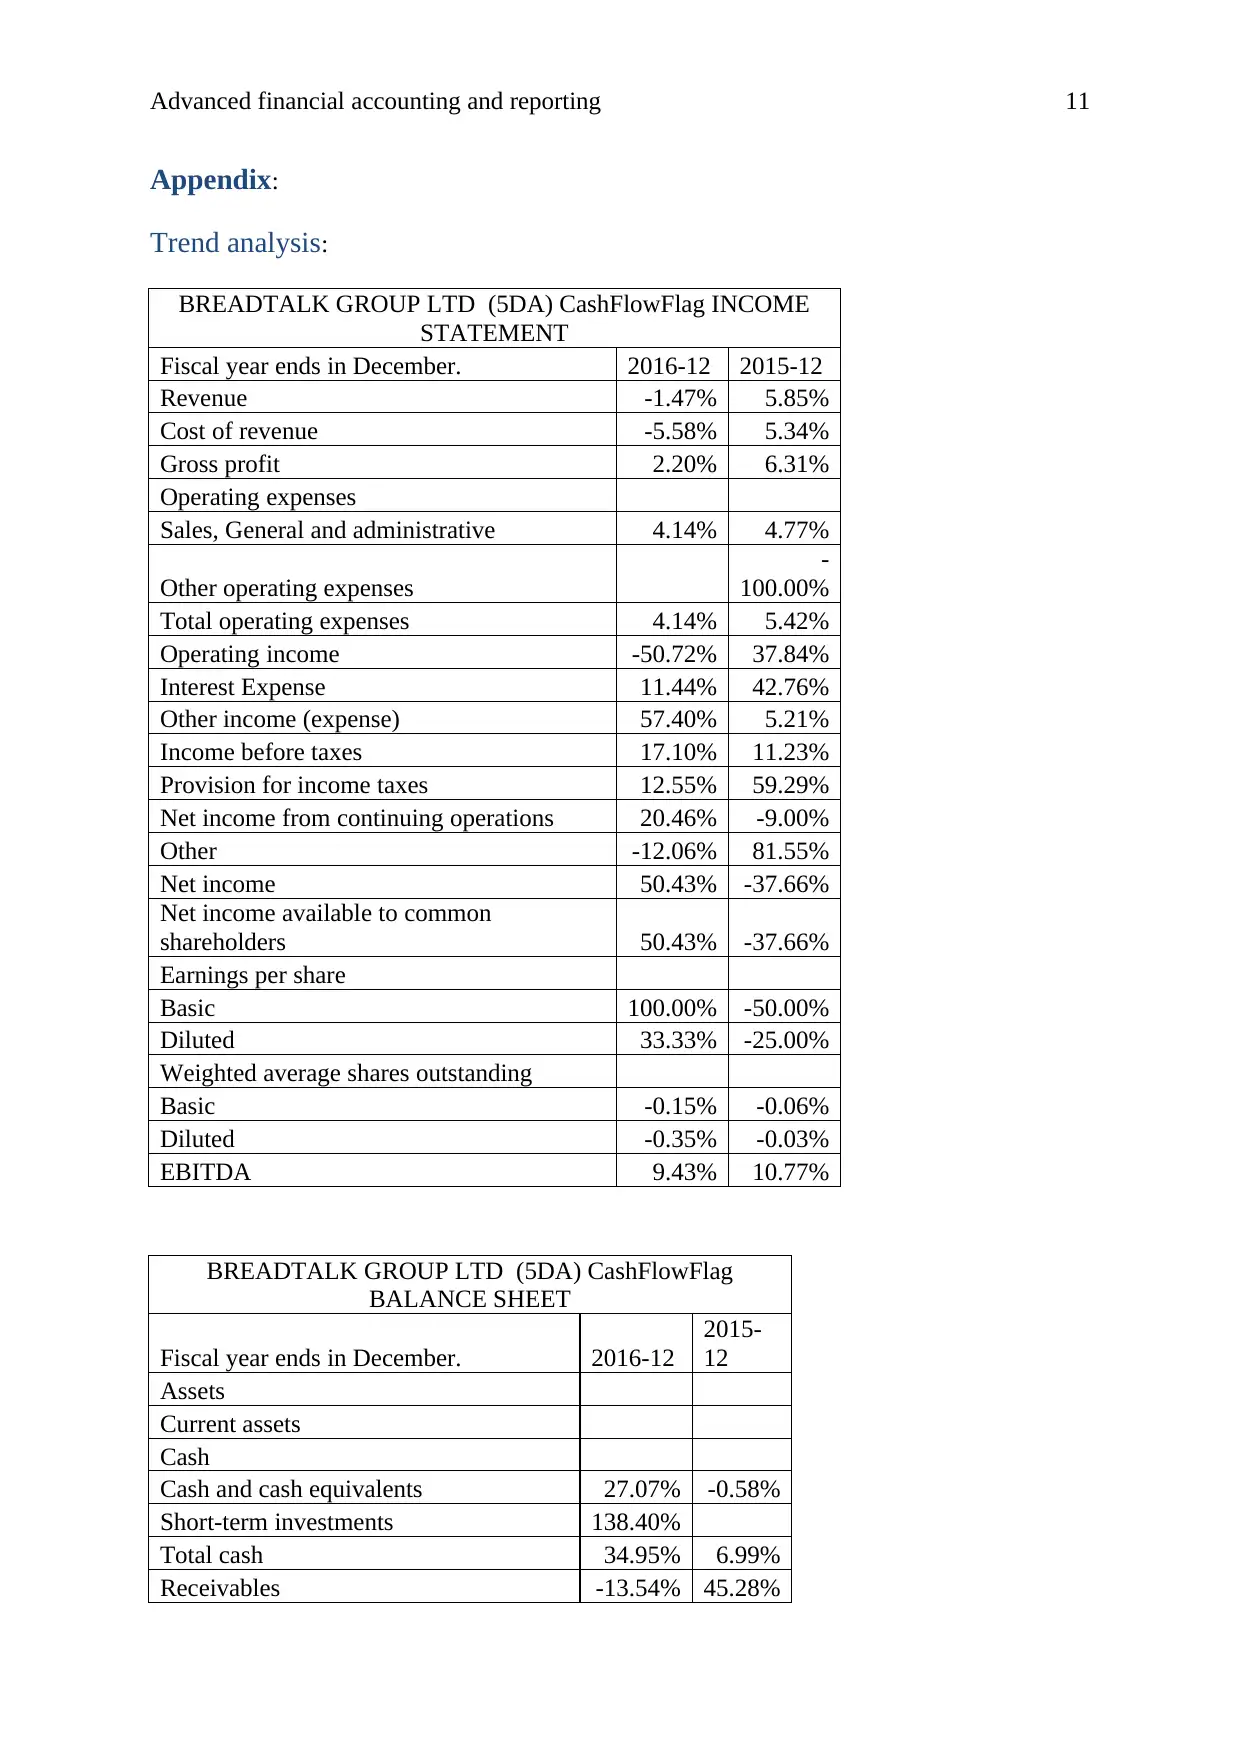
Horizontal analysis:
Horizontal analysis is a process to evaluate the financial statement of an organization.
In horizontal analysis, changes in the financial statement in a period are calculated.
Horizontal analysis is also used to evaluate the financial statement as a % measure. The
horizontal analysis on income statement of ABR holdings limited and BreadTalk limited has
been evaluated (Baker and Nofsinger, 2010). It expresses about the changes in the income
statement from last year as well as it compares the accounts and transaction from the
comparative company. The analysis expresses that the revenue of ABR holdings have been
enhanced from last year by 3.5% and gross profit of the company has been enhanced by
0.12%. Further, it explains about total operating expenses, operating income, net income etc
of the company. Operating expenses of the company has been enhanced by 6.84% and the
operating income of the company has been lowered by 32.69% whereas the net profit of the
company has been has also been lowered from last year by 25.99% (Besley and Brigham,
2008).
Further, the income statement of BreadTalk explains that the revenue of company has
been lowered from last year by 1.47% and gross profit of the company has been enhanced by
operating income which have been lowered to 0.94% from 1.88% in 2016, net income has
been enhanced to 1.86% from last year (Barman, 2008).
The comparative study on both the income statement explains that the gross profit of
BreadTalk is quite higher than ABR holdings. But at the same time, operating expenses of
BreadTalk is also higher, due to which, net profit of ABR holdings is higher than the net
profit of BreadTalk. It explains that the ABR holding is performing better on the market.
Vertical analysis study on balance sheet has also been conducted and it has been
found that the total current assets of ABR holdings limited is 77.89% of total assets whereas
tithe total current liabilities of company is 13.39% and total liabilities of the company are
14.97% of total liabilities and stock holder’s equity (Arnold, 2013). It explains about the
financial structure of the company. Balance sheet of BreadTalk limited explains that the total
current assets of ABR holdings limited is 39.62% of total assets whereas the total current
liabilities of company is 40.43% and total liabilities of the company are 75.27% of total
liabilities and stock holder’s equity. The comparative study on both the balance sheet
explains that the capital structure of ABR holdings is better. The company has managed total
current assets, liabilities, equity etc in competitive way.
Horizontal analysis:
Horizontal analysis is a process to evaluate the financial statement of an organization.
In horizontal analysis, changes in the financial statement in a period are calculated.
Horizontal analysis is also used to evaluate the financial statement as a % measure. The
horizontal analysis on income statement of ABR holdings limited and BreadTalk limited has
been evaluated (Baker and Nofsinger, 2010). It expresses about the changes in the income
statement from last year as well as it compares the accounts and transaction from the
comparative company. The analysis expresses that the revenue of ABR holdings have been
enhanced from last year by 3.5% and gross profit of the company has been enhanced by
0.12%. Further, it explains about total operating expenses, operating income, net income etc
of the company. Operating expenses of the company has been enhanced by 6.84% and the
operating income of the company has been lowered by 32.69% whereas the net profit of the
company has been has also been lowered from last year by 25.99% (Besley and Brigham,
2008).
Further, the income statement of BreadTalk explains that the revenue of company has
been lowered from last year by 1.47% and gross profit of the company has been enhanced by
Advanced financial accounting and reporting 6
2.20%. Further, it explains about total operating expenses, operating income, net income etc
of the company. Operating income of the company has been lowered by 50.72% whereas the
net profit of the company has been has been enhanced from last year by 50.43%. It explains
that the financial performance and position of ABR holding is better (Deegan, 2013).
Further, the balance sheet of both the company has been evaluated and it has been
found that the total current assets of ABR holding has been lower from last year but at the
same time, total assets have been enhanced. Further, it explains that the total current
liabilities, total liabilities and stock holder equity of the company has been enhanced from
last year and explain about the strong position of the company (Brealey, Myers and Marcus,
2007).
Balance sheet of BreadTalk limited explains that the total current assets of the
company have been enhanced by 17.96% and total assets have been lowered by 2.06% from
last year. Total current liabilities, total liabilities of the company have also been lowered
whereas the stockholder equity of the company has been enhanced. It explains that the
financial performance and position of ABR holding is better.
Ratio analysis:
Ratio analysis is a technique to analyze the financial statement and determine the
financial position and performance of the company. Ratio analysis briefs about the liquid
position, profitability ratio, debt management ratio, market value etc (Garrison et al, 2010). In
the report, profitability, liquidity, efficiency and solvency ratio of the companies have been
calculated.
Profitability ratio of ABR holdings limited expresses about the lower position of the company
from last year. It explains that the net profit of the company has been reduced from 7.55% to
5.4% and the ROE has been reduced to 5.64% from 7.66% whereas the profitability ratio of
BreadTalk limited express that the Net margin and ROE of the company has been enhanced
from last year to 1.86% and 8.66% respectively. It explains that the position of BreadTalk is
better in terms of increment but the rate of ABR is better (Higgins, 2012).
Further, liquidity ratio of both the company expresses that the ABR limited is not
utilizing the resources at its maximum. Though, the short term debt obligation of the
company is quite better. BreadTalk limited is managing the current assets and current
liabilities according to the industry ratio and thus the position of BreadTalk limited is way
better. Further, efficiency ratio has been calculated and it has been found that the working
⊘ This is a preview!⊘
Do you want full access?
Subscribe today to unlock all pages.
Trusted by 1+ million students worldwide
Advanced financial accounting and reporting 7
capital management of ABR holding limited is way better than BreadTalk limited as the
debtor’s turnover and asset turnover of the company is higher than the BreadTalk limited.
Lastly, the solvency ratio has been calculated and it has been found that the capital
structure of ABR holdings and BreadTalk both are not optimal (Hillier, Grinblatt and Titman,
2011). ABR holdings limited have lowered the debt in context of equity of the company
whereas the BreadTalk limited’s equity is way higher than ABR holdings limited. Through
the analysis, it has been observed that the ABR position is way better than BreadTalk limited.
Cash flow analysis:
Cash flow analysis evaluated about the cash position of a company. It indicates about
the different cash outflows and inflows of the company. Cash flow of ABR holdings limited
has been analyzed firstly. Through the analysis, it has been found that the net cash of the
company from operating activities has been lowered from last year due to less income. On the
other hand, cash flow from investing activities has been lowered due to huge investments.
Further, cash outflow is higher in financial activities. It explains that the cash inflow of the
company is lower than the cash outflow.
Further, the cash flow of BreadTalk has been evaluated and it has been found that the
cash inflow from operational activities is quite higher than the cash outflow of the company.
Further, the cash flow from investing activities explains that the company has lowered the
cash outflow from last year (Horngren et al, 2005). More, the cash flow from financing
activities explains that the outflow of the company has been lowered. It explains that total
cash flow of the company has been better than last year.
Segment analysis:
Segment is a process to divide the organization on the basis of its operations,
functions; division etc. segment analysis makes it easy for the analyst to evaluate that which
segment offers higher revenue to the company. Segment analysis of ABR holdings limited
explains that the higher revenue of the company is from restaurant segment. Other segment of
the company offers lesser revenue. Further, the assets and liabilities of Restaurant are higher
than any other segment (Madhura, 2011). It explains that the main segment of the company is
Restaurant and company should focus on other elements as well to enhance the profitability.
Further, Segment analysis of BreadTalk limited explains that the higher revenue of
the company is from Bakery operations, food restaurant and court operations. Other segment
Paraphrase This Document
Need a fresh take? Get an instant paraphrase of this document with our AI Paraphraser
Advanced financial accounting and reporting 8
of the company offers lesser revenue (Annual report, 2016). The net profit of food restaurant
is higher than other segments. Further, the assets and liabilities of all the segments are quite
similar (Annual Report, 2016). It explains that the company has invested in all the segments
but the profitable segment of the company is Bakery operations, food restaurant and court
operations (Kaplan and Atkinson, 2015).
Recommendation and Conclusion:
The above analysis explains that the profitability level of BreadTalk is increasing but
still, the level of ABR limited is higher than the BreadTalk limited. According to the above
study and analysis, it is recommended to the inventors to invest into ABR holding limited as
the company is more profitable than BreadTalk limited, trend analysis and vertical analysis
briefs about the better position of the company. Cash flow analysis explains about the lower
cash inflow of the comapny which has taken place due to huge investment. Further, the ratio
analysis explains about higher financial position of ABR holdings. Thus, to conclude,
investors must invest into ABR holdings for better revenue and returns.
Advanced financial accounting and reporting 9
References:
Ackert, L. and Deaves, R. 2009. Behavioral Finance: Psychology, Decision-Making, and
Markets. Cengage Learning.
Annual Report. 2018. ADR Holdings limited. [online]. Available at:
http://www.abr.com.sg/pdf/ABR_Annual_Report_2016.pdf [Accessed as on 9th Mar 2018].
Annual Report. 2018. BreadTalk Limited. [online]. Available at:
http://breadtalk.listedcompany.com/misc/ar2016/index.html#16 [Accessed as on 9th Mar
2018].
Arnold, G., 2013. Corporate financial management. Pearson Higher Ed.
Baker, H.K. and Nofsinger, J.R. 2010. Behavioral Finance: Investors, Corporations, and
Markets. John Wiley & Sons.
Baker, H.K. and Weigand, R., 2015. Corporate dividend policy revisited. Managerial
Finance, 41(2), pp.126-144.
Barman, G.P., 2008. An evaluation of how dividend policies impact on the share value of
selected companies.
Besley, S. and Brigham, E.F., 2008. Essentials of managerial finance. Thomson South-
Western.
Brealey, R., Myers, S.C. and Marcus, A.J., 2007. FundamentalsofCorporate Finance. Mc
Graw Hill, New York.
Deegan, C., 2013. Financial accounting theory. McGraw-Hill Education Australia.
Garrison, R.H., Noreen, E.W., Brewer, P.C. and McGowan, A., 2010. Managerial
accounting. Issues in Accounting Education, 25(4), pp.792-793.
Higgins, R. C., 2012. Analysis for financial management. McGraw-Hill/Irwin.
⊘ This is a preview!⊘
Do you want full access?
Subscribe today to unlock all pages.
Trusted by 1+ million students worldwide
Advanced financial accounting and reporting 10
Hillier, D., Grinblatt, M. and Titman, S., 2011. Financial markets and corporate strategy.
McGraw Hill.
Home. 2018. ADR holdings limited. [Online]. Available at: http://www.abr.com.sg/
[Accessed as on 9th Mar 2018].
Home. 2018. BreadTalk Limited. [online]. Available at: https://www.breadtalk.com/en/
[Accessed as on 9th Mar 2018].
Horngren, C.T., Sundem, G.L., Stratton, W.O., Burgstahler, D. and Schatzberg, J., 2005.
Introduction to management accounting. Upper Saddle River, New Jersey: Prentice Hall.
Kaplan, R.S. and Atkinson, A.A., 2015. Advanced management accounting. PHI Learning.
Madura, J., 2011. International financial management. Cengage Learning.
Morningstar. 2018. ADR Holdings limited. [online]. Available at:
http://financials.morningstar.com/cash-flow/cf.html?t=5DA®ion=sgp&culture=en-US
[Accessed as on 9th Mar 2018].
Morningstar. 2018. BreadTalk Limited. [online]. Available at:
http://financials.morningstar.com/income-statement/is.html?t=533®ion=sgp [Accessed as
on 9th Mar 2018].
Paraphrase This Document
Need a fresh take? Get an instant paraphrase of this document with our AI Paraphraser
Advanced financial accounting and reporting 11
Appendix:
Trend analysis:
BREADTALK GROUP LTD (5DA) CashFlowFlag INCOME
STATEMENT
Fiscal year ends in December. 2016-12 2015-12
Revenue -1.47% 5.85%
Cost of revenue -5.58% 5.34%
Gross profit 2.20% 6.31%
Operating expenses
Sales, General and administrative 4.14% 4.77%
Other operating expenses
-
100.00%
Total operating expenses 4.14% 5.42%
Operating income -50.72% 37.84%
Interest Expense 11.44% 42.76%
Other income (expense) 57.40% 5.21%
Income before taxes 17.10% 11.23%
Provision for income taxes 12.55% 59.29%
Net income from continuing operations 20.46% -9.00%
Other -12.06% 81.55%
Net income 50.43% -37.66%
Net income available to common
shareholders 50.43% -37.66%
Earnings per share
Basic 100.00% -50.00%
Diluted 33.33% -25.00%
Weighted average shares outstanding
Basic -0.15% -0.06%
Diluted -0.35% -0.03%
EBITDA 9.43% 10.77%
BREADTALK GROUP LTD (5DA) CashFlowFlag
BALANCE SHEET
Fiscal year ends in December. 2016-12
2015-
12
Assets
Current assets
Cash
Cash and cash equivalents 27.07% -0.58%
Short-term investments 138.40%
Total cash 34.95% 6.99%
Receivables -13.54% 45.28%
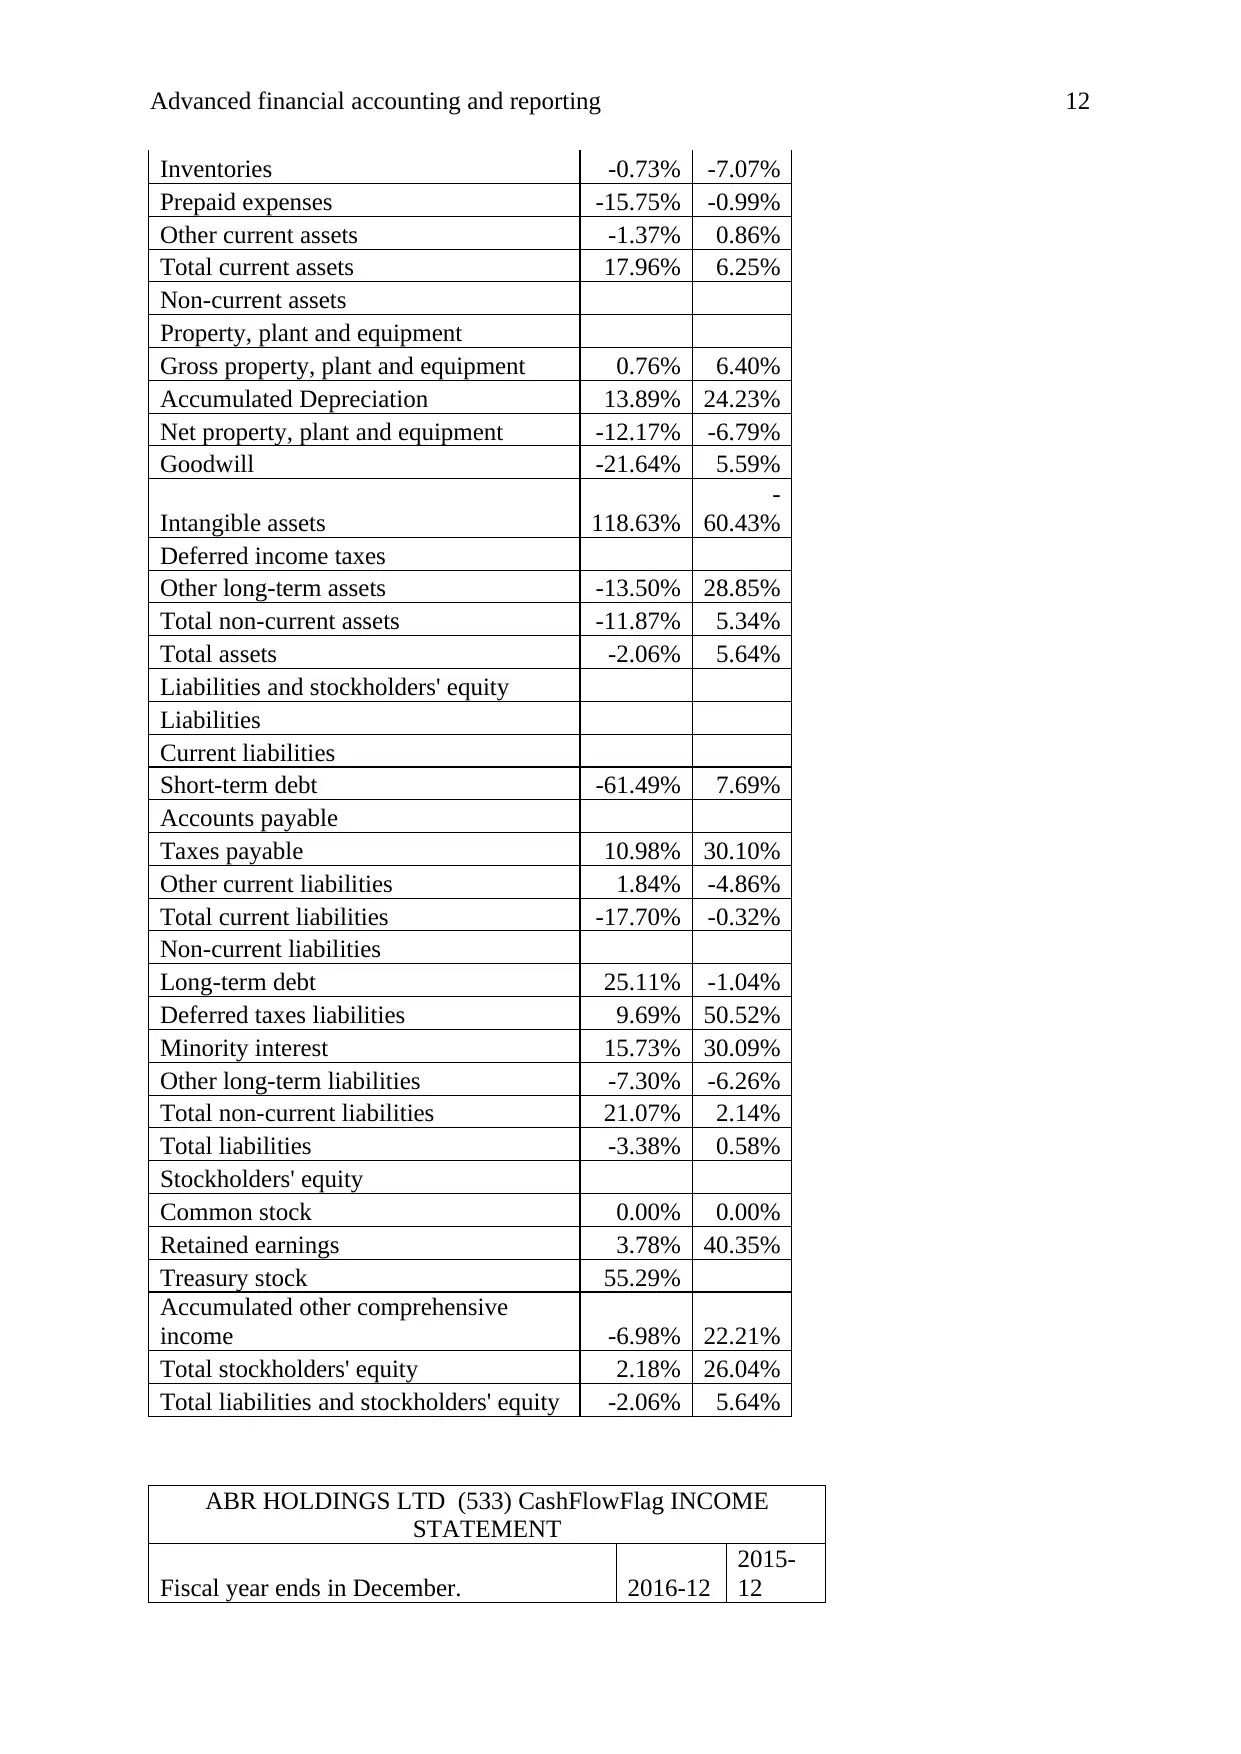
Advanced financial accounting and reporting 12
Inventories -0.73% -7.07%
Prepaid expenses -15.75% -0.99%
Other current assets -1.37% 0.86%
Total current assets 17.96% 6.25%
Non-current assets
Property, plant and equipment
Gross property, plant and equipment 0.76% 6.40%
Accumulated Depreciation 13.89% 24.23%
Net property, plant and equipment -12.17% -6.79%
Goodwill -21.64% 5.59%
Intangible assets 118.63%
-
60.43%
Deferred income taxes
Other long-term assets -13.50% 28.85%
Total non-current assets -11.87% 5.34%
Total assets -2.06% 5.64%
Liabilities and stockholders' equity
Liabilities
Current liabilities
Short-term debt -61.49% 7.69%
Accounts payable
Taxes payable 10.98% 30.10%
Other current liabilities 1.84% -4.86%
Total current liabilities -17.70% -0.32%
Non-current liabilities
Long-term debt 25.11% -1.04%
Deferred taxes liabilities 9.69% 50.52%
Minority interest 15.73% 30.09%
Other long-term liabilities -7.30% -6.26%
Total non-current liabilities 21.07% 2.14%
Total liabilities -3.38% 0.58%
Stockholders' equity
Common stock 0.00% 0.00%
Retained earnings 3.78% 40.35%
Treasury stock 55.29%
Accumulated other comprehensive
income -6.98% 22.21%
Total stockholders' equity 2.18% 26.04%
Total liabilities and stockholders' equity -2.06% 5.64%
ABR HOLDINGS LTD (533) CashFlowFlag INCOME
STATEMENT
Fiscal year ends in December. 2016-12
2015-
12
⊘ This is a preview!⊘
Do you want full access?
Subscribe today to unlock all pages.
Trusted by 1+ million students worldwide
1 out of 25
Related Documents


Your All-in-One AI-Powered Toolkit for Academic Success.
+13062052269
info@desklib.com
Available 24*7 on WhatsApp / Email
![[object Object]](/_next/static/media/star-bottom.7253800d.svg)
Unlock your academic potential
Copyright © 2020–2026 A2Z Services. All Rights Reserved. Developed and managed by ZUCOL.