Report: Financial Analysis and Performance of Retail Clothing Firms
VerifiedAdded on  2020/03/07
|16
|1717
|95
Report
AI Summary
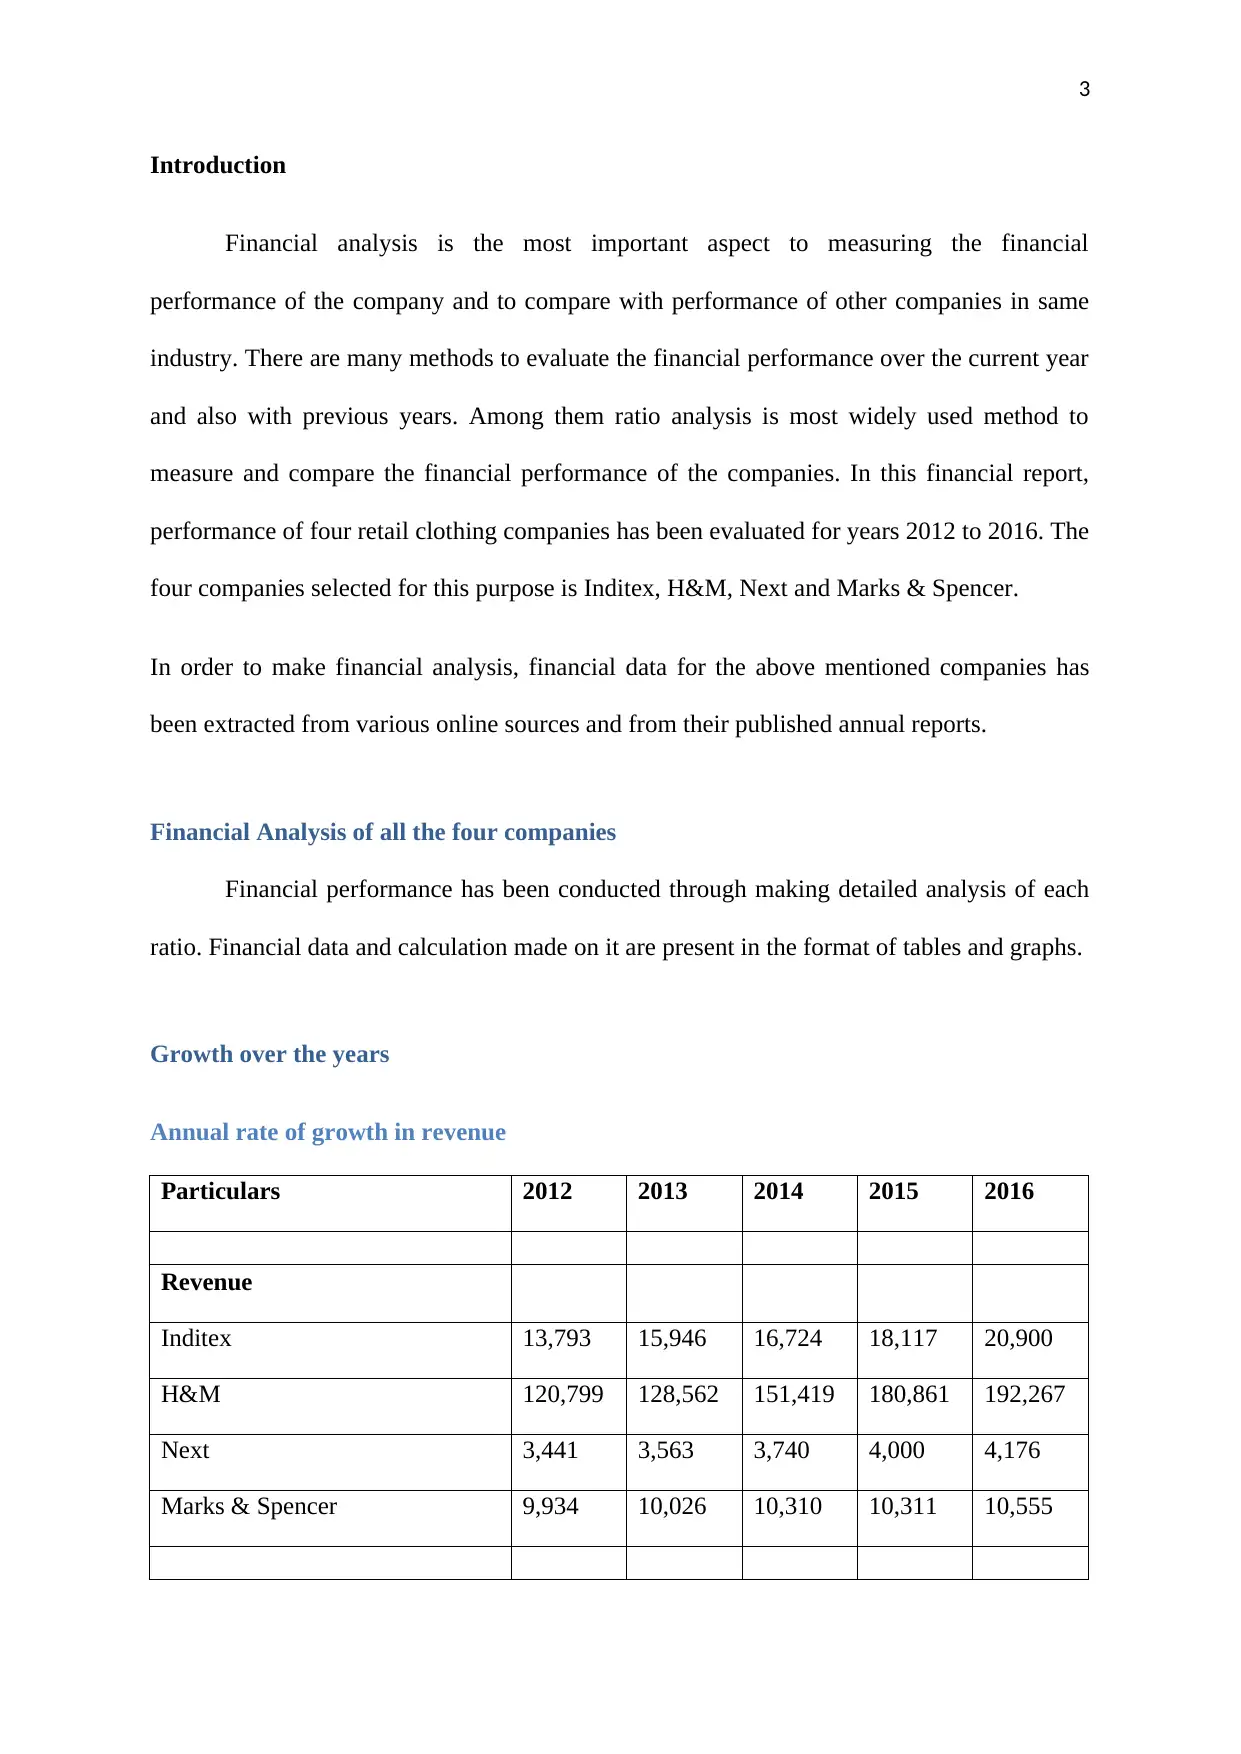
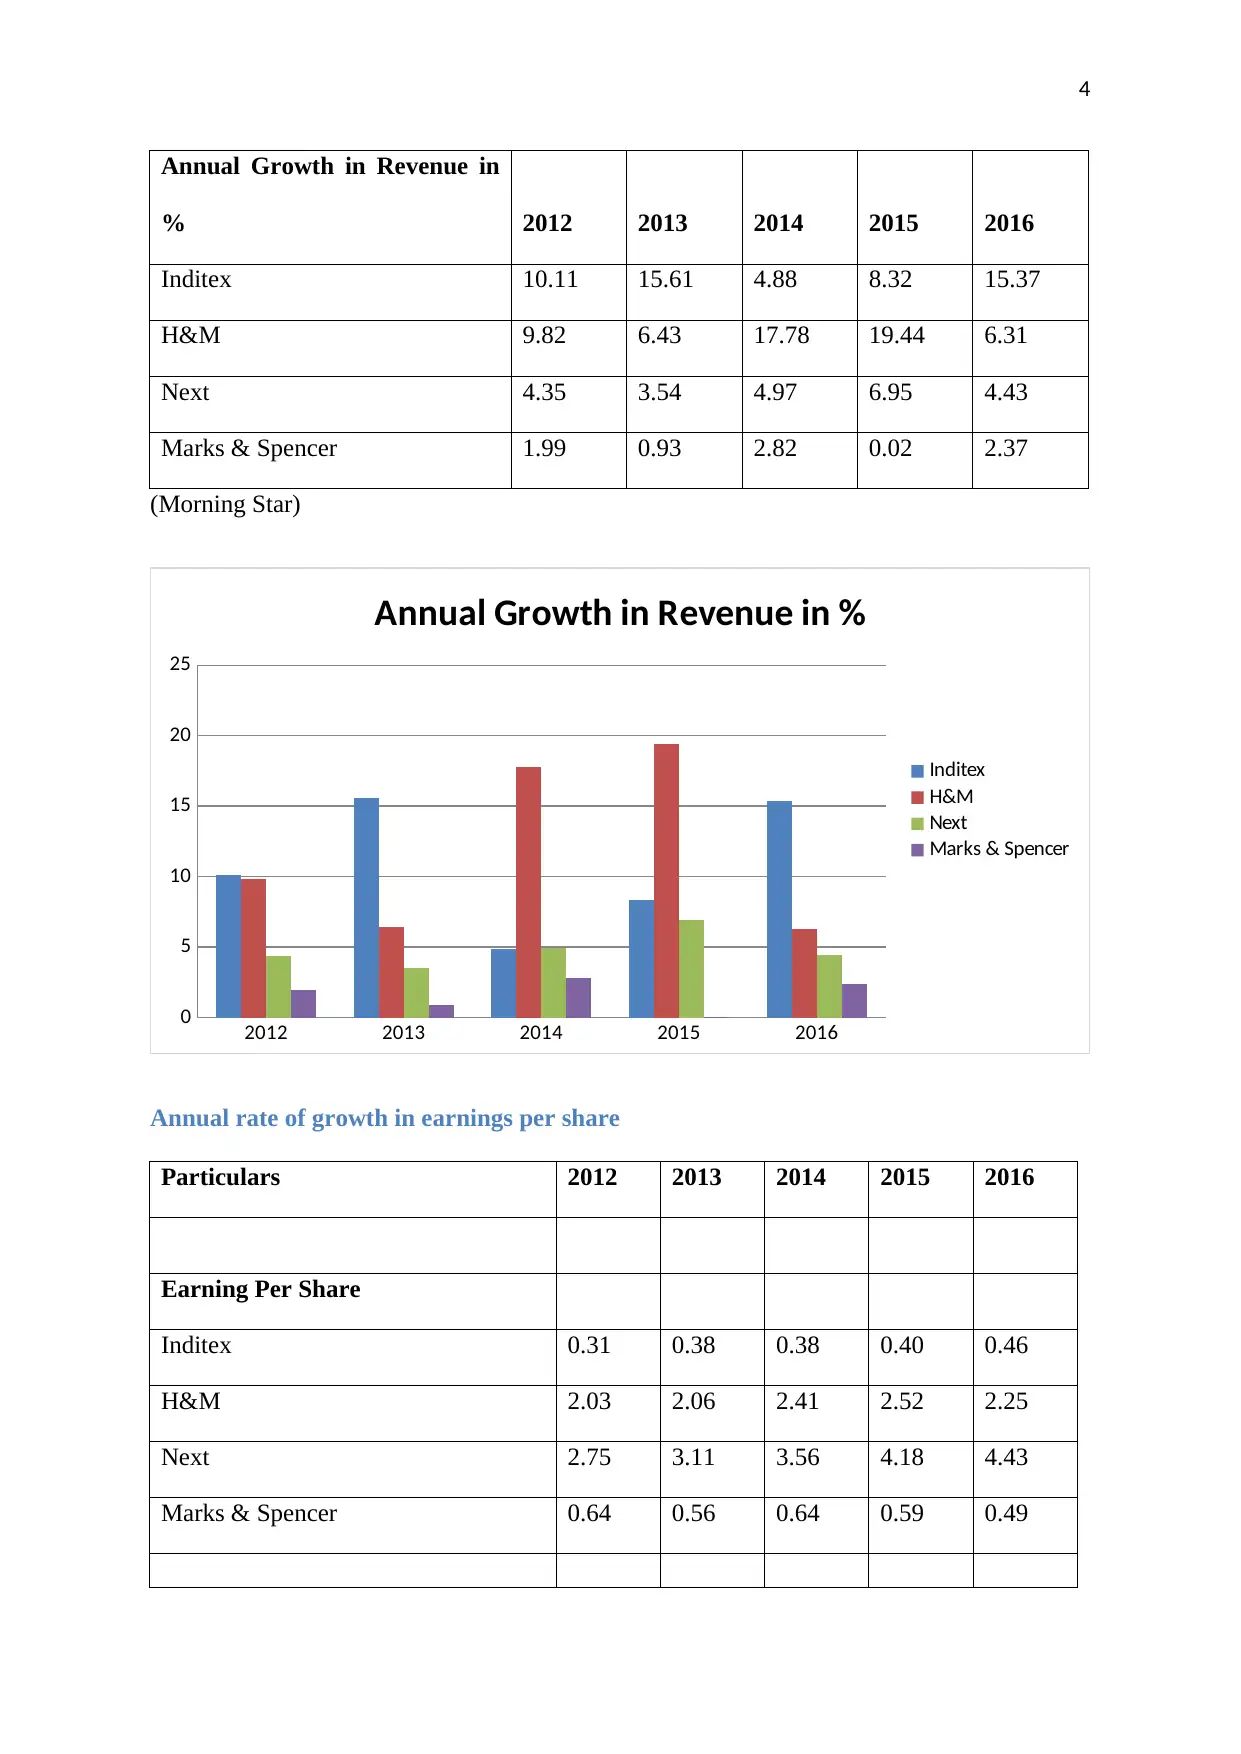
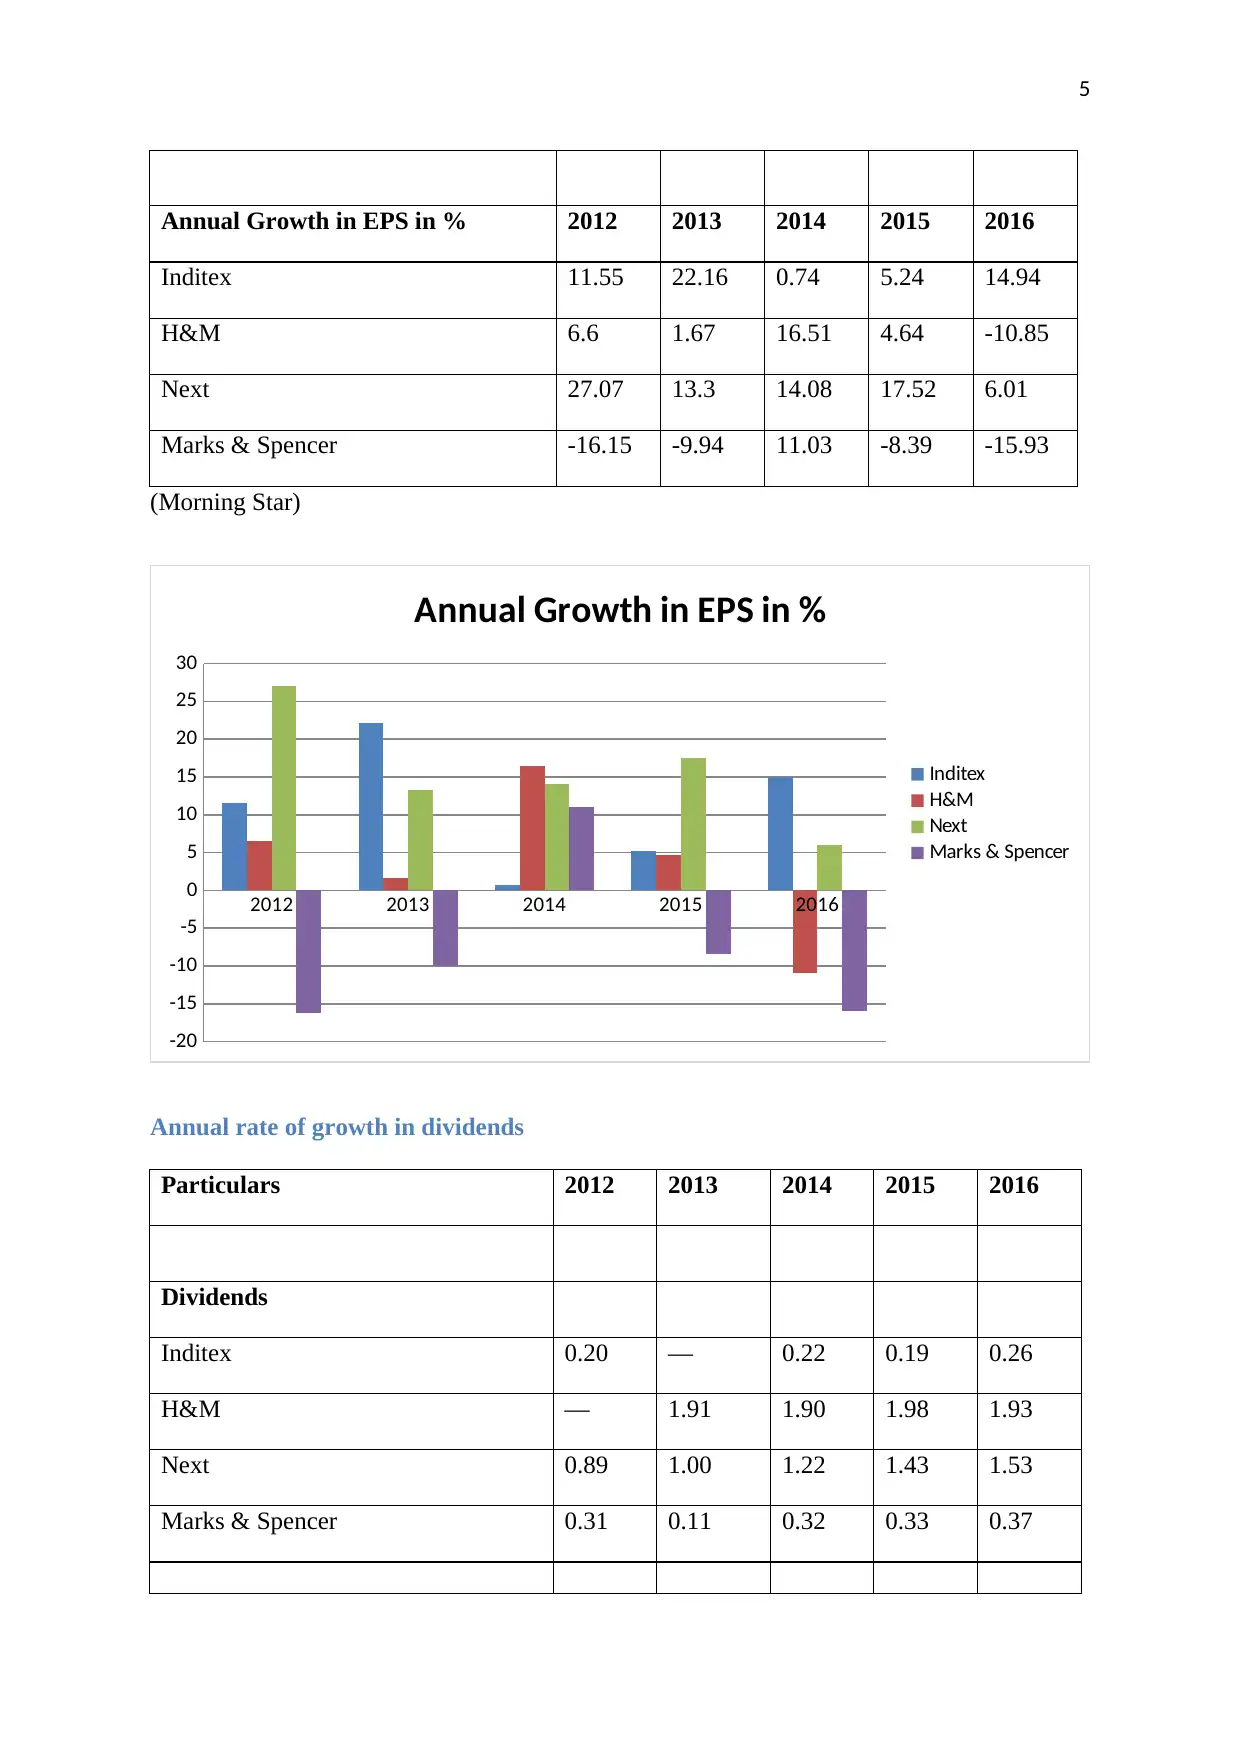
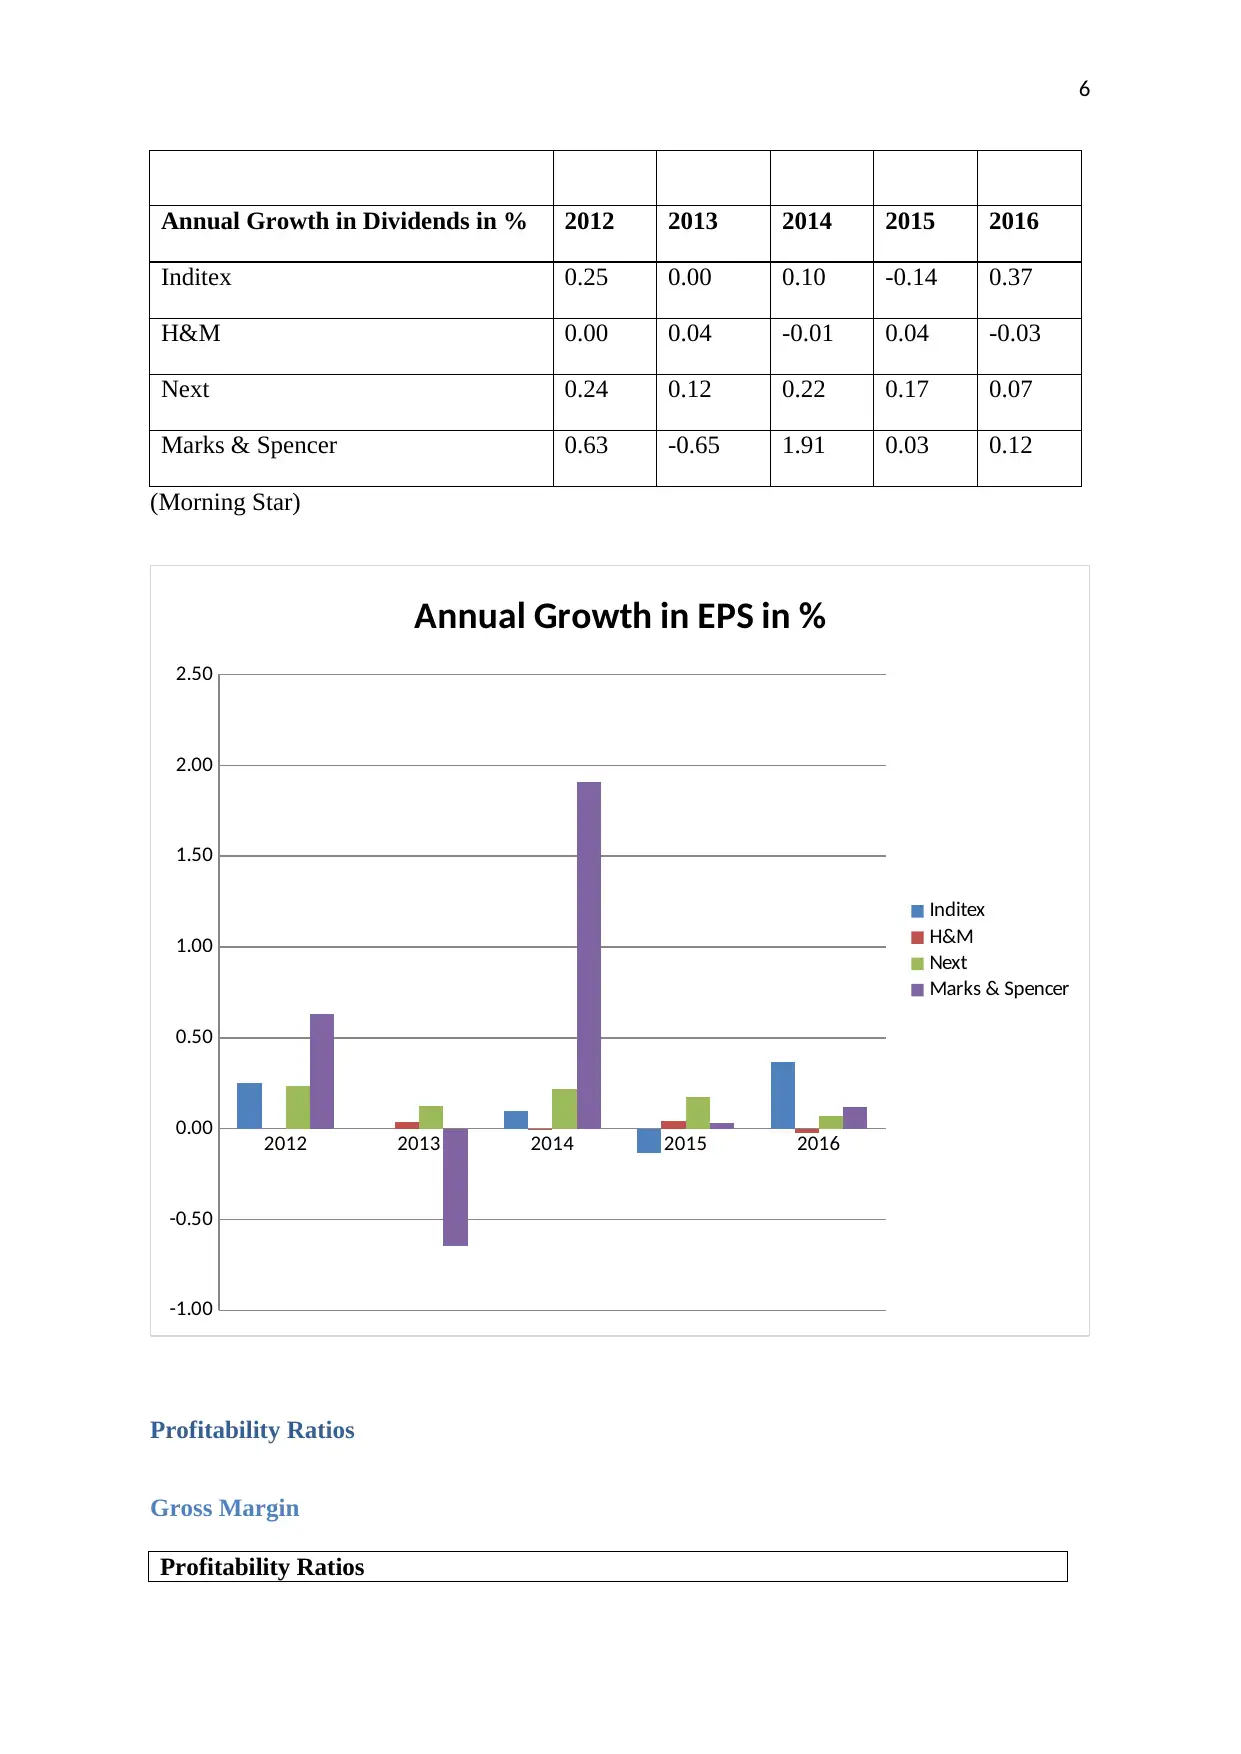
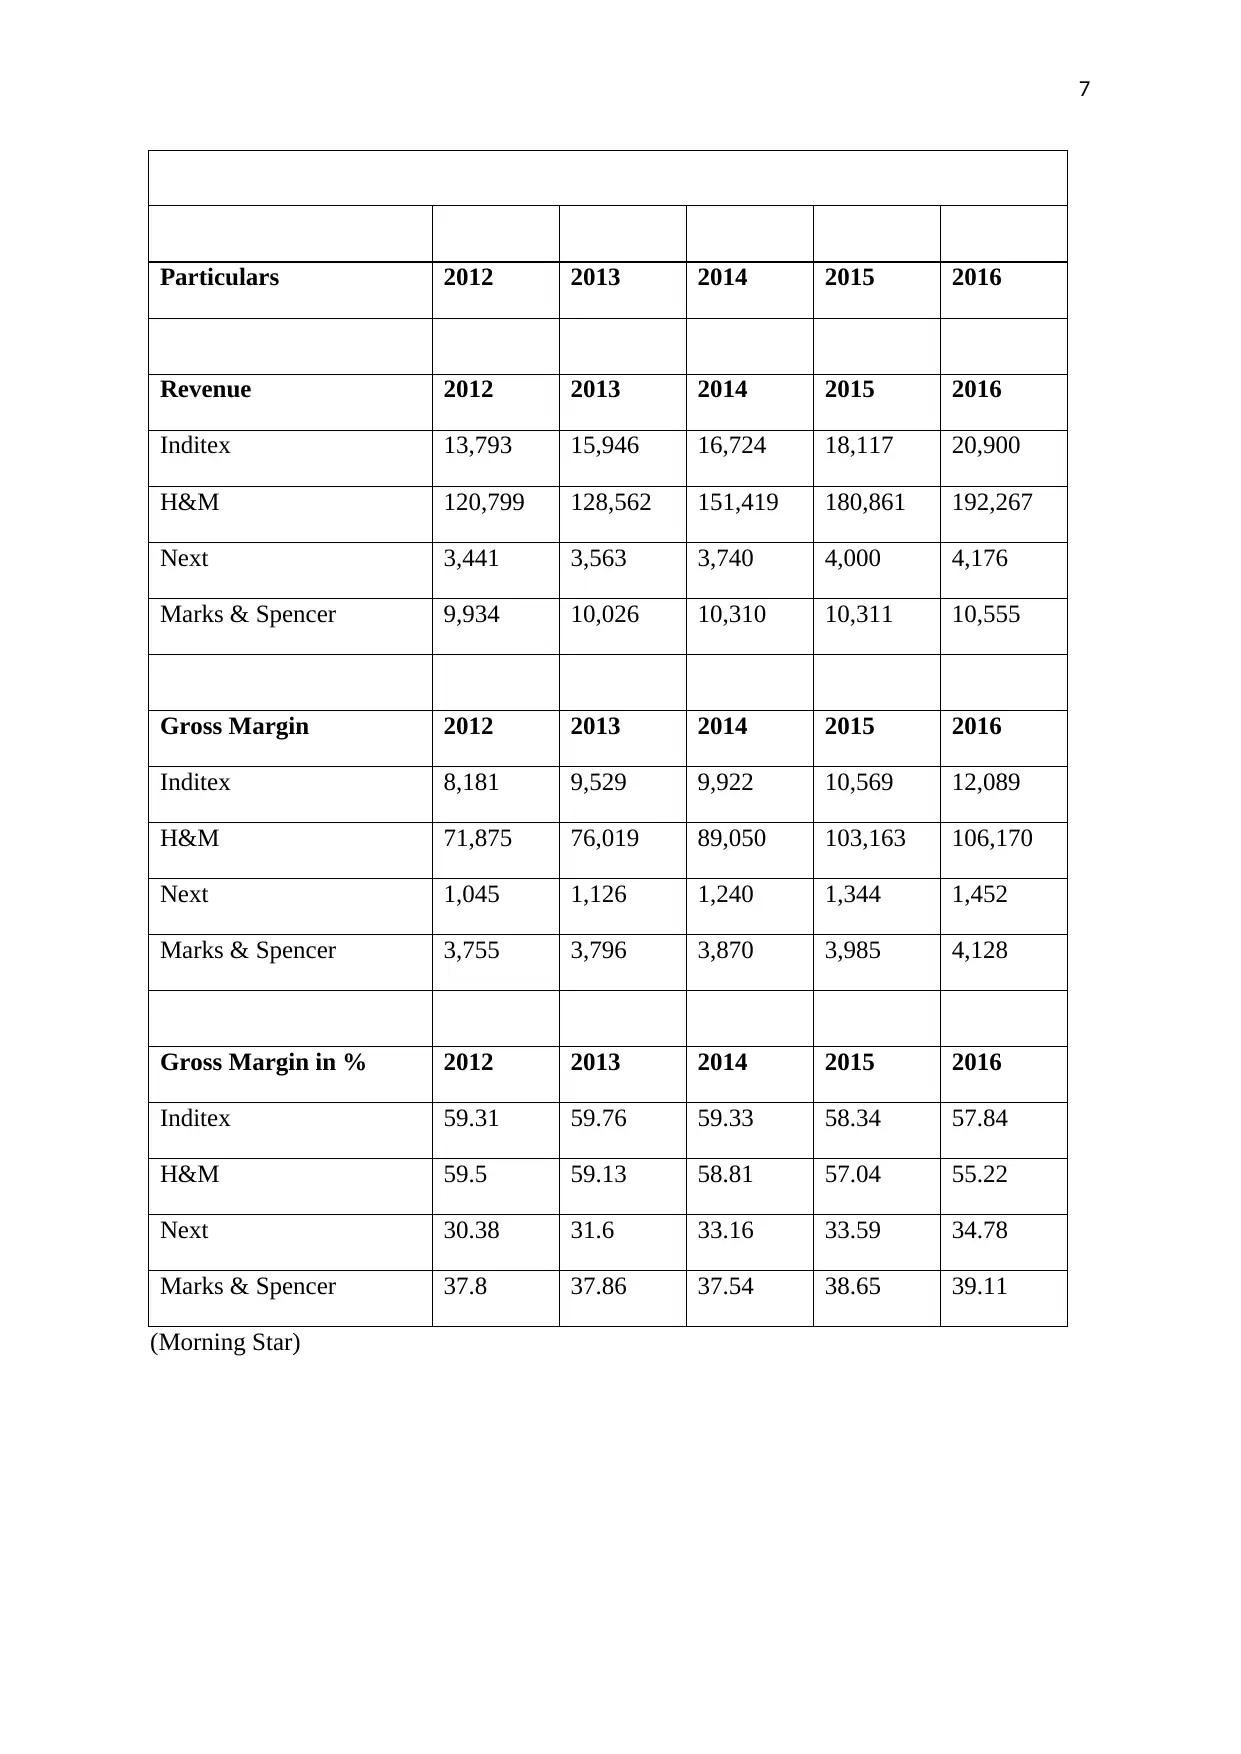
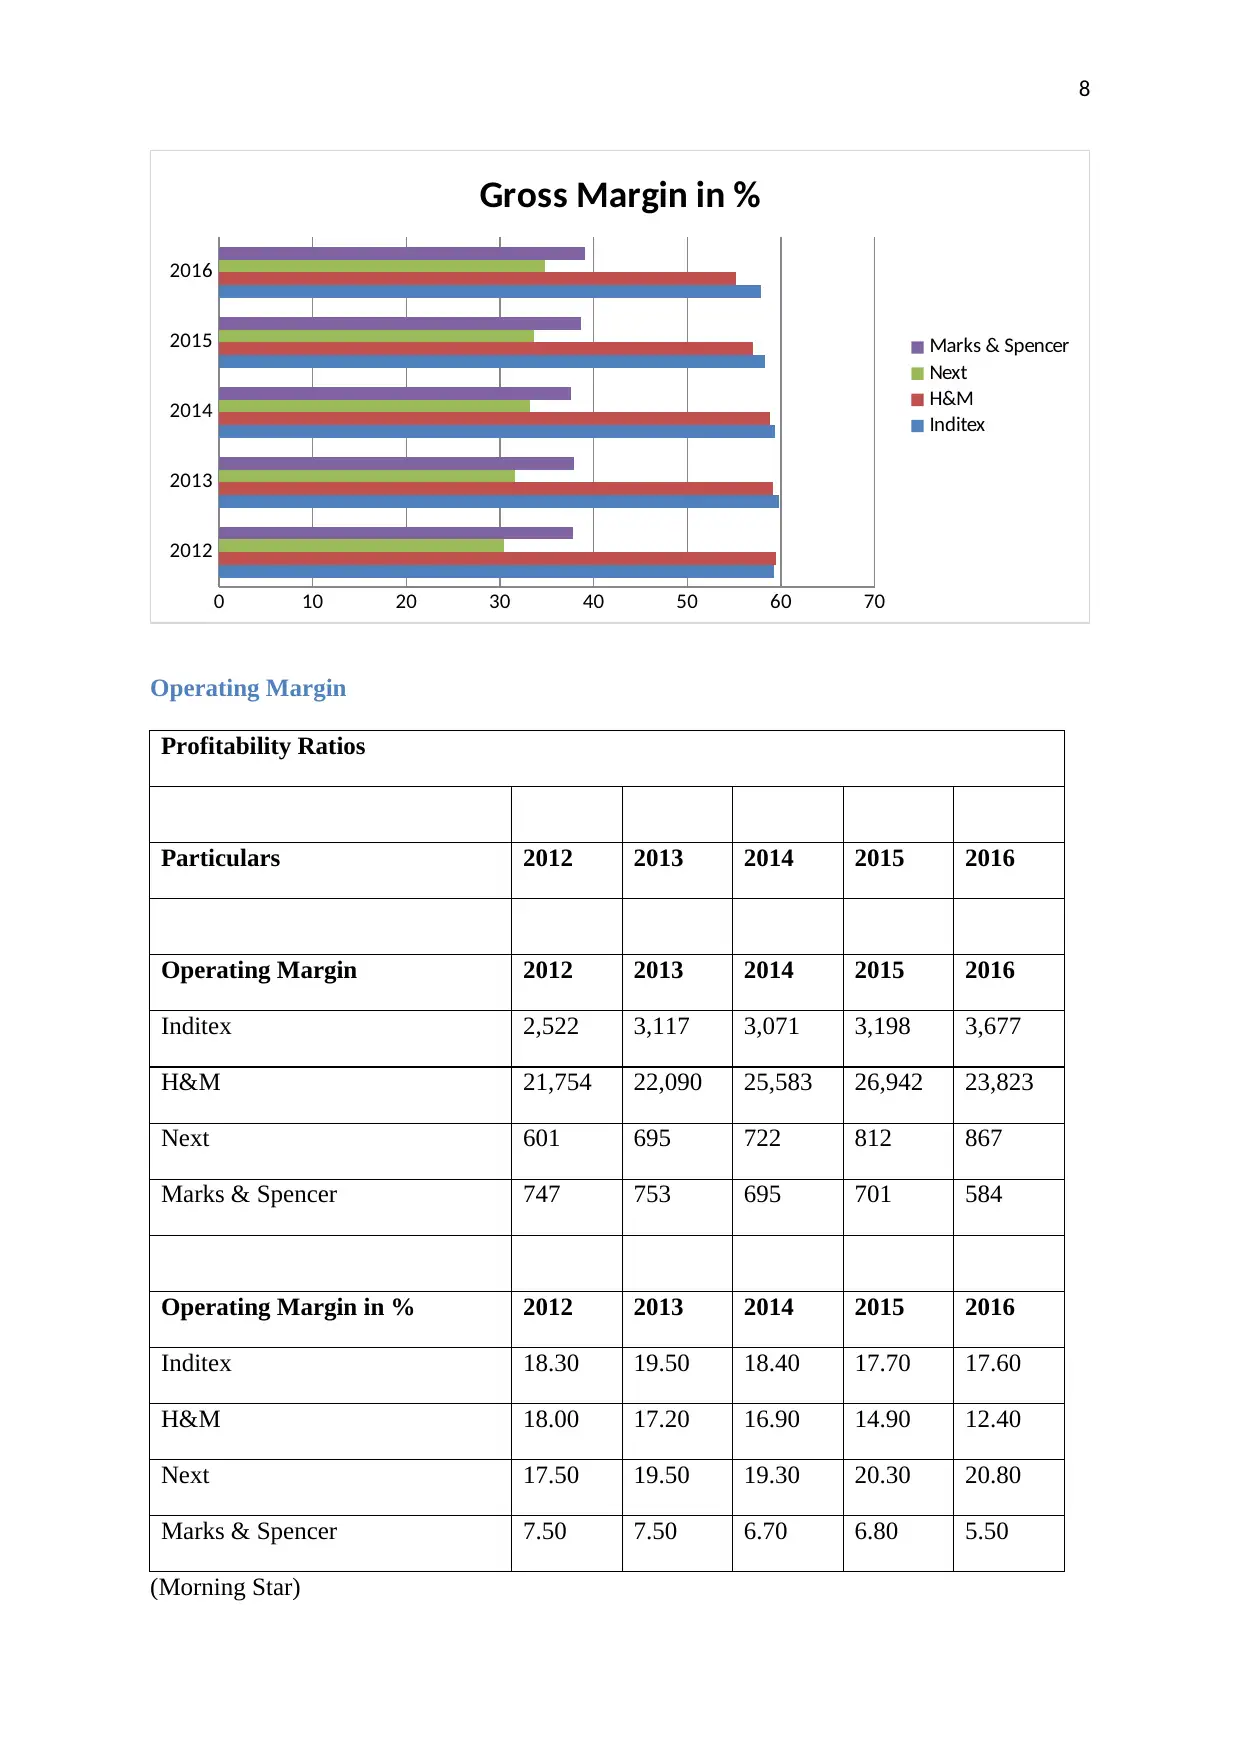
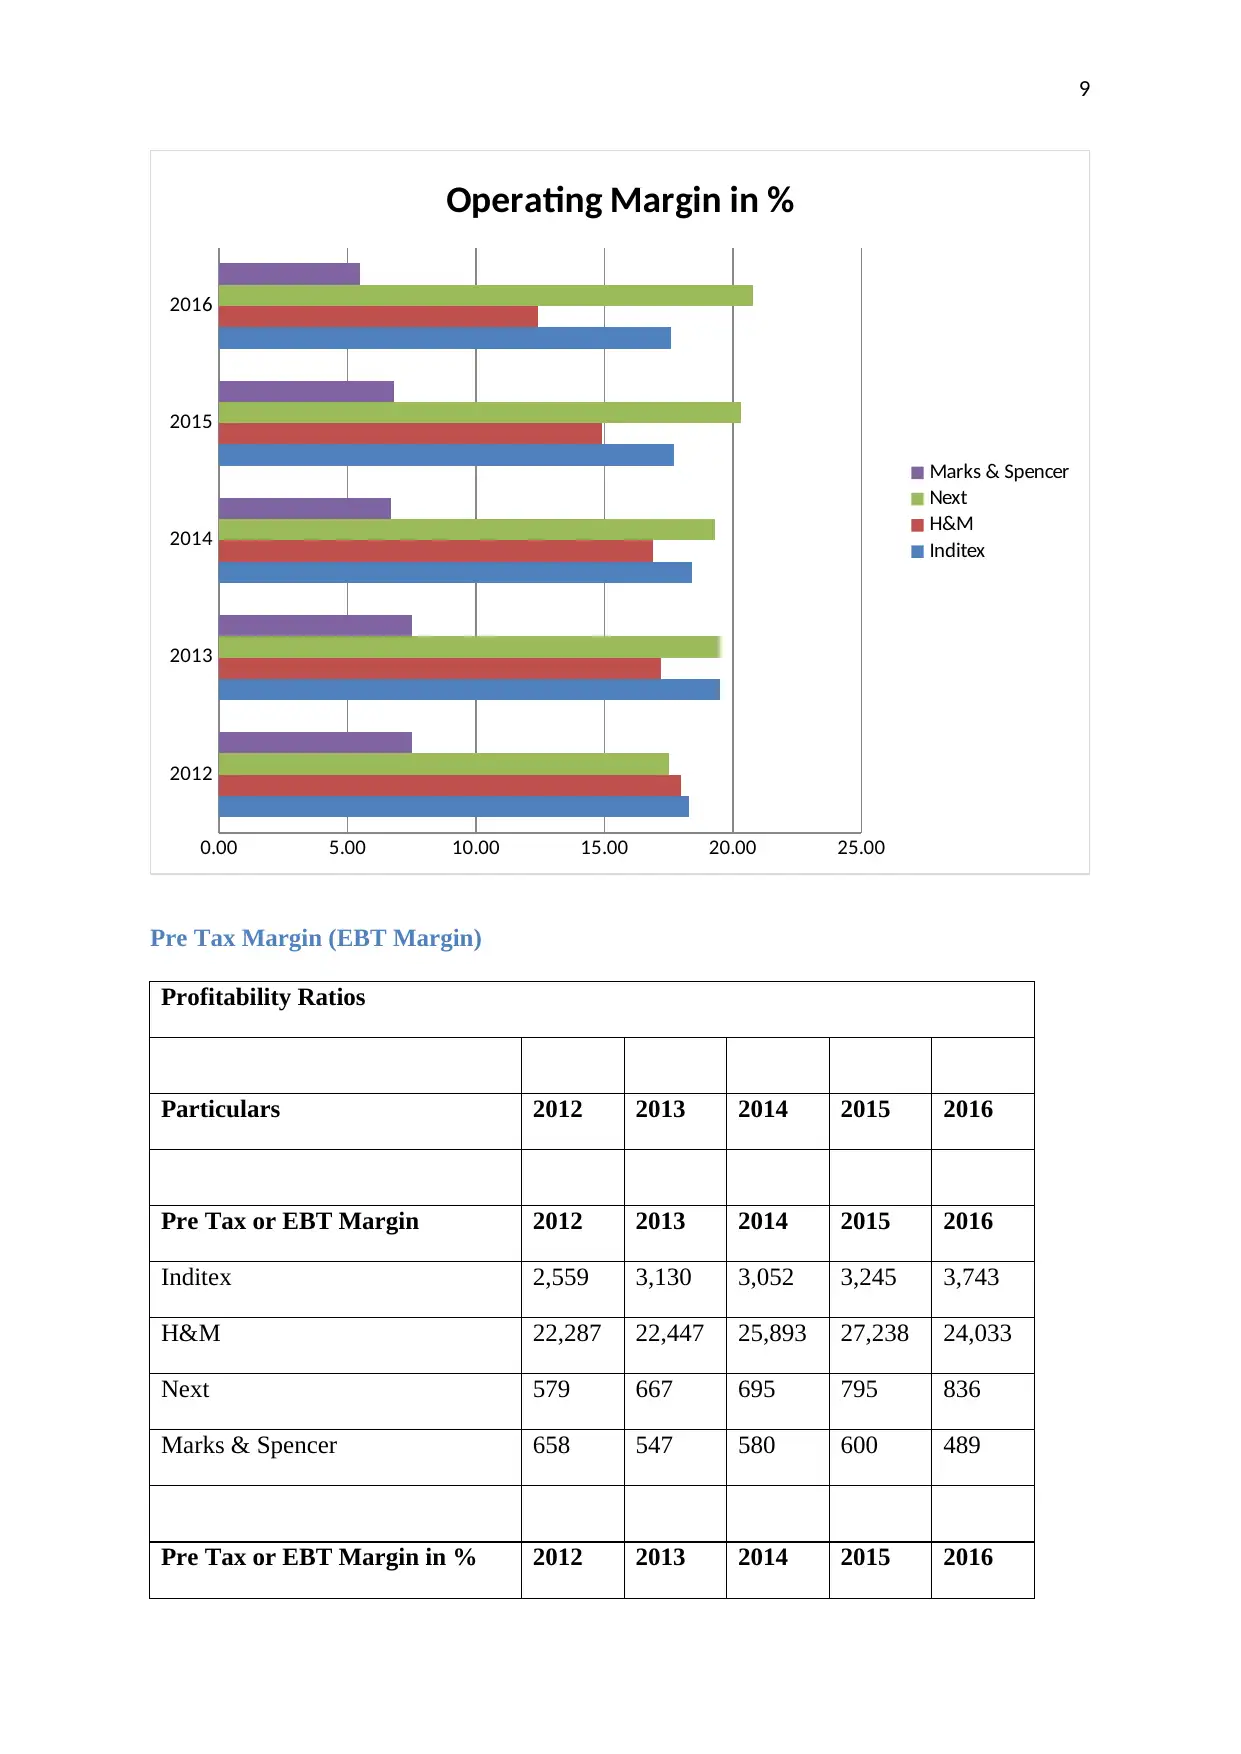
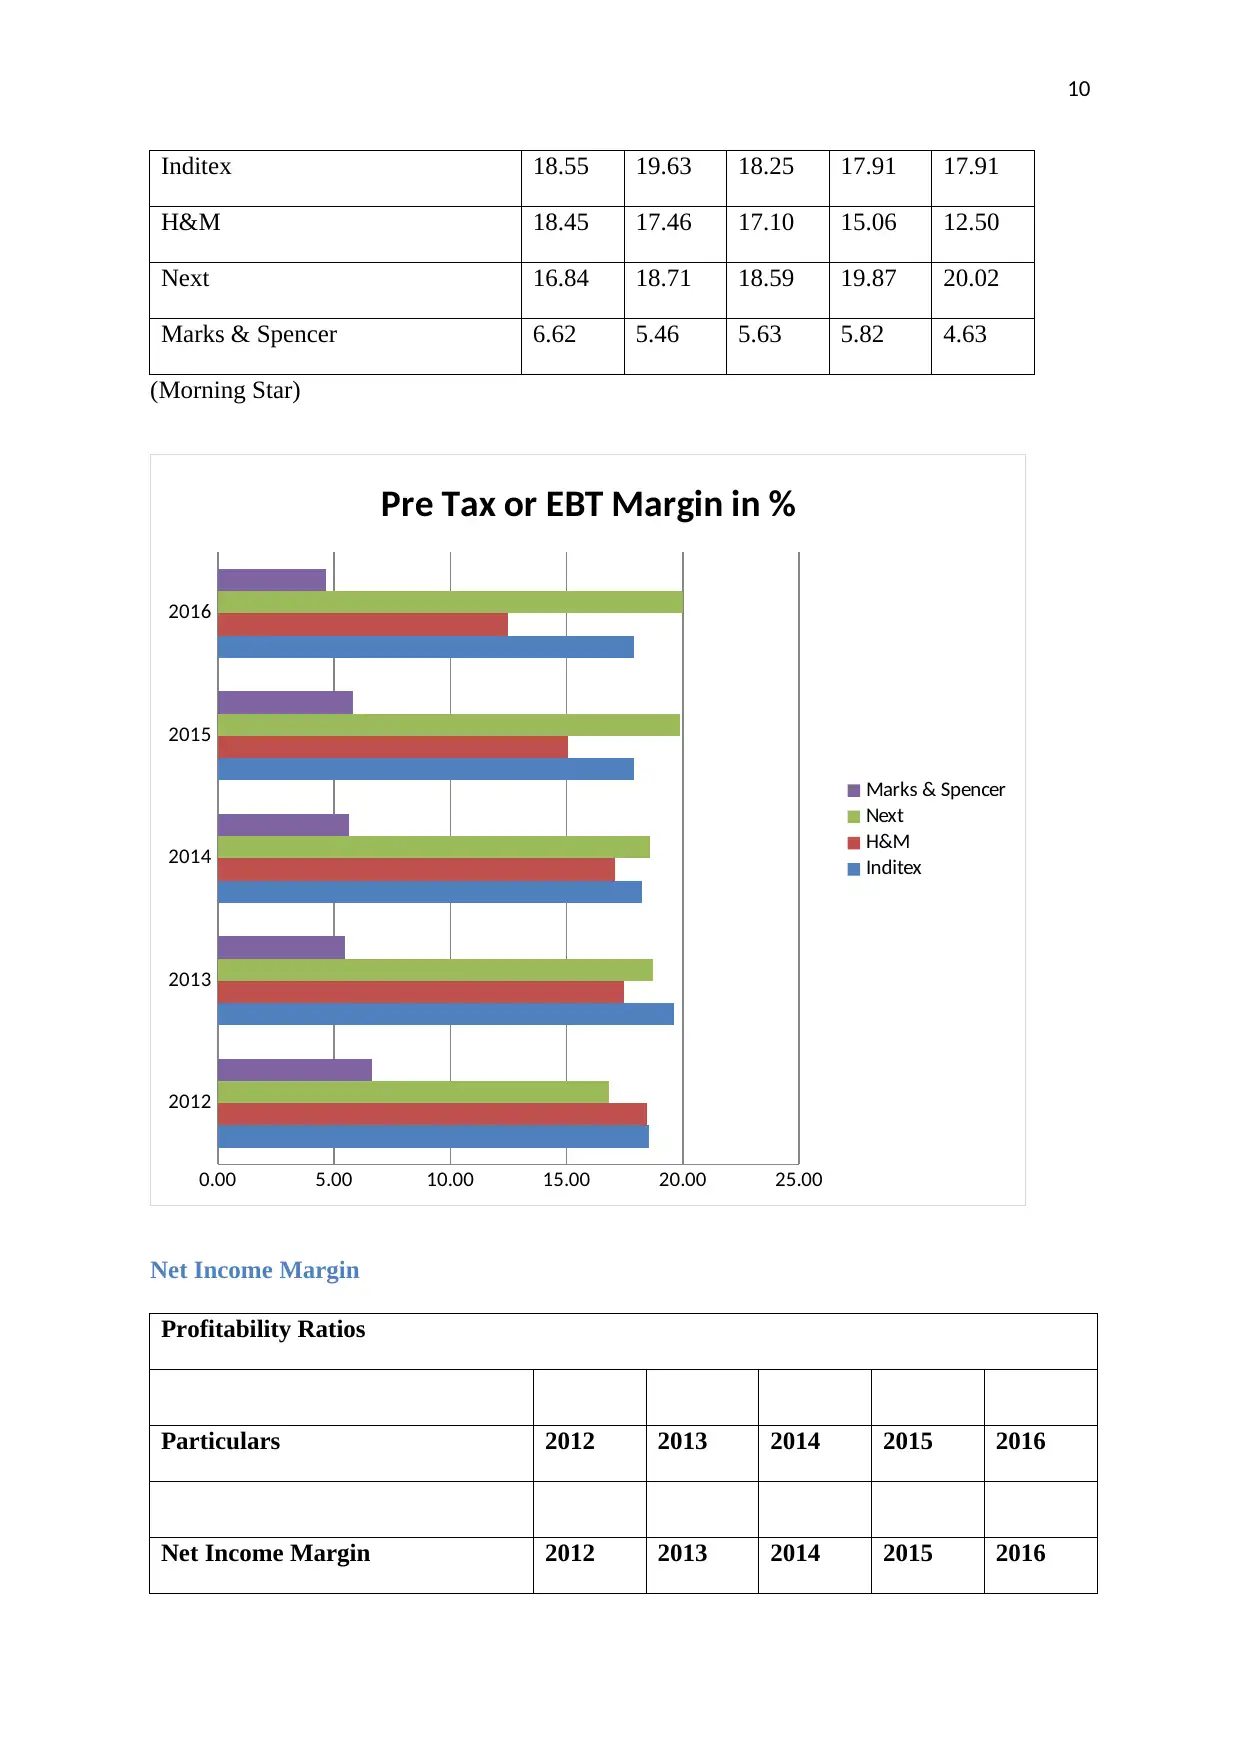
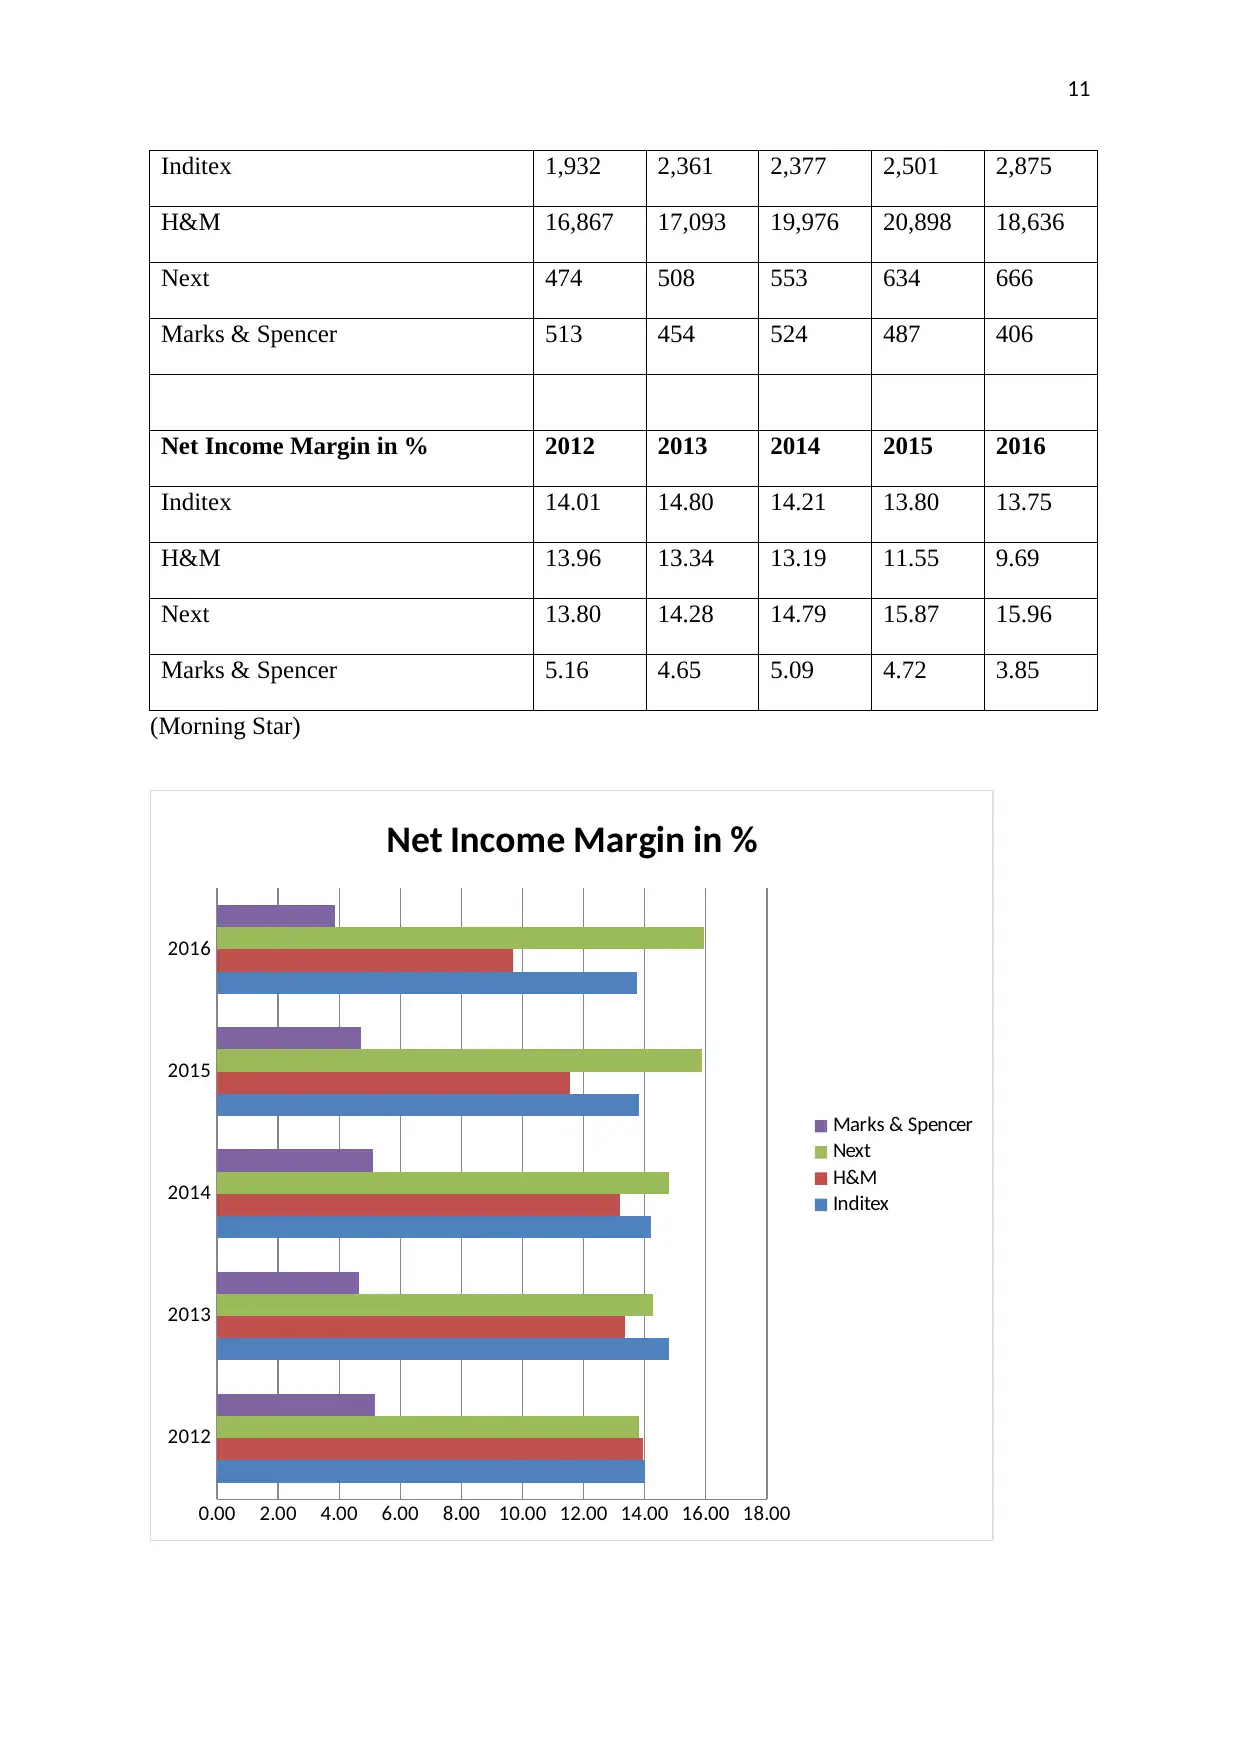
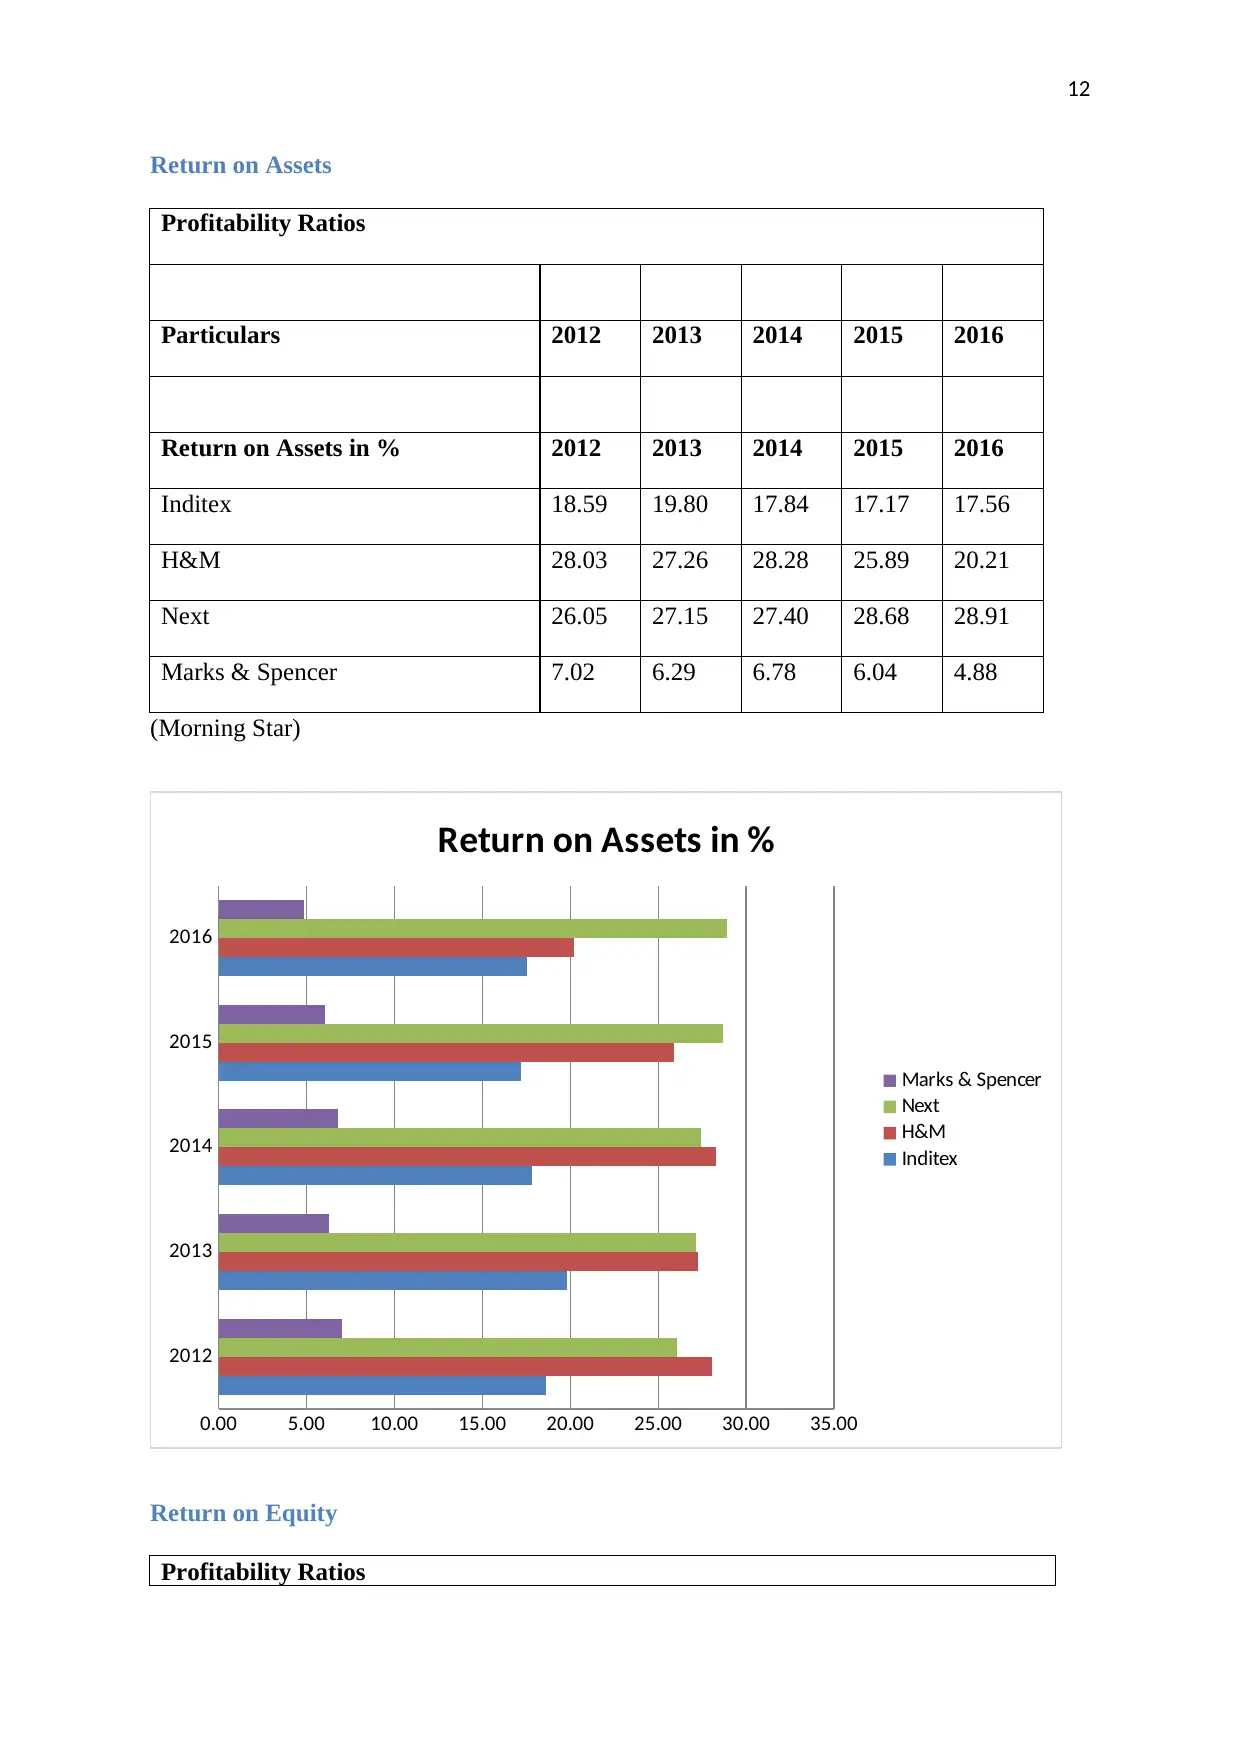
This report presents a detailed financial analysis of four prominent retail clothing companies: Inditex, H&M, Next, and Marks & Spencer, covering the period from 2012 to 2016. The analysis begins with an introduction to financial analysis and its importance in measuring company performance, particularly through ratio analysis. The report examines the companies' growth over the years, including annual growth rates in revenue, earnings per share, and dividends. It then delves into profitability ratios such as gross margin, operating margin, pre-tax margin, net income margin, return on assets, and return on equity. Efficiency ratios and solvency ratios, including financial leverage, are also analyzed. The report concludes with comments on the ratio analysis, highlighting key findings and comparing the performance of the four companies across various financial metrics, and also provides a conclusion and references.

1
Financial Analysis
Financial Analysis
Paraphrase This Document
Need a fresh take? Get an instant paraphrase of this document with our AI Paraphraser

2
Contents
Introduction................................................................................................................................3
Financial Analysis of all the four companies.............................................................................3
Growth over the years................................................................................................................3
Annual rate of growth in revenue...........................................................................................3
Annual rate of growth in earnings per share..........................................................................4
Annual rate of growth in dividends........................................................................................5
Profitability Ratios.....................................................................................................................6
Gross Margin..........................................................................................................................6
Operating Margin...................................................................................................................8
Pre Tax Margin (EBT Margin)...............................................................................................9
Net Income Margin...............................................................................................................10
Return on Assets...................................................................................................................12
Return on Equity...................................................................................................................13
Efficiency Ratios......................................................................................................................14
Solvency Ratio.........................................................................................................................15
Financial leverage Ratio.......................................................................................................15
Comments on the Ratio Analysis.............................................................................................16
Conclusion................................................................................................................................17
References................................................................................................................................18

3
Introduction
Financial analysis is the most important aspect to measuring the financial
performance of the company and to compare with performance of other companies in same
industry. There are many methods to evaluate the financial performance over the current year
and also with previous years. Among them ratio analysis is most widely used method to
measure and compare the financial performance of the companies. In this financial report,
performance of four retail clothing companies has been evaluated for years 2012 to 2016. The
four companies selected for this purpose is Inditex, H&M, Next and Marks & Spencer.
In order to make financial analysis, financial data for the above mentioned companies has
been extracted from various online sources and from their published annual reports.
Financial Analysis of all the four companies
Financial performance has been conducted through making detailed analysis of each
ratio. Financial data and calculation made on it are present in the format of tables and graphs.
Growth over the years
Annual rate of growth in revenue
Particulars 2012 2013 2014 2015 2016
Revenue
Inditex 13,793 15,946 16,724 18,117 20,900
H&M 120,799 128,562 151,419 180,861 192,267
Next 3,441 3,563 3,740 4,000 4,176
Marks & Spencer 9,934 10,026 10,310 10,311 10,555
⊘ This is a preview!⊘
Do you want full access?
Subscribe today to unlock all pages.

Trusted by 1+ million students worldwide

4
Annual Growth in Revenue in
% 2012 2013 2014 2015 2016
Inditex 10.11 15.61 4.88 8.32 15.37
H&M 9.82 6.43 17.78 19.44 6.31
Next 4.35 3.54 4.97 6.95 4.43
Marks & Spencer 1.99 0.93 2.82 0.02 2.37
(Morning Star)
2012 2013 2014 2015 2016
0
5
10
15
20
25
Annual Growth in Revenue in %
Inditex
H&M
Next
Marks & Spencer
Annual rate of growth in earnings per share
Particulars 2012 2013 2014 2015 2016
Earning Per Share
Inditex 0.31 0.38 0.38 0.40 0.46
H&M 2.03 2.06 2.41 2.52 2.25
Next 2.75 3.11 3.56 4.18 4.43
Marks & Spencer 0.64 0.56 0.64 0.59 0.49
Paraphrase This Document
Need a fresh take? Get an instant paraphrase of this document with our AI Paraphraser

5
Annual Growth in EPS in % 2012 2013 2014 2015 2016
Inditex 11.55 22.16 0.74 5.24 14.94
H&M 6.6 1.67 16.51 4.64 -10.85
Next 27.07 13.3 14.08 17.52 6.01
Marks & Spencer -16.15 -9.94 11.03 -8.39 -15.93
(Morning Star)
2012 2013 2014 2015 2016
-20
-15
-10
-5
0
5
10
15
20
25
30
Annual Growth in EPS in %
Inditex
H&M
Next
Marks & Spencer
Annual rate of growth in dividends
Particulars 2012 2013 2014 2015 2016
Dividends
Inditex 0.20 — 0.22 0.19 0.26
H&M — 1.91 1.90 1.98 1.93
Next 0.89 1.00 1.22 1.43 1.53
Marks & Spencer 0.31 0.11 0.32 0.33 0.37

6
Annual Growth in Dividends in % 2012 2013 2014 2015 2016
Inditex 0.25 0.00 0.10 -0.14 0.37
H&M 0.00 0.04 -0.01 0.04 -0.03
Next 0.24 0.12 0.22 0.17 0.07
Marks & Spencer 0.63 -0.65 1.91 0.03 0.12
(Morning Star)
2012 2013 2014 2015 2016
-1.00
-0.50
0.00
0.50
1.00
1.50
2.00
2.50
Annual Growth in EPS in %
Inditex
H&M
Next
Marks & Spencer
Profitability Ratios
Gross Margin
Profitability Ratios
⊘ This is a preview!⊘
Do you want full access?
Subscribe today to unlock all pages.

Trusted by 1+ million students worldwide

7
Particulars 2012 2013 2014 2015 2016
Revenue 2012 2013 2014 2015 2016
Inditex 13,793 15,946 16,724 18,117 20,900
H&M 120,799 128,562 151,419 180,861 192,267
Next 3,441 3,563 3,740 4,000 4,176
Marks & Spencer 9,934 10,026 10,310 10,311 10,555
Gross Margin 2012 2013 2014 2015 2016
Inditex 8,181 9,529 9,922 10,569 12,089
H&M 71,875 76,019 89,050 103,163 106,170
Next 1,045 1,126 1,240 1,344 1,452
Marks & Spencer 3,755 3,796 3,870 3,985 4,128
Gross Margin in % 2012 2013 2014 2015 2016
Inditex 59.31 59.76 59.33 58.34 57.84
H&M 59.5 59.13 58.81 57.04 55.22
Next 30.38 31.6 33.16 33.59 34.78
Marks & Spencer 37.8 37.86 37.54 38.65 39.11
(Morning Star)
Paraphrase This Document
Need a fresh take? Get an instant paraphrase of this document with our AI Paraphraser

8
2012
2013
2014
2015
2016
0 10 20 30 40 50 60 70
Gross Margin in %
Marks & Spencer
Next
H&M
Inditex
Operating Margin
Profitability Ratios
Particulars 2012 2013 2014 2015 2016
Operating Margin 2012 2013 2014 2015 2016
Inditex 2,522 3,117 3,071 3,198 3,677
H&M 21,754 22,090 25,583 26,942 23,823
Next 601 695 722 812 867
Marks & Spencer 747 753 695 701 584
Operating Margin in % 2012 2013 2014 2015 2016
Inditex 18.30 19.50 18.40 17.70 17.60
H&M 18.00 17.20 16.90 14.90 12.40
Next 17.50 19.50 19.30 20.30 20.80
Marks & Spencer 7.50 7.50 6.70 6.80 5.50
(Morning Star)

9
2012
2013
2014
2015
2016
0.00 5.00 10.00 15.00 20.00 25.00
Operating Margin in %
Marks & Spencer
Next
H&M
Inditex
Pre Tax Margin (EBT Margin)
Profitability Ratios
Particulars 2012 2013 2014 2015 2016
Pre Tax or EBT Margin 2012 2013 2014 2015 2016
Inditex 2,559 3,130 3,052 3,245 3,743
H&M 22,287 22,447 25,893 27,238 24,033
Next 579 667 695 795 836
Marks & Spencer 658 547 580 600 489
Pre Tax or EBT Margin in % 2012 2013 2014 2015 2016
⊘ This is a preview!⊘
Do you want full access?
Subscribe today to unlock all pages.

Trusted by 1+ million students worldwide

10
Inditex 18.55 19.63 18.25 17.91 17.91
H&M 18.45 17.46 17.10 15.06 12.50
Next 16.84 18.71 18.59 19.87 20.02
Marks & Spencer 6.62 5.46 5.63 5.82 4.63
(Morning Star)
2012
2013
2014
2015
2016
0.00 5.00 10.00 15.00 20.00 25.00
Pre Tax or EBT Margin in %
Marks & Spencer
Next
H&M
Inditex
Net Income Margin
Profitability Ratios
Particulars 2012 2013 2014 2015 2016
Net Income Margin 2012 2013 2014 2015 2016
Paraphrase This Document
Need a fresh take? Get an instant paraphrase of this document with our AI Paraphraser

11
Inditex 1,932 2,361 2,377 2,501 2,875
H&M 16,867 17,093 19,976 20,898 18,636
Next 474 508 553 634 666
Marks & Spencer 513 454 524 487 406
Net Income Margin in % 2012 2013 2014 2015 2016
Inditex 14.01 14.80 14.21 13.80 13.75
H&M 13.96 13.34 13.19 11.55 9.69
Next 13.80 14.28 14.79 15.87 15.96
Marks & Spencer 5.16 4.65 5.09 4.72 3.85
(Morning Star)
2012
2013
2014
2015
2016
0.00 2.00 4.00 6.00 8.00 10.00 12.00 14.00 16.00 18.00
Net Income Margin in %
Marks & Spencer
Next
H&M
Inditex

12
Return on Assets
Profitability Ratios
Particulars 2012 2013 2014 2015 2016
Return on Assets in % 2012 2013 2014 2015 2016
Inditex 18.59 19.80 17.84 17.17 17.56
H&M 28.03 27.26 28.28 25.89 20.21
Next 26.05 27.15 27.40 28.68 28.91
Marks & Spencer 7.02 6.29 6.78 6.04 4.88
(Morning Star)
2012
2013
2014
2015
2016
0.00 5.00 10.00 15.00 20.00 25.00 30.00 35.00
Return on Assets in %
Marks & Spencer
Next
H&M
Inditex
Return on Equity
Profitability Ratios
⊘ This is a preview!⊘
Do you want full access?
Subscribe today to unlock all pages.

Trusted by 1+ million students worldwide
1 out of 16

Your All-in-One AI-Powered Toolkit for Academic Success.
 +13062052269
info@desklib.com
Available 24*7 on WhatsApp / Email
Unlock your academic potential
Copyright © 2020–2025 A2Z Services. All Rights Reserved. Developed and managed by ZUCOL.