Managerial Finance Report: Marks & Spencer vs Next Plc Analysis
VerifiedAdded on 2022/12/02
|21
|3903
|192
Report
AI Summary
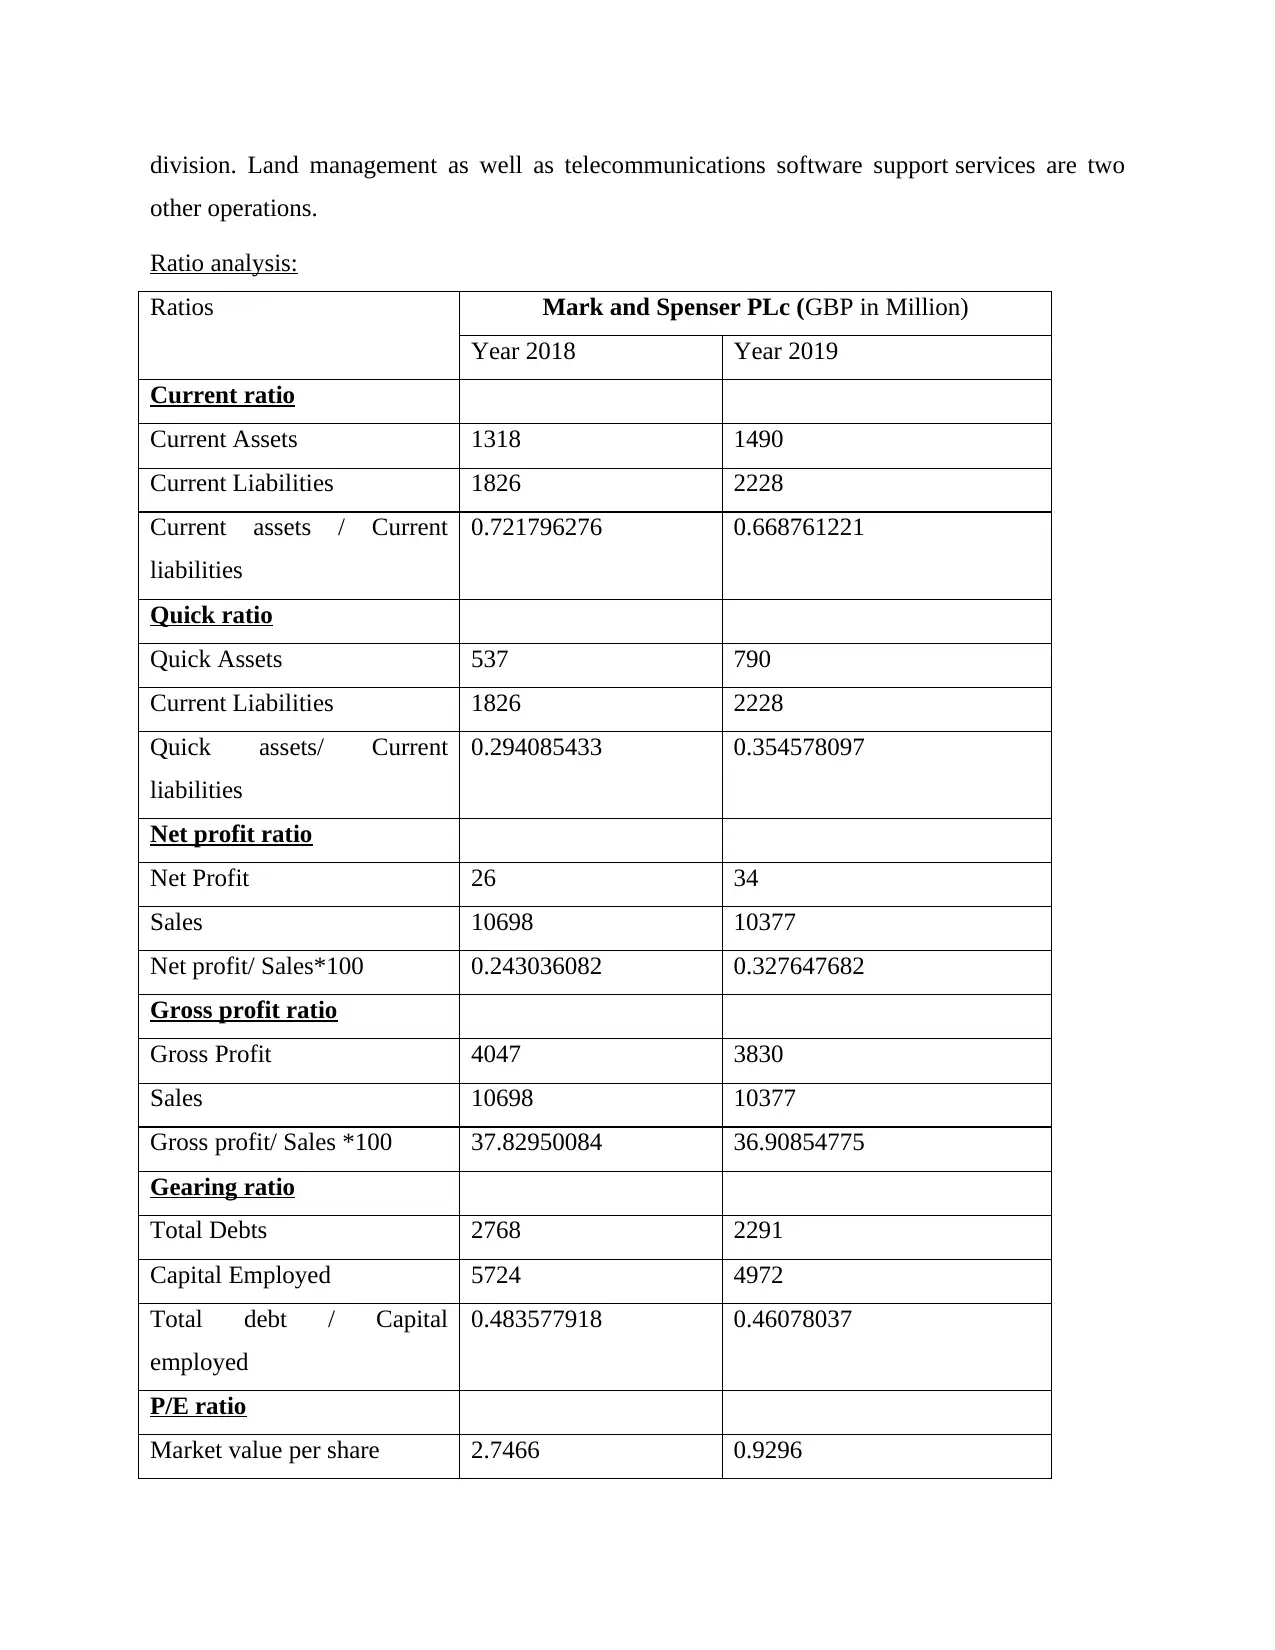
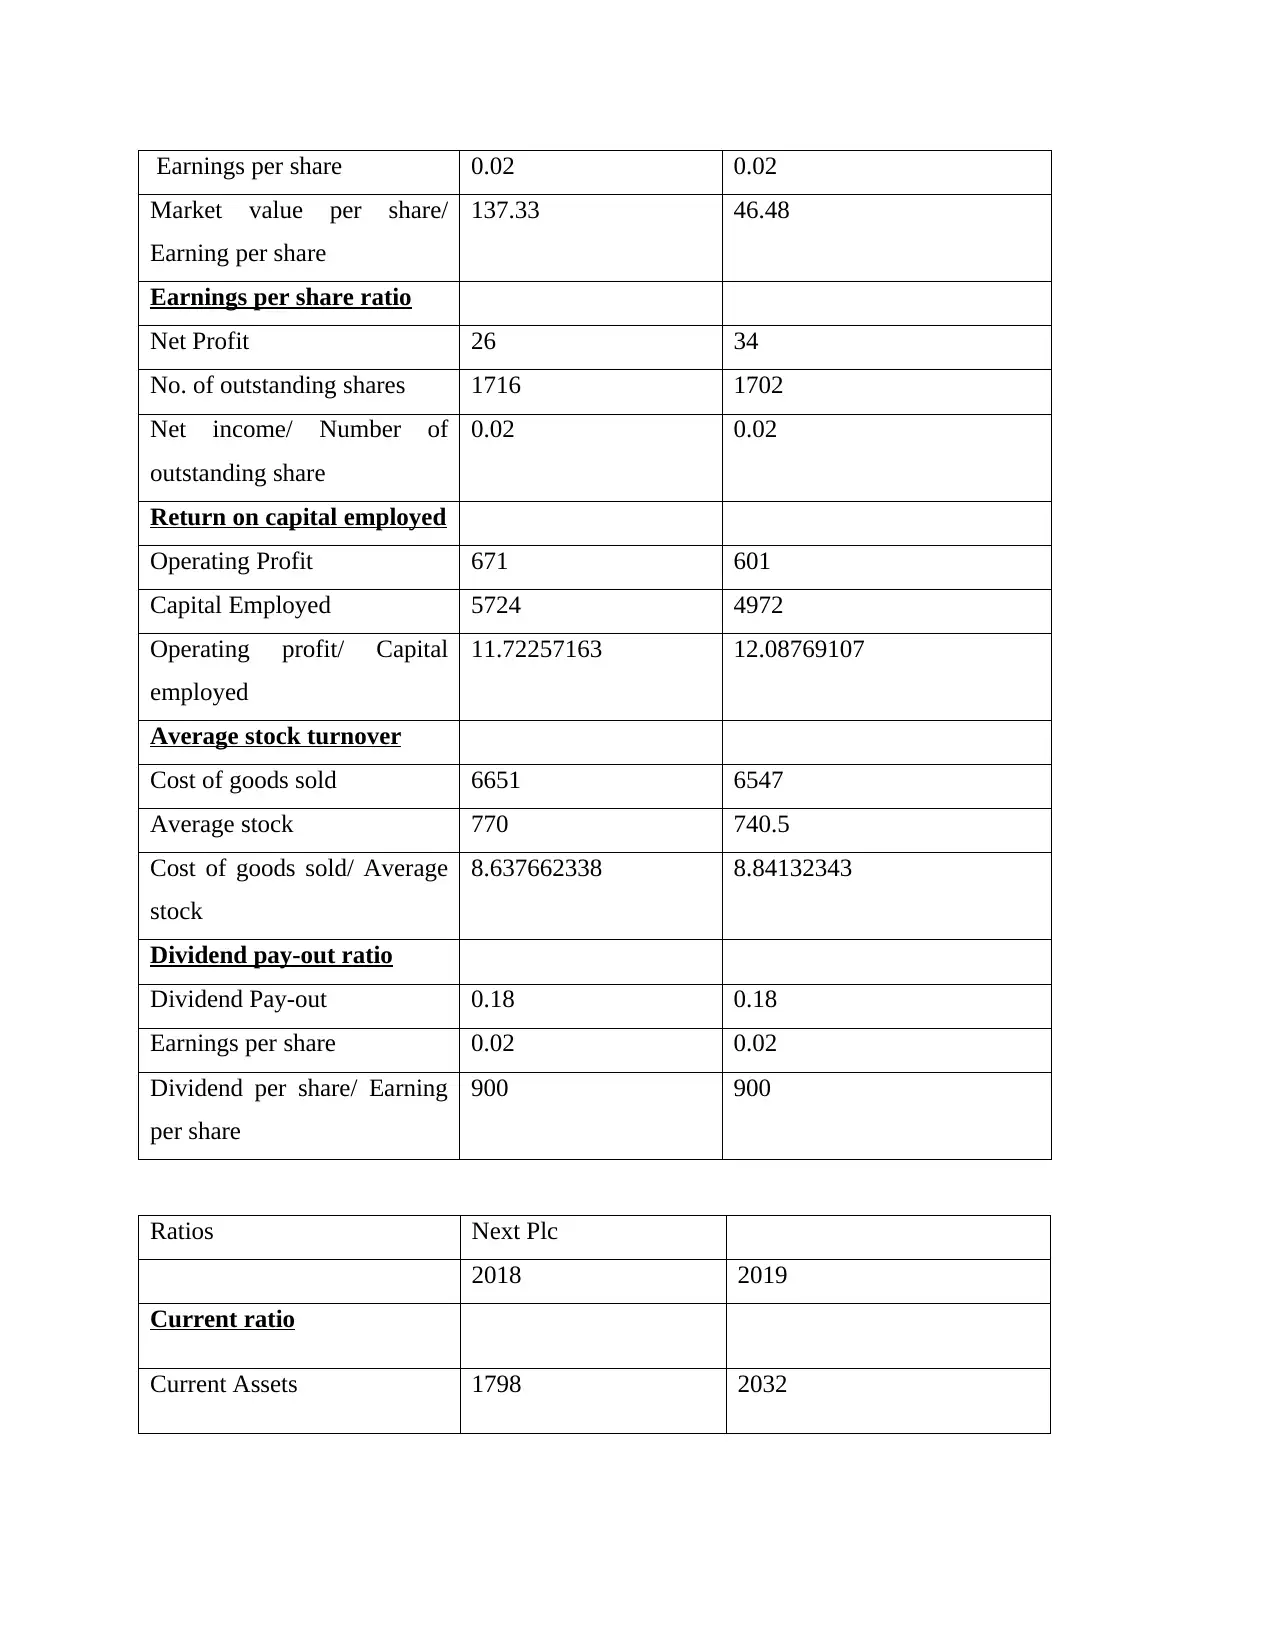
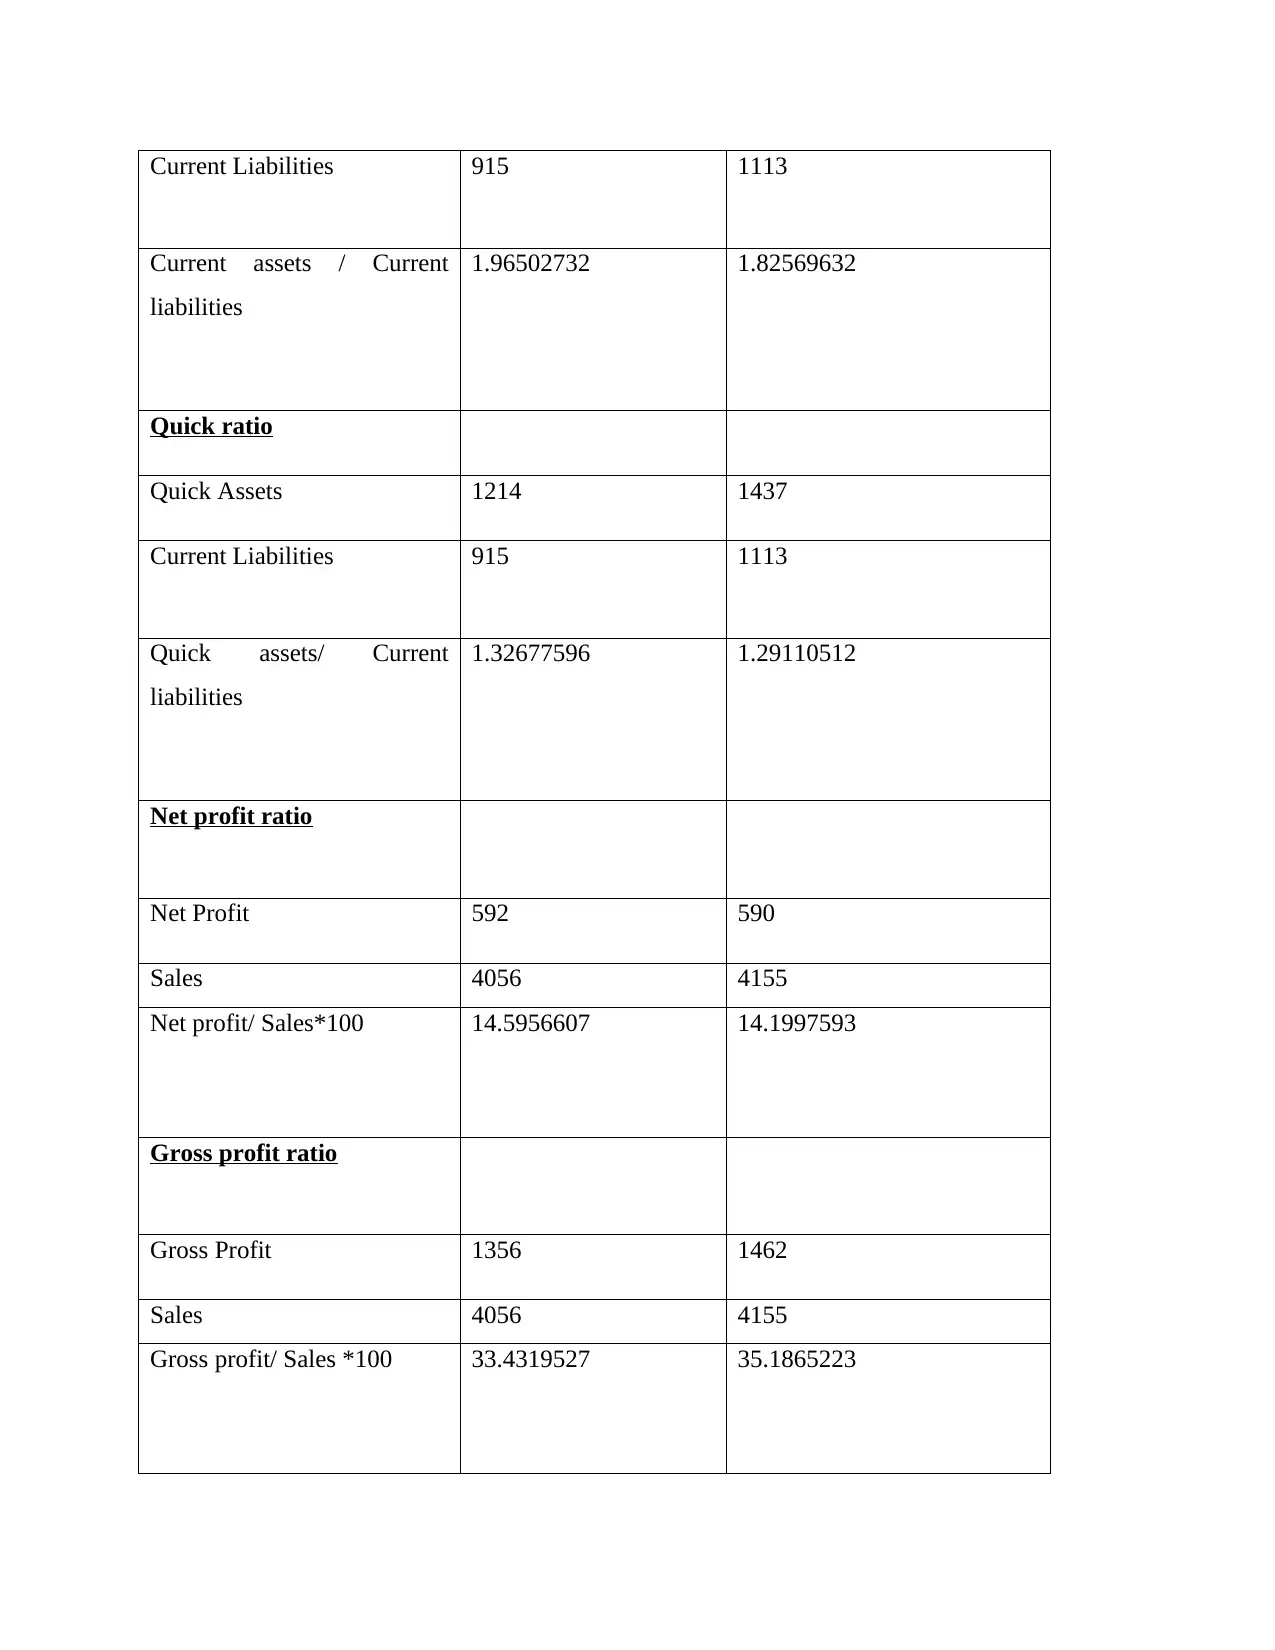
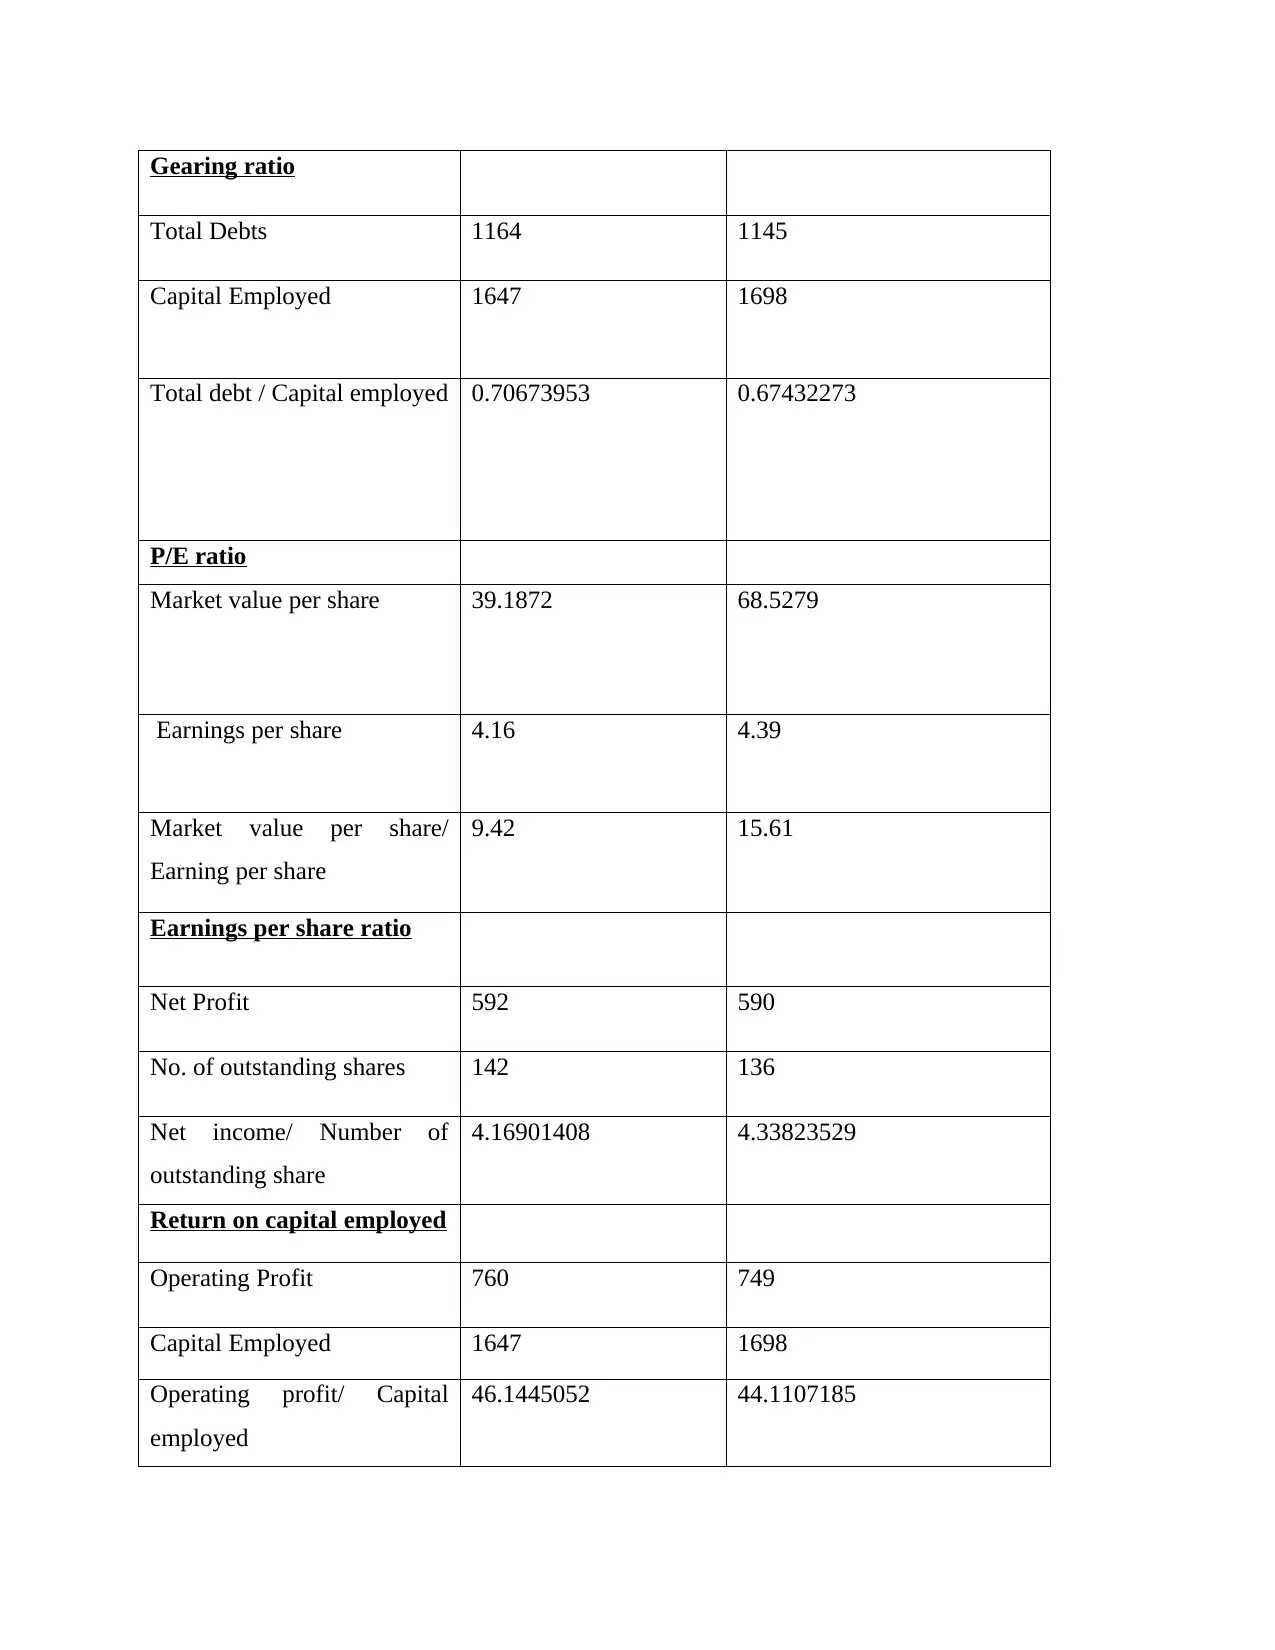
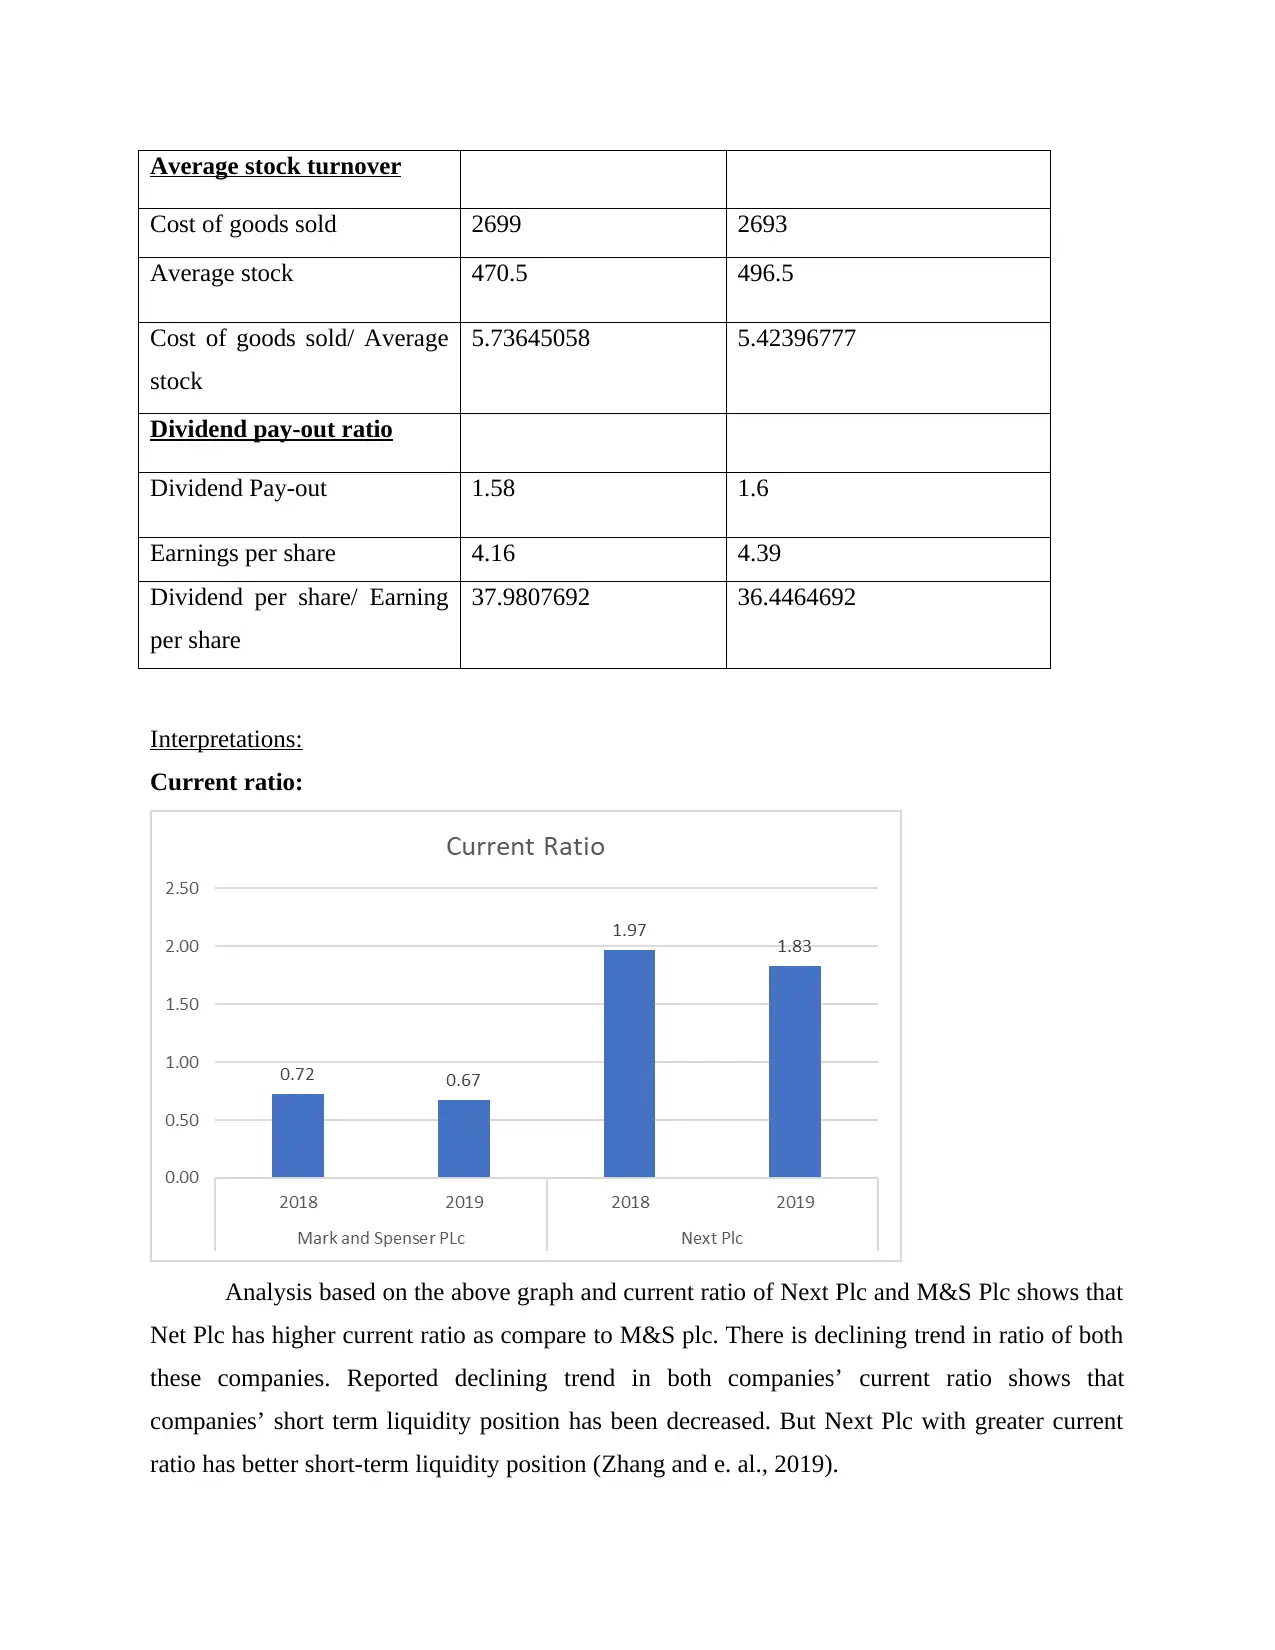
This managerial finance report presents a financial analysis of two leading UK retail supermarket chains, Marks and Spencer Plc and Next Plc. The report begins with an overview of both companies, detailing their operations and market presence. It then proceeds to a comprehensive ratio analysis, comparing key financial metrics such as current ratio, quick ratio, gross profit ratio, net profit ratio, P/E ratio, gearing ratio, return on capital employed, inventory turnover, dividend payout ratio, and earnings per share for both companies over a two-year period. Interpretations of these ratios are provided, highlighting the strengths and weaknesses of each company's financial performance. The report also includes recommendations for both companies to improve their financial positions. Furthermore, the report delves into investment appraisal techniques, specifically net present value (NPV), applied to hypothetical projects, along with a discussion of the limitations of these techniques in long-term decision-making. The conclusion summarizes the key findings and recommendations, providing a holistic view of the financial health and investment strategies of the companies analyzed.
Contribute Materials
Your contribution can guide someone’s learning journey. Share your
documents today.

Managerial Finance
Secure Best Marks with AI Grader
Need help grading? Try our AI Grader for instant feedback on your assignments.

Table of Contents
INTRODUCTION...........................................................................................................................3
PORTFOLIO 1................................................................................................................................3
Ratio analysis:..............................................................................................................................4
Interpretations:.............................................................................................................................8
Recommendations:....................................................................................................................13
Limitations for using ratio analysis for knowing firm’s financial position:..............................14
PORTFOLIO 2..............................................................................................................................14
Investment appraisal techniques for project A and project B:...................................................14
Limitations of using investment appraisal techniques for long term decision-making:............18
CONCLUSION..............................................................................................................................20
REFERENCES..............................................................................................................................22

INTRODUCTION
Managerial finance aids in corporate decision-making because it has a direct impact on
an organization's income, losses, cash flows, including generating revenue. This makes a major
contribution to a corporation 's total growth (Li,., Niskanen and Niskanen, 2019.). The report
offers a financial analysis of UK's leading retail supermarket chain corporations namely Marks
and Spencer Plc and Next Plc, along with recommendations for corporations. This also
comprises practical case analysis on investments appraisal approaches as well as the major flaws
in these approaches.
PORTFOLIO 1
Overview of Companies:
Marks and Spencer Plc: With approximately 400 company-owned company M&s stores within
the domestic market, M&S plc is major retailer in UK. Clothing, accessories, toys, home
furniture and foods are all sold in stores, with large range of products being sold through M&S's
private-labeled St Michael brand. Close to 100 extra Marks & Spencer shops are owned and
operated by the corporation in the Europe, Hong Kong as well as Canada, also 85 M&s shops are
franchised in Europe, Far East, Middle East, Australia, Bahamas including Bermuda. Marks and
Spencer plc also operates Brooks Brothers named men's clothing shopping chain, which has over
170 locations in US and Japan, as well as Kings Super Markets food stores chain, that has 20
locations in the New Jersey. M&S Financial Services offering credit cards, private loans health
insurance including savings, retirement, and pension funds to its clients. Outside of United
States, M&s generates around 17% of its sales (Felix and von Eije., 2019).
Next Plc: The first outlet of NEXT supermarket chain started in Feb. 1982, with exclusive
coordinated line of trendy dresses, shoes, including accessories for ladies. In year 1999, online
shopping being launched, and the whole book became accessible to buy from, section by section,
on internet – a further first in UK. Currently, NEXT has over 500 outlets in the United Kingdom
and Ireland, as well as about 200 outlets in 40 nations around the world Several larger scale
apparel and home outlets have launched in the UK in recent years. NEXT has five sections:
NEXT Retail, that has around 330 stores across UK and Ireland; while, NEXT Directory, that
also has an e-commerce channel; NEXT Overseas, that has franchise agreements across United
States, Asia, Mainland Europe, and Middle East; as well as Ventura, that runs financial services

division. Land management as well as telecommunications software support services are two
other operations.
Ratio analysis:
Ratios Mark and Spenser PLc (GBP in Million)
Year 2018 Year 2019
Current ratio
Current Assets 1318 1490
Current Liabilities 1826 2228
Current assets / Current
liabilities
0.721796276 0.668761221
Quick ratio
Quick Assets 537 790
Current Liabilities 1826 2228
Quick assets/ Current
liabilities
0.294085433 0.354578097
Net profit ratio
Net Profit 26 34
Sales 10698 10377
Net profit/ Sales*100 0.243036082 0.327647682
Gross profit ratio
Gross Profit 4047 3830
Sales 10698 10377
Gross profit/ Sales *100 37.82950084 36.90854775
Gearing ratio
Total Debts 2768 2291
Capital Employed 5724 4972
Total debt / Capital
employed
0.483577918 0.46078037
P/E ratio
Market value per share 2.7466 0.9296
Secure Best Marks with AI Grader
Need help grading? Try our AI Grader for instant feedback on your assignments.

Earnings per share 0.02 0.02
Market value per share/
Earning per share
137.33 46.48
Earnings per share ratio
Net Profit 26 34
No. of outstanding shares 1716 1702
Net income/ Number of
outstanding share
0.02 0.02
Return on capital employed
Operating Profit 671 601
Capital Employed 5724 4972
Operating profit/ Capital
employed
11.72257163 12.08769107
Average stock turnover
Cost of goods sold 6651 6547
Average stock 770 740.5
Cost of goods sold/ Average
stock
8.637662338 8.84132343
Dividend pay-out ratio
Dividend Pay-out 0.18 0.18
Earnings per share 0.02 0.02
Dividend per share/ Earning
per share
900 900
Ratios Next Plc
2018 2019
Current ratio
Current Assets 1798 2032

Current Liabilities 915 1113
Current assets / Current
liabilities
1.96502732 1.82569632
Quick ratio
Quick Assets 1214 1437
Current Liabilities 915 1113
Quick assets/ Current
liabilities
1.32677596 1.29110512
Net profit ratio
Net Profit 592 590
Sales 4056 4155
Net profit/ Sales*100 14.5956607 14.1997593
Gross profit ratio
Gross Profit 1356 1462
Sales 4056 4155
Gross profit/ Sales *100 33.4319527 35.1865223

Gearing ratio
Total Debts 1164 1145
Capital Employed 1647 1698
Total debt / Capital employed 0.70673953 0.67432273
P/E ratio
Market value per share 39.1872 68.5279
Earnings per share 4.16 4.39
Market value per share/
Earning per share
9.42 15.61
Earnings per share ratio
Net Profit 592 590
No. of outstanding shares 142 136
Net income/ Number of
outstanding share
4.16901408 4.33823529
Return on capital employed
Operating Profit 760 749
Capital Employed 1647 1698
Operating profit/ Capital
employed
46.1445052 44.1107185
Paraphrase This Document
Need a fresh take? Get an instant paraphrase of this document with our AI Paraphraser

Average stock turnover
Cost of goods sold 2699 2693
Average stock 470.5 496.5
Cost of goods sold/ Average
stock
5.73645058 5.42396777
Dividend pay-out ratio
Dividend Pay-out 1.58 1.6
Earnings per share 4.16 4.39
Dividend per share/ Earning
per share
37.9807692 36.4464692
Interpretations:
Current ratio:
Analysis based on the above graph and current ratio of Next Plc and M&S Plc shows that
Net Plc has higher current ratio as compare to M&S plc. There is declining trend in ratio of both
these companies. Reported declining trend in both companies’ current ratio shows that
companies’ short term liquidity position has been decreased. But Next Plc with greater current
ratio has better short-term liquidity position (Zhang and e. al., 2019).

Quick Ratio:
The analysis of Quick ratio of shows that Next plc’s quick ratios are 1.33 and 1.29
respectively during 2018 and 2019 reflecting decline in ratio trend. While M&S plc has reported
quick ratio of 0.29 and 0.35 with an increase during 2018 and 2019 respectively. Comparatively
Next plc with higher quick ratio has more efficient cash liquidity position as compare to M&S
plc.
Gross profit ratio:
As shows in graph Gross Profit Ratio of M&S plc are 37.83% and 36.91% during 2018
and 2019 while of Next Plc is 33.43% and 35.19% for the same period. There is significant

increase in Next plc’ ratio while decline in M&S ratio. A decline shows that company’s
efficiency to make profits from their core business activities has been decreased. But M&S plc
with greater gross margin is more efficient to generate gross profit (Ozo and Arun, 2019).
Net Profit/margin ratio:
Net profit ratio of Next Plc are 14.60 and 14.20% during 2018 and 2019 reported minor
decline, while M&S plc’s ratios are 0.24% and 0.33% for the same period. The analysis shows
that Next plc has huge and greater net profitability margin as compare to M&S plc. Thus, Next
Plc’s overall net profitability generation capacity is better than M&S plc.
P/E ratio:
Secure Best Marks with AI Grader
Need help grading? Try our AI Grader for instant feedback on your assignments.

PE ratio of M&S plc are 137.33 and 46.48 and of Next Plc are just 9.42 and 15.61
respectively for year 2018 and 2019. Next plc reported increase but M&S plc with higher PE
ratio is more efficient to provide return to each of their shareholder (Basuki, Hidayat and
Budiwitjaksono, 2020).
Capital gearing ratio:
Next Plc’s gearing ratios are 0.71 and 0.67 for 2018 and 2019 while of M&S plc is 0.48
and 0.46. Thus M&S plc with lower gearing ratio has more effective capital structure with less
debts as compare to Next Plc.
Return on capital employed ratio:

ROCE of M&S plc are 11.72 and 12.09 during 2018 and 2019 while of Next plc are
46.14 and 44.11 for the same period respectively (Shahzad, Colombage and Nawaz., 2019). This
shows that Next plc’s performance in terms of providing yields on overall capital engaged is
quite better than M&S plc.
Inventory turnover ratios:
Next Plc’s inventory turnover ratio for 2018 and 2019 are 5.74 and 5.42 respectively.
While M&S plc’s ratios are 5.74 and 5.42 respectively for year 2018 and 2019. M&S plc with
greater ratio is more efficient to convert their inventories into sales as compare to Next Plc
(Chalu and Lubawa, 2018).
Dividend pay-out ratio:

Dividend pay-out ratio of M&S plc are 900 for both years while of Next plc’s dividend
payout ratios are 37.98 (year 2018) and 36.45 (year 2019) respectivly. This shows that M&S
with greater ratio is more efficient to provide more payout of dividend as compare to Next Plc.
Earnings per share ratio:
EPS of M&S plc are 0.02 for 2018 and 2019 while of Next Plc are 4.17 and 4.34 during
2018 and 2019 respectively. This shows that Next Plc with higher EPS is more ieffeicve in
generating profit for per share held by shareholders,
Recommendations:
Mark and Spenser Plc: As seen in above analysis company’s short-term liquidity and cash
liquidity position is not good as compare to its competitor. Thus, here its is recommended to
company management to emphasise towards company’s working capital management and short-
term liabilities. Instead of using short-term debts to fund company, company should use longer-
term debt. Longer-term debt has the advantage of lower interests’ rates as well as smaller
monthly payments. The principal sum is therefore not due to be paid back right away. The
elimination of shorter-term debts from balance sheet improves quick and Current proportions and
helps them to put some of cash to improved use in short term (Wen and Zhu, 2019). Also,
company shows focus towards their overall profitability position as company has reported lower
profit margins as compare to Next plc. For this company should minimise their overall expenses
along with increase in sales by change in marketing strategies.
Paraphrase This Document
Need a fresh take? Get an instant paraphrase of this document with our AI Paraphraser

Next Plc: main issues of company is increasing reliance over long term debts sources. For
improving their longer term liquidity position company should restructure their long term debts
and evaluate other sources of financing, One way of growing liquidity is to invest unused funds
into liquid assets. Liquidity could only be improved by earning interests rate on deposits whilst
maintaining immediate exposure to the funds Sweep accounts are offered by certain lenders and
finance institutions Such kind of accounts typically connect two or even more accounts,
including a company's checking account for paying daily bills as well as an interests-bearing
account like money market funding (Smith and Dhillon, 2019).
Limitations for using ratio analysis for knowing firm’s financial position:
There are no commonly accepted evaluation criteria for the various types of
percentages/ratios including metrics to be employed. A ratio of such items could be
present in many companies. And bringing the two firms on an equitable basis becomes
complicated.
The study of ratios avoids the organization's practical effectiveness, focusing solely
on quantitative aspects.
Some businesses can deceive the numbers by changing key ratios to give a more
objective view of the business. The use of different ratios in statements can still be used
to do window dressing.
Since the sources of the P&L statements are based on real expenses and revenues, while
the sources of financial reports are based on historical/past data, theoretical assessments
may be unreliable. Using different inputs as combination of both will still be inconclusive
and have opposite effects.
Annual results will be accepted on the last date of every budget period for all those
quantities. As a result, if any numbers are unexpectedly shot or omitted on the final day
of calendar year, the overall ratio estimate will suffer a significant influence (Weidman,
McFarland. and Meric,., 2019).
PORTFOLIO 2
Investment appraisal techniques for project A and project B:
Net Profits Project Project B

A
Plant 1 Plant 2
2020 55000 15000
2021 55000 25000
2022 55000 35000
2023 45000 65000
2024 45000 75000
2025 35000 60000
Residual Value 0 9000
290000 290000
Net Investment 120000 120000
NPV:
Net Profits Project
A
Plant 1 PV @ 1.16 PV of Cash
flows
2020 55000 0.8621 47415.5
2021 55000 0.7432 40876
2022 55000 0.6407 35238.5
2023 45000 0.5523 24853.5
2024 45000 0.4761 21424.5
2025 35000 0.4104 14364
Residual
Value
0 0.4104 0
184172
Initial Net-
investment
120000
NPV 64172

Net Profits Project
B
Plant 2 PV @ 1.16 PV of Cash
flows
2020 15000 0.8621 12931.5
2021 25000 0.7432 18580
2022 35000 0.6407 22424.5
2023 65000 0.5523 35899.5
2024 75000 0.4761 35707.5
2025 60000 0.4104 24624
Residual
Value
9000 0.4104 3693.6
153860.6
Initial Net-
investment
120000
NPV 33860.6
Analysis shows that Project 1 with greater amount of NPV i.e. 64172 is more viable as
compare to project 2.
Payback Period:
Plant 1 Cumulative cash
flows
Investment -120000 -120000
2020 55000 -65000
2021 55000 -10000
2022 55000
2023 45000
2024 45000
2025 35000
Residual Value 0
Payback Period = 2 year + (10000/55000*12)
Secure Best Marks with AI Grader
Need help grading? Try our AI Grader for instant feedback on your assignments.

2 year and 2.18 months
Plant 2
Investment -120000 -
120000
2020 15000 -
105000
2021 25000 -80000
2022 35000 -45000
2023 65000
2024 75000
2025 60000
Residual
Value
9000
Payback
Period =
3 year + (45000/65000*12)
3 year and 8.31 month
Analysis of payback period shows that project with lower payback period i.e., 2 year and
2.18 months is more viable to retrieve overall investment as compare to project 2.
ARR:
Plant 1
2020 55000
2021 55000
2022 55000
2023 45000
2024 45000
2025 35000
Average Profit 48333.33333
Investment = (120000 + 0)/2 60000
ARR = 48333.33 / 60000 *100

80.56%
Plant 2
2020 15000
2021 25000
2022 35000
2023 65000
2024 75000
2025 60000
Average Profit 45833.33
Average Investment (120000+0)/2 60000
ARR = 45833.33 / 60000 *100
76.39%
Analysis of ARR shows that Project 1’s ARR is 80.56% while of Project 2 is 76.39%.
This shows that project 1 with higher ARR is quite more profitable as compare to project 2.
Limitations of using investment appraisal techniques for long term decision-making:
NPV: In relation to business endeavours or projects, a sum of Net Present Value is difference
between present values of all expected cash inflows as well as the present values of all
anticipated cash outlays (Boyd, Burdette and Burks., 2019). This measure is founded on the
project's duration and is beneficial for both budgetary forecasting and project management. This
method makes it simple to assess the effectiveness of possible investment projects.
Cash inflows and outlays aren't just forecasting for calculating net present value figure.
Cost-of-capital must be calculated since they are vital components of assessments. This
number is described as cost which excludes alternative options that may have resulted in
more attractive cash inflows.
Net Present Value generates a percentage of investment that focuses on short-term
ventures instead of long-term results. When a company evaluates a venture for its shorter-

term potential income, the managers will underestimate the proposal's long-term
sustainability.
Another drawback to this approach is that it relies on assumptions. Business must make
assumptions about the pound amount as well as timing of potential cash flows related
to project. In addition, the corporation must calculate interest rate for duration of the
project. Such assumptions might or might not be true. Erroneous assumptions cause
wrong estimates of project's net-present value (Hossain and Kryzanowski., 2019).
NPV approach has the downside of requiring the organization to do more complicated
calculations. Every cash expenditure which will occur during the project must be
estimated by the business. The firm relies on numerical tables to calculate multipliers for
different time spans including interest rates. With each cash deal, the organization must
find the right multiplier as well as multiply cash sum by multiplier.
Payback period: This methodology calculates payback period of investment, or the amount of
years that takes to recoup initial investment costs utilizing investment's cash flows. But even
though approach may improve analysis, its disadvantages can prevent from using this as sole
deciding factor. When choosing between 2 or even more projects, one with shortest payback
period is typically the best option. This is calculated by dividing amount invested to
begin project by the annual revenue generated by project. A project with smaller payback period
would yield more money (Alkaraan, 2017). Many businesses have a maximum reasonable
payback period, but when deciding which expenditure to make, they would prefer ventures with
shorter payback period.
The time cost of money is ignored by the approach. The cash flow into a project may be
abnormal. Investment decisions are typically longer-term and tend to produce profits long
after initial capital has been repaid. A project with a longer payback period, on the other
hand, is often overlooked.
Both basic as well as discounted payback methods do not accommodate for the project's
entire life cycle. Since all cash fund flows past payback period are overlooked, the net
advantage and efficiency of project cannot be calculated using these approaches.
It has the potential to become relative metric. In some cases, project's discounted payback
duration could be greater than management's overall anticipated payback period however
Paraphrase This Document
Need a fresh take? Get an instant paraphrase of this document with our AI Paraphraser

other metrics such as accounting rate of return (ARR) including IRR may benefit the
venture.
The consistency of the outputs is solely dependent on the precision of input given, such
as the precision of cash flows figures, the calculation of cash flows timing that influences
present values, as well as accuracy of discounting rate to be employed among other
things.
ARR: The projected accounting benefit that the corporation makes from investments or
properties is known as accounting rate of return. This is estimated annual profit as percentage
of initial investment expense. This approach is particularly useful for evaluating projects and
making decisions when funds are small. By calculating cost and benefit of new venture, such as
buying an asset, company must determine to choose whether or to not allow it (Hossain and
Kryzanowski., 2019).
Time values of money is totally ignored in this approach. ARR would almost
certainly be used to pick a long-term project.
The manager can try to choose the maximum ARR, however they have no idea what
their goal is. The approach doesn't tell them what minimum required is or what best
return is.
It's difficult to contrast projects that take varying amounts of time. Also, Ignore the
whole proposal's return.
This is just concerned with the profit annually instead of the total return on project.
Some ventures can have low annual returns, but they have a longer useful life
(Kolawale and Grace, 2017).
CONCLUSION
Form the above study this has been articulated that Organizations use managerial finance
practices as an essential business mechanism to evaluate three variables that affect business
operations such as: Form of capital is appropriate for financing a business venture: capital, debts,
or both, amount of money needed as well as occurrence or period during which the capital would
be needed.

REFERENCES
Books and journals:
Dewasiri and et.al., 2019. Determinants of dividend policy: evidence from an emerging and
developing market. Managerial Finance.
Li, K., Niskanen, J. and Niskanen, M., 2019. Capital structure and firm performance in European
SMEs: Does credit risk make a difference?. Managerial Finance.
Felix, T.H. and von Eije, H., 2019. Underpricing in the cryptocurrency world: evidence from
initial coin offerings. Managerial Finance.
Zhang, M., Zhan, F., Johan, S. and Cumming, D., 2019. Law, culture and finance. International
Journal of Managerial Finance.
Ozo, F.K. and Arun, T.G., 2019. Stock market reaction to cash dividends: evidence from the
Nigerian stock market. Managerial Finance.
Shahzad, F., Rehman, I.U., Colombage, S. and Nawaz, F., 2019. Financial reporting quality,
family ownership, and investment efficiency. Managerial Finance.
Smith, K.J. and Dhillon, G., 2019. Assessing blockchain potential for improving the
cybersecurity of financial transactions. Managerial Finance.
Weidman, S.M., McFarland, D.J., Meric, G. and Meric, I., 2019. Determinants of return-on-
equity in USA, German and Japanese manufacturing firms. Managerial Finance.
Boyd, N.E., Zaynutdinova, G.R., Burdette, M. and Burks, N., 2019. Value added: West Virginia
University’s approach to innovative experiential learning. Managerial Finance.
Hossain, A.T. and Kryzanowski, L., 2019. Global financial crisis after ten years: a review of the
causes and regulatory reactions. Managerial Finance.
Palkar, D.D., Sims, R.L. and Kuvvet, E., 2020. Geographical proximity and value of corporate
cash holdings. Managerial Finance.
Vasigh, B., Fleming, K. and Humphreys, B., 2019. Foundations of airline finance. Routledge.
Chaudhary, P., 2020. Impact of board structure, board activities and institutional investors on the
firm risk: evidence from India. Managerial Finance.
1 out of 21
Related Documents

Your All-in-One AI-Powered Toolkit for Academic Success.
+13062052269
info@desklib.com
Available 24*7 on WhatsApp / Email
Unlock your academic potential
© 2024 | Zucol Services PVT LTD | All rights reserved.