Business Finance: Financial Analysis of Rio Tinto Limited Report
VerifiedAdded on 2023/02/01
|17
|4241
|40
Report
AI Summary
This report provides a comprehensive financial analysis of Rio Tinto Limited, a major player in the materials and metals sector. The analysis includes the calculation and interpretation of various financial ratios, such as profitability and efficiency ratios, to assess the company's performance. The report examines the company's profitability position by analyzing net profit margin, return on assets, return on equity, and return on capital employed. Furthermore, the report assesses the efficiency position using working capital ratio, asset turnover ratio, and accounts receivable turnover. The report also compares Rio Tinto's share price movements with the All Ordinaries Index. The capital structure of Rio Tinto is also evaluated. The analysis aims to provide insights for institutional investors, evaluating the company's financial health and investment potential. The report concludes with recommendations based on the financial analysis.

Running head: BUSINESS FINANCE
Business finance
Name of the Student
Name of the University
Author Note
Business finance
Name of the Student
Name of the University
Author Note
Paraphrase This Document
Need a fresh take? Get an instant paraphrase of this document with our AI Paraphraser
BUSINESS FINANCE
Abstract:
The current paper discusses about several financials of the company for assessing the overall
finance performance. For this purpose, one of the companies from materials sector of
Australia has been chosen named Rio Tinto which is the leading suppliers of material and
metals all over the world. Evaluation of the financial performance is done by using several
financial tools such as ratio analysis, computation of WACC and cost of equity using
constant divided growth model and analyzing the share price movements in relation to the
ordinaries index. Moreover, the capital structure of Rio Tinto is also evaluated by analyzing
the change in total value of capital along with changes in the proportion of equity and debt.
The overall report prepared is analyzed for helping the institutional investors to make
investment decisions.
BUSINESS FINANCE
Table of Contents
I. Introduction:............................................................................................................................3
II. FINANCIAL ANALYSIS OF RIO TINTO LIMITED........................................................4
2.1 Description of company.......................................................................................................4
2.2 Calculation and analysis of financial ratios.........................................................................5
Analysis of profitability position:..............................................................................................5
Analysis of efficiency position:.................................................................................................7
2.3 Graphs and comparison of share price movements..............................................................9
2.4 Calculation of cost of equity..............................................................................................11
2.5 Identify the capital structure...............................................................................................11
III. CONCLUSION..................................................................................................................14
IV. RECOMMENDATIONS:..................................................................................................14
⊘ This is a preview!⊘
Do you want full access?
Subscribe today to unlock all pages.
Trusted by 1+ million students worldwide
BUSINESS FINANCE
I. Introduction:
The objective of the report is to demonstrate an understanding of the overall
performance of chosen company from the stock exchange of Australia. Financial analysis of
the selected company has been done by the computation of various profitability and
efficiency ratios that depicts the efficiency and profitability position of company. In addition
to this, the current paper intends to assess the capital structure and determine the influence of
cost of capital on the capital structure of the firm. The share price of Rio Tinto is compared
against the movement of price of all ordinaries index. From the analysis of the different
ratios, it has been found that the company is efficiency in utilizing their assets to generate
income and their profitability position has also improved. Nevertheless, there seems to be
fluctuation in the price of share, the share price is following an upward trend in the current
year encouraging investors to invest in the company shares.
II. FINANCIAL ANALYSIS OF RIO TINTO LIMITED
2.1 Description of company
Rio Tinto is one of the largest metal and mining companies operating in the world
having significant operations in refining particularly for iron ore and refining bauxite. The
organization is engaged in supplying minerals and metals that assist world in growing with
some of the major products comprising of copper, aluminum, industrial minerals, diamond,
gold, and uranium and iron ore. The strong representation of company is in North America
and Australia and has significant business in Europe, Asia, South America and Africa. Some
of the best and largest quality mines and operations of the world has been developed by the
company (Riotinto.com 2019). For finding the potential new sources of metals and minerals,
some of the most advanced exploration technologies are used by the business. Each potential
operation of business is assessed with a focus on potential risk and return and long term value
Paraphrase This Document
Need a fresh take? Get an instant paraphrase of this document with our AI Paraphraser
BUSINESS FINANCE
and sustainability. The minerals and metals of company are used in vast array of products and
the product line is managed by ensuring that they align with the needs of customers and
markets. The organization follows the strategy of creating superior values for shareholders by
maximizing the allocation of capital and cash from the world class assets. The strategy of
group that helps in gaining comparative advantage is focusing on demand led business and
low cost of operations. The product group grows and creates the global market for the
products to deliver value through its strategies of integrated marketing. Some of the strategic
advantage enjoyed by the company includes proximity to key Asian markets, strong presence
in key markets, and low cost position with Pilbara cash unit costing US $ 13.4 tone and high
margin at 68% for EBITDA margin (Riotinto.com 2019). Furthermore, the company is
industry leader in creating responsible mining, supply chain management, innovation and
technology.
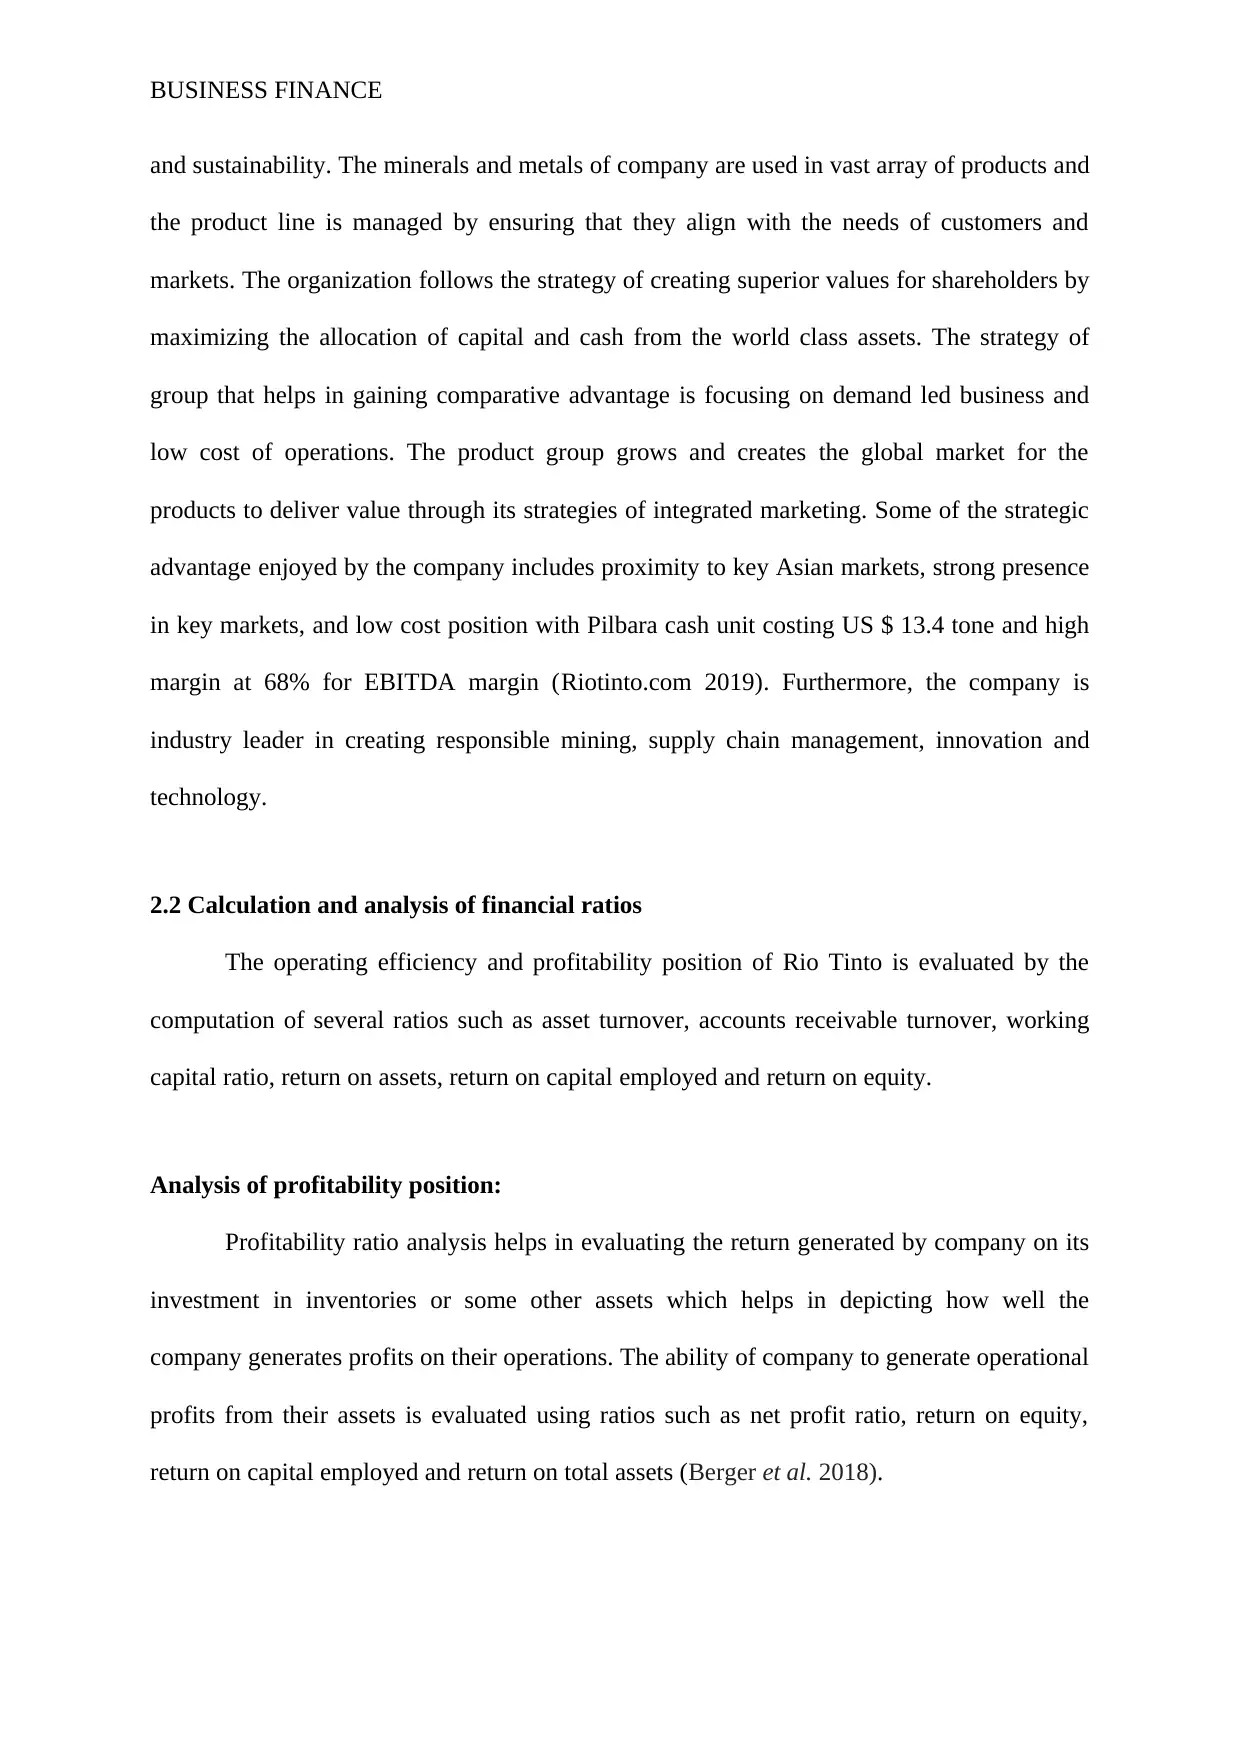
2.2 Calculation and analysis of financial ratios
The operating efficiency and profitability position of Rio Tinto is evaluated by the
computation of several ratios such as asset turnover, accounts receivable turnover, working
capital ratio, return on assets, return on capital employed and return on equity.
Analysis of profitability position:
Profitability ratio analysis helps in evaluating the return generated by company on its
investment in inventories or some other assets which helps in depicting how well the
company generates profits on their operations. The ability of company to generate operational
profits from their assets is evaluated using ratios such as net profit ratio, return on equity,
return on capital employed and return on total assets (Berger et al. 2018).
and sustainability. The minerals and metals of company are used in vast array of products and
the product line is managed by ensuring that they align with the needs of customers and
markets. The organization follows the strategy of creating superior values for shareholders by
maximizing the allocation of capital and cash from the world class assets. The strategy of
group that helps in gaining comparative advantage is focusing on demand led business and
low cost of operations. The product group grows and creates the global market for the
products to deliver value through its strategies of integrated marketing. Some of the strategic
advantage enjoyed by the company includes proximity to key Asian markets, strong presence
in key markets, and low cost position with Pilbara cash unit costing US $ 13.4 tone and high
margin at 68% for EBITDA margin (Riotinto.com 2019). Furthermore, the company is
industry leader in creating responsible mining, supply chain management, innovation and
technology.
2.2 Calculation and analysis of financial ratios
The operating efficiency and profitability position of Rio Tinto is evaluated by the
computation of several ratios such as asset turnover, accounts receivable turnover, working
capital ratio, return on assets, return on capital employed and return on equity.
Analysis of profitability position:
Profitability ratio analysis helps in evaluating the return generated by company on its
investment in inventories or some other assets which helps in depicting how well the
company generates profits on their operations. The ability of company to generate operational
profits from their assets is evaluated using ratios such as net profit ratio, return on equity,
return on capital employed and return on total assets (Berger et al. 2018).
BUSINESS FINANCE
Net profit ratio Return on Total
Assets Return on
Equity Return on
capital
employed
0.00
0.05
0.10
0.15
0.20
0.25
0.30
0.35
0.40
0.45
0.50
0.35
0.09
0.20
0.17
0.44
0.15
0.32
0.22 2017
2018
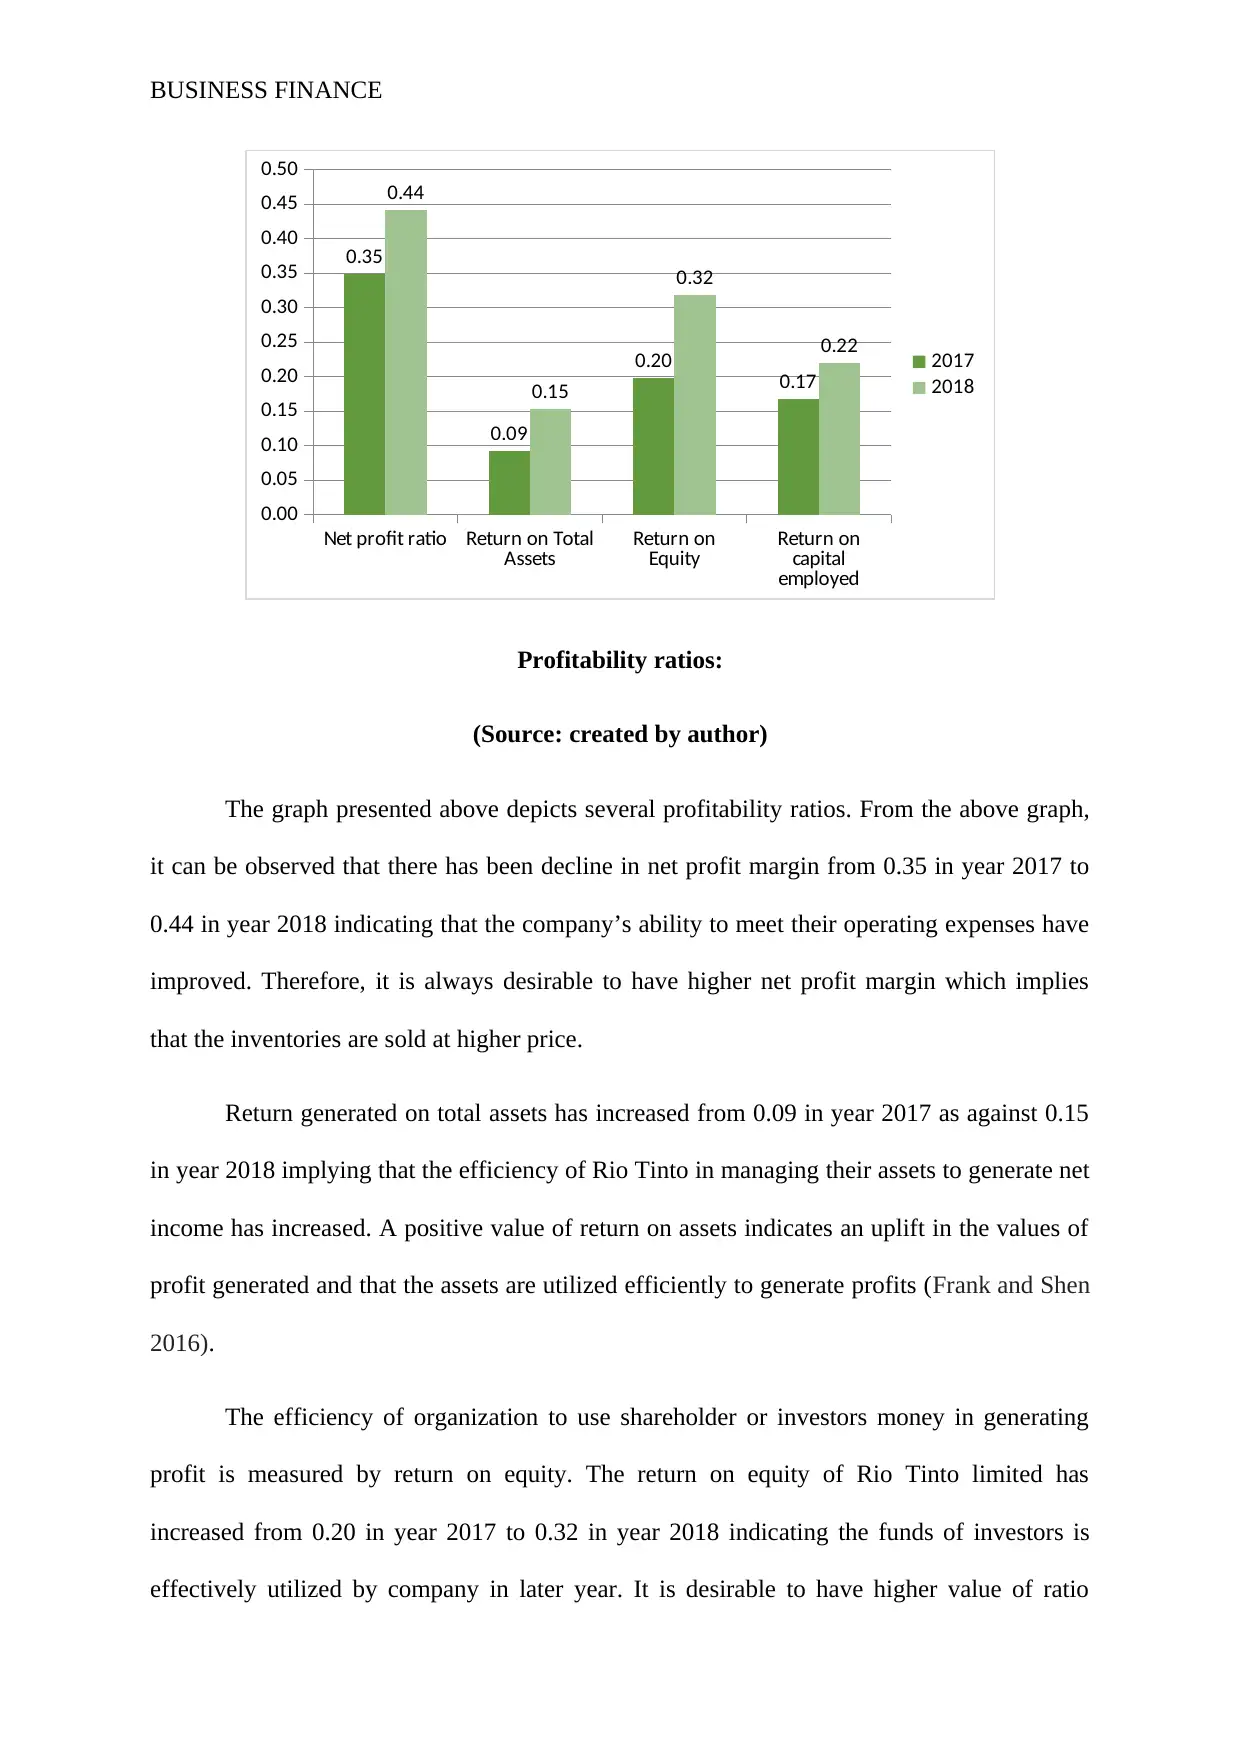
Profitability ratios:
(Source: created by author)
The graph presented above depicts several profitability ratios. From the above graph,
it can be observed that there has been decline in net profit margin from 0.35 in year 2017 to
0.44 in year 2018 indicating that the company’s ability to meet their operating expenses have
improved. Therefore, it is always desirable to have higher net profit margin which implies
that the inventories are sold at higher price.
Return generated on total assets has increased from 0.09 in year 2017 as against 0.15
in year 2018 implying that the efficiency of Rio Tinto in managing their assets to generate net
income has increased. A positive value of return on assets indicates an uplift in the values of
profit generated and that the assets are utilized efficiently to generate profits (Frank and Shen
2016).
The efficiency of organization to use shareholder or investors money in generating
profit is measured by return on equity. The return on equity of Rio Tinto limited has
increased from 0.20 in year 2017 to 0.32 in year 2018 indicating the funds of investors is
effectively utilized by company in later year. It is desirable to have higher value of ratio
Net profit ratio Return on Total
Assets Return on
Equity Return on
capital
employed
0.00
0.05
0.10
0.15
0.20
0.25
0.30
0.35
0.40
0.45
0.50
0.35
0.09
0.20
0.17
0.44
0.15
0.32
0.22 2017
2018
Profitability ratios:
(Source: created by author)
The graph presented above depicts several profitability ratios. From the above graph,
it can be observed that there has been decline in net profit margin from 0.35 in year 2017 to
0.44 in year 2018 indicating that the company’s ability to meet their operating expenses have
improved. Therefore, it is always desirable to have higher net profit margin which implies
that the inventories are sold at higher price.
Return generated on total assets has increased from 0.09 in year 2017 as against 0.15
in year 2018 implying that the efficiency of Rio Tinto in managing their assets to generate net
income has increased. A positive value of return on assets indicates an uplift in the values of
profit generated and that the assets are utilized efficiently to generate profits (Frank and Shen
2016).
The efficiency of organization to use shareholder or investors money in generating
profit is measured by return on equity. The return on equity of Rio Tinto limited has
increased from 0.20 in year 2017 to 0.32 in year 2018 indicating the funds of investors is
effectively utilized by company in later year. It is desirable to have higher value of ratio
⊘ This is a preview!⊘
Do you want full access?
Subscribe today to unlock all pages.
Trusted by 1+ million students worldwide
BUSINESS FINANCE
compared to lower value as it implies that company is generating higher profit because of
efficiently utilizing the investor’s fund.
The ability of company to generate profits by employing each dollar of capital
employed is measured by computing return on capital employed ratio. It can be seen that
return on capital employed of Rio Tinto has increased from 0.17 in year 2017 compared to
0.22 in year 2018. This increase in ratio is considered favorable because it indicates that with
each dollar of capital employed, there is more dollars of profits generated (Song et al. 2018).
Therefore, from the analysis of all the profitability ratios, it can be inferred that
profitability position of Rio Tinto has improved in the current year of analysis as the
company is performing well to achieve increased level of profits from their operations.
Hence, the company is making enough operational profits from the investment in assets
which is considered attractive for investors to make investment in the company (Gitman et al.
2015).
Analysis of efficiency position:
Efficiency ratios help in evaluating the efficiency of companies in utilizing their
assets to generate income and the management uses this ratio for improving the profitability
from operations to investors and creditors (Belo et al. 2015). Some of the profitability ratios
that have been computed for the analysis purpose includes working capital ratio, asset
turnover ratio and accounts receivable turnover.
Paraphrase This Document
Need a fresh take? Get an instant paraphrase of this document with our AI Paraphraser
BUSINESS FINANCE
Working capital ratio Asset turnover ratio Accounts receivable
turnover
0.00
1.00
2.00
3.00
4.00
5.00
6.00
7.00
8.00
9.00
1.66
0.29
7.83
1.91
0.29
7.95
2017
2018
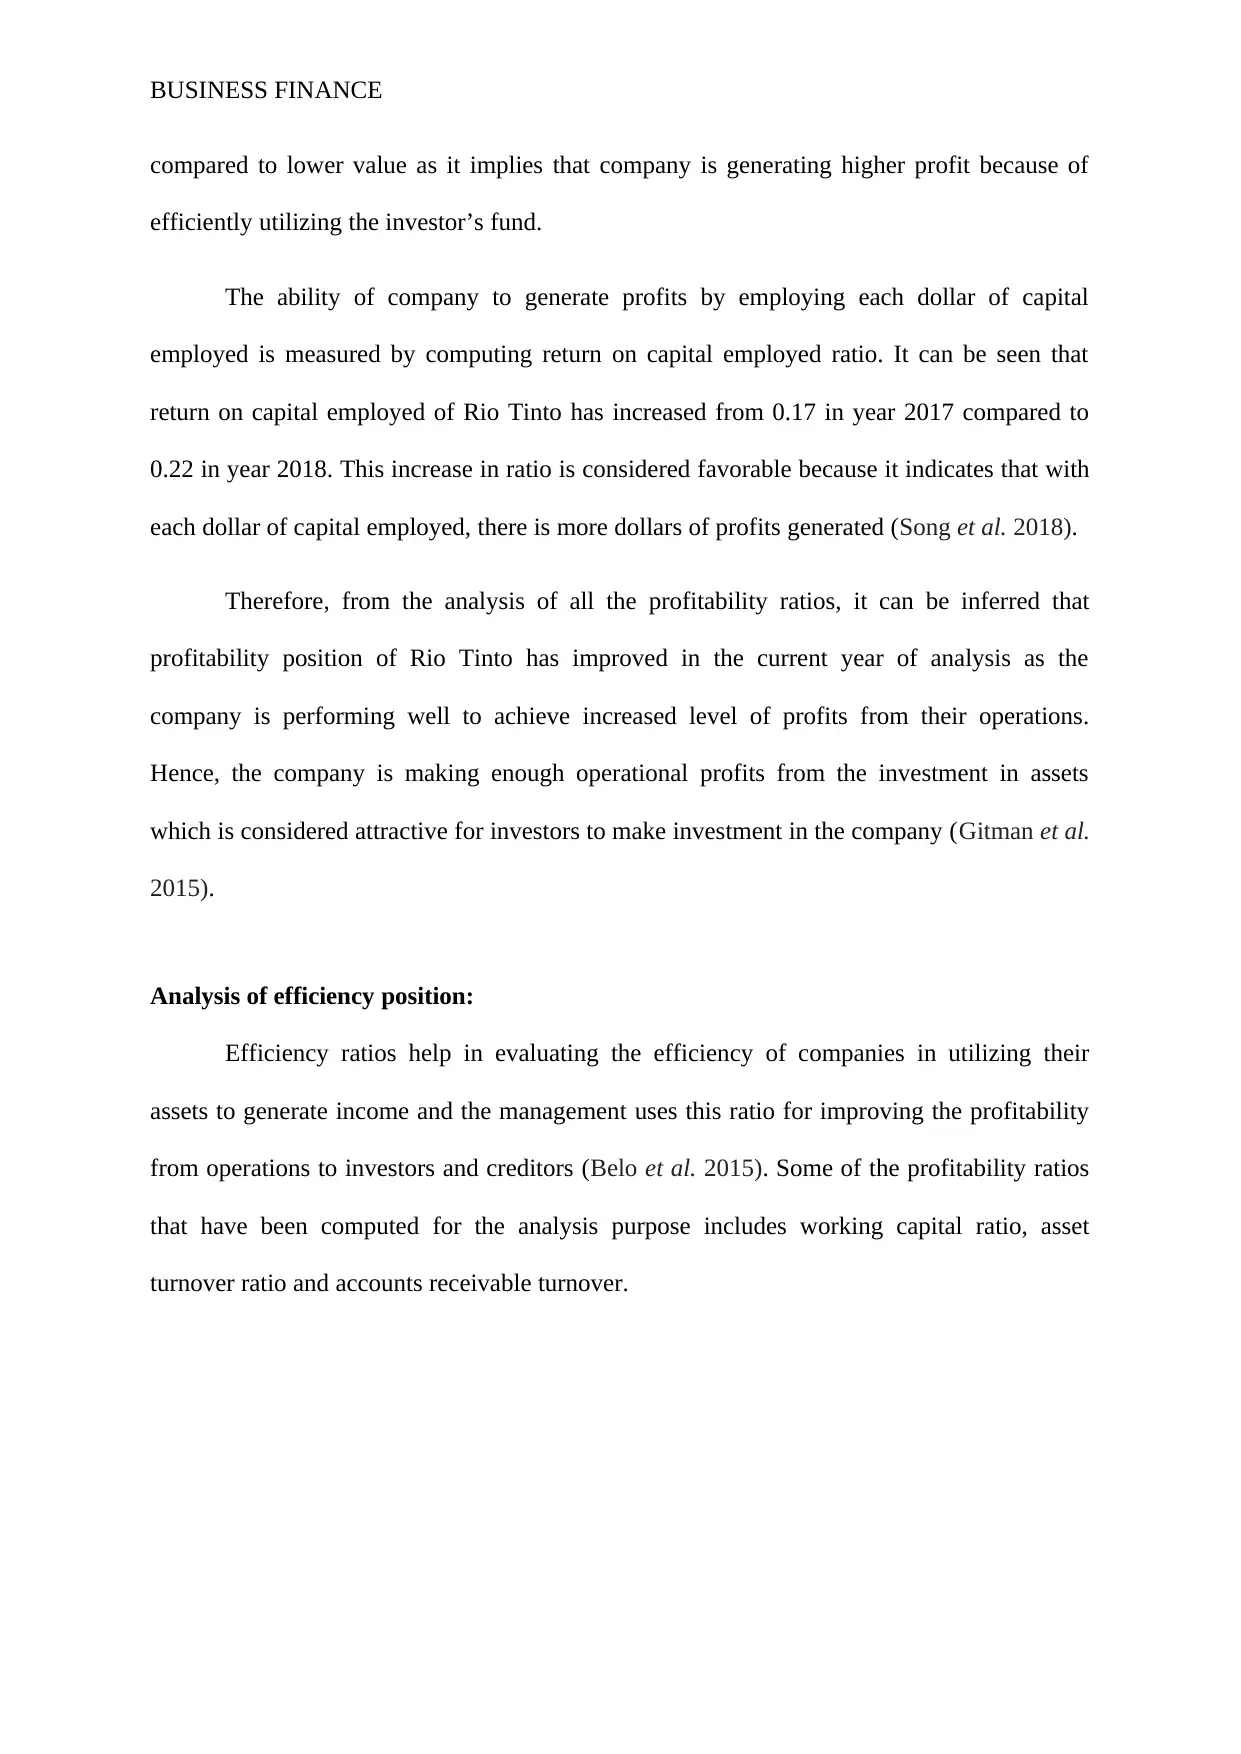
Efficiency ratios:
(Source: created by author)
It can be observed from the above graph that the working capital ratio for Rio Tinto in
year 2018 is recorded at 1.91 compared to 1.66 in year 2017. It is considered desirable to
have higher working capital ratio because it implies that organization have sufficient current
assets to finance or pay of their current obligations. Hence, an increase in working capital
ratio implies that the organization is running efficiently in terms of making payment of
current obligations using the current assets.
The ability of organization to utilize their assets in generating sales is measured using
efficiency ratios and it is always preferred to have higher ratios because it implies efficiency
of management in utilizing the assets. From the above graph, it is noticed that the asset
turnover ratio has remained constant at the value of 0.29. It can be seen that the value of asset
turnover ratio is lower than one which implies that for every one dollar invested, the common
is generating sales of value less than dollar. This lower is implication of the fact that assets
are not efficiently utilized and the issue might be attributable to production or management
problems.
Working capital ratio Asset turnover ratio Accounts receivable
turnover
0.00
1.00
2.00
3.00
4.00
5.00
6.00
7.00
8.00
9.00
1.66
0.29
7.83
1.91
0.29
7.95
2017
2018
Efficiency ratios:
(Source: created by author)
It can be observed from the above graph that the working capital ratio for Rio Tinto in
year 2018 is recorded at 1.91 compared to 1.66 in year 2017. It is considered desirable to
have higher working capital ratio because it implies that organization have sufficient current
assets to finance or pay of their current obligations. Hence, an increase in working capital
ratio implies that the organization is running efficiently in terms of making payment of
current obligations using the current assets.
The ability of organization to utilize their assets in generating sales is measured using
efficiency ratios and it is always preferred to have higher ratios because it implies efficiency
of management in utilizing the assets. From the above graph, it is noticed that the asset
turnover ratio has remained constant at the value of 0.29. It can be seen that the value of asset
turnover ratio is lower than one which implies that for every one dollar invested, the common
is generating sales of value less than dollar. This lower is implication of the fact that assets
are not efficiently utilized and the issue might be attributable to production or management
problems.
BUSINESS FINANCE
Accounts receivable turnover measures the efficiency of the company regarding the
number of times account receivable is converted into cash. In other words, the efficiency of
company in collecting its credit sales from customers is measured with this ratio. Accounts
receivable turnover for Rio Tinto is computed at 7.83 in year 2017 and the value increased to
7.95 in year 2018. This increase in ratio is preferable as it implies that there is frequent
collection of cash from the credit sales made to customers and such cash helps in meeting the
obligations such as payment of bills and other obligations.
From the analysis of the figures related to efficiency ratios, it is inferred that the
overall efficiency position of Rio Tinto has improved in recent years and the company is
efficient with the resources and is conclusive of the fact that assets are utilized appropriate to
generate income.
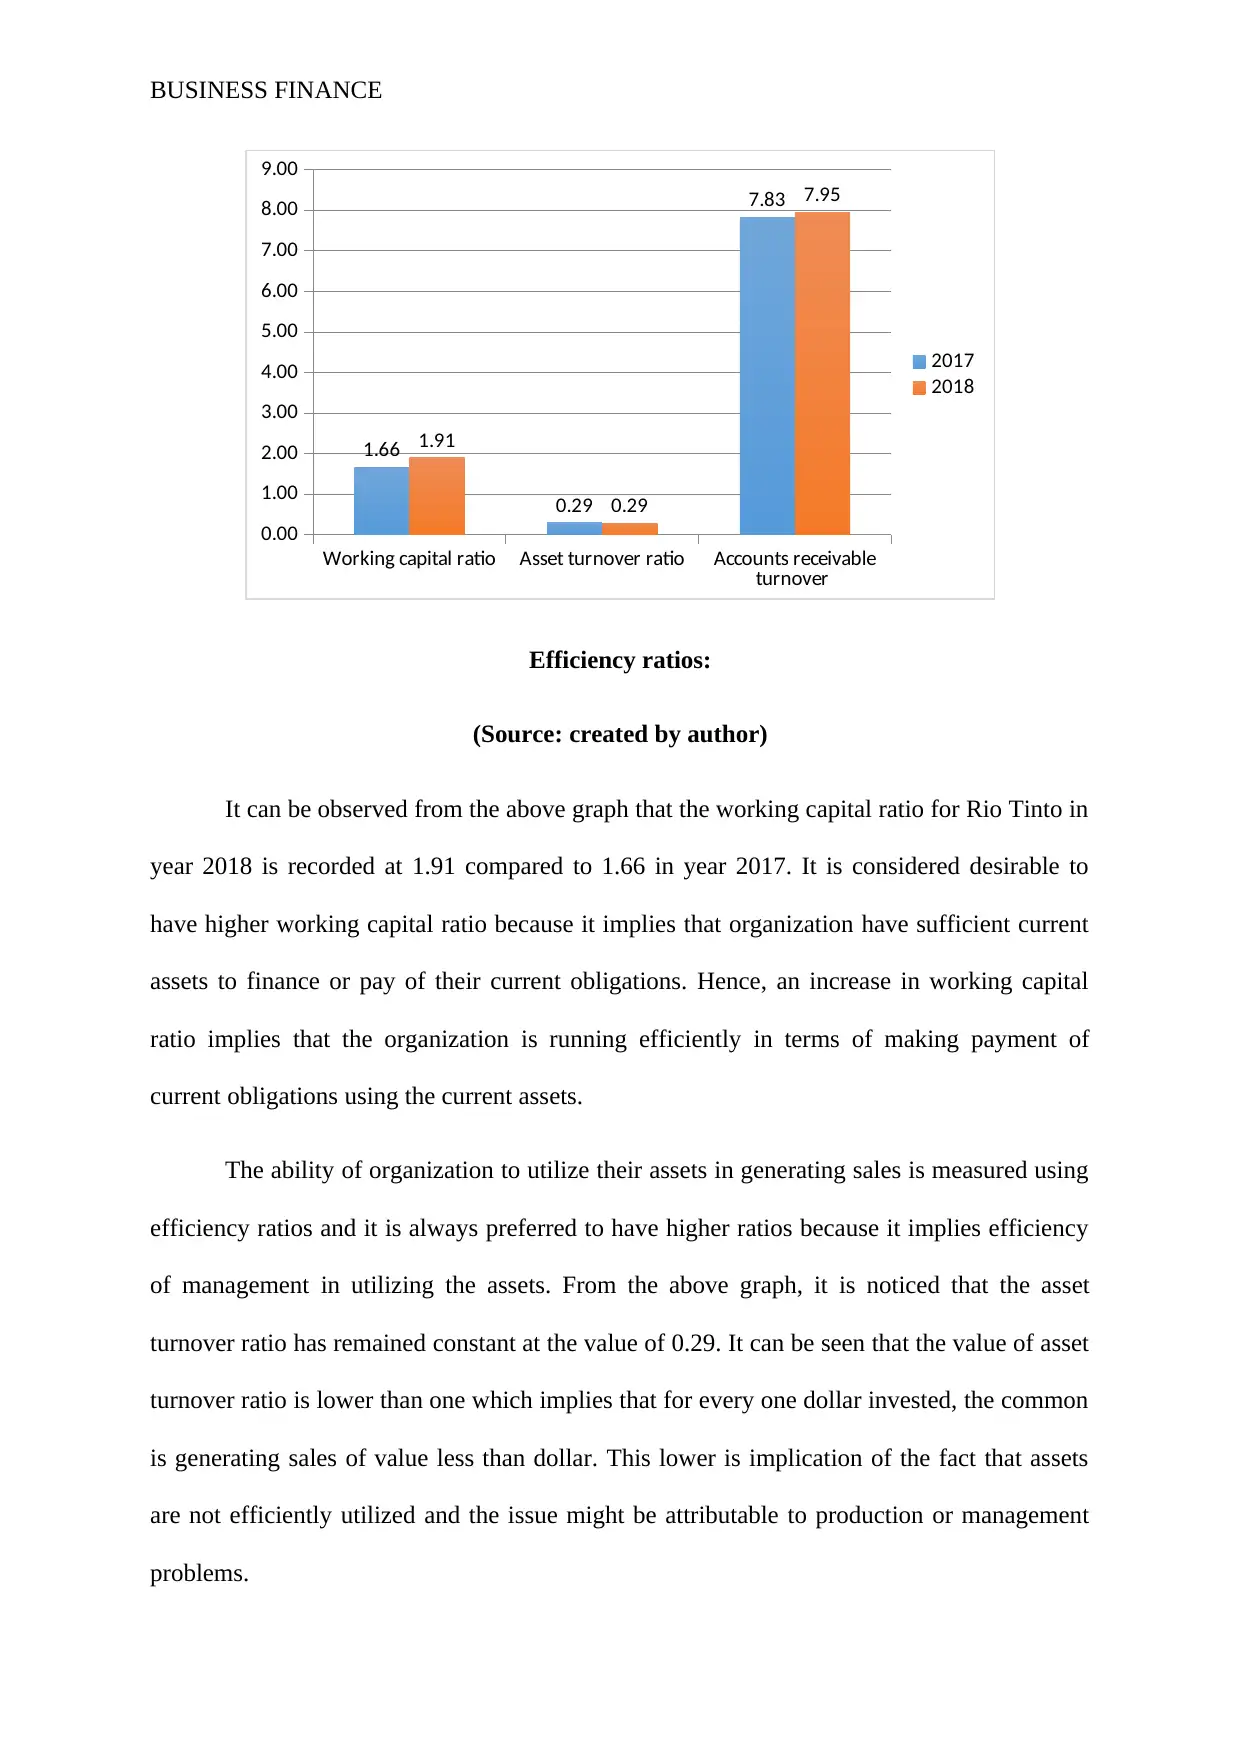
2.3 Graphs and comparison of share price movements
This section demonstrates the comparison of movement in price of shares of Rio
Tinto to All ordinaries Index by computing the monthly return generated.
01/01/2017
01/04/2017
01/07/2017
01/10/2017
01/01/2018
01/04/2018
01/07/2018
01/10/2018
-0.15
-0.1
-0.05
0
0.05
0.1
0.15
Monthly Return
Monthly return of index
Accounts receivable turnover measures the efficiency of the company regarding the
number of times account receivable is converted into cash. In other words, the efficiency of
company in collecting its credit sales from customers is measured with this ratio. Accounts
receivable turnover for Rio Tinto is computed at 7.83 in year 2017 and the value increased to
7.95 in year 2018. This increase in ratio is preferable as it implies that there is frequent
collection of cash from the credit sales made to customers and such cash helps in meeting the
obligations such as payment of bills and other obligations.
From the analysis of the figures related to efficiency ratios, it is inferred that the
overall efficiency position of Rio Tinto has improved in recent years and the company is
efficient with the resources and is conclusive of the fact that assets are utilized appropriate to
generate income.
2.3 Graphs and comparison of share price movements
This section demonstrates the comparison of movement in price of shares of Rio
Tinto to All ordinaries Index by computing the monthly return generated.
01/01/2017
01/04/2017
01/07/2017
01/10/2017
01/01/2018
01/04/2018
01/07/2018
01/10/2018
-0.15
-0.1
-0.05
0
0.05
0.1
0.15
Monthly Return
Monthly return of index
⊘ This is a preview!⊘
Do you want full access?
Subscribe today to unlock all pages.
Trusted by 1+ million students worldwide
BUSINESS FINANCE
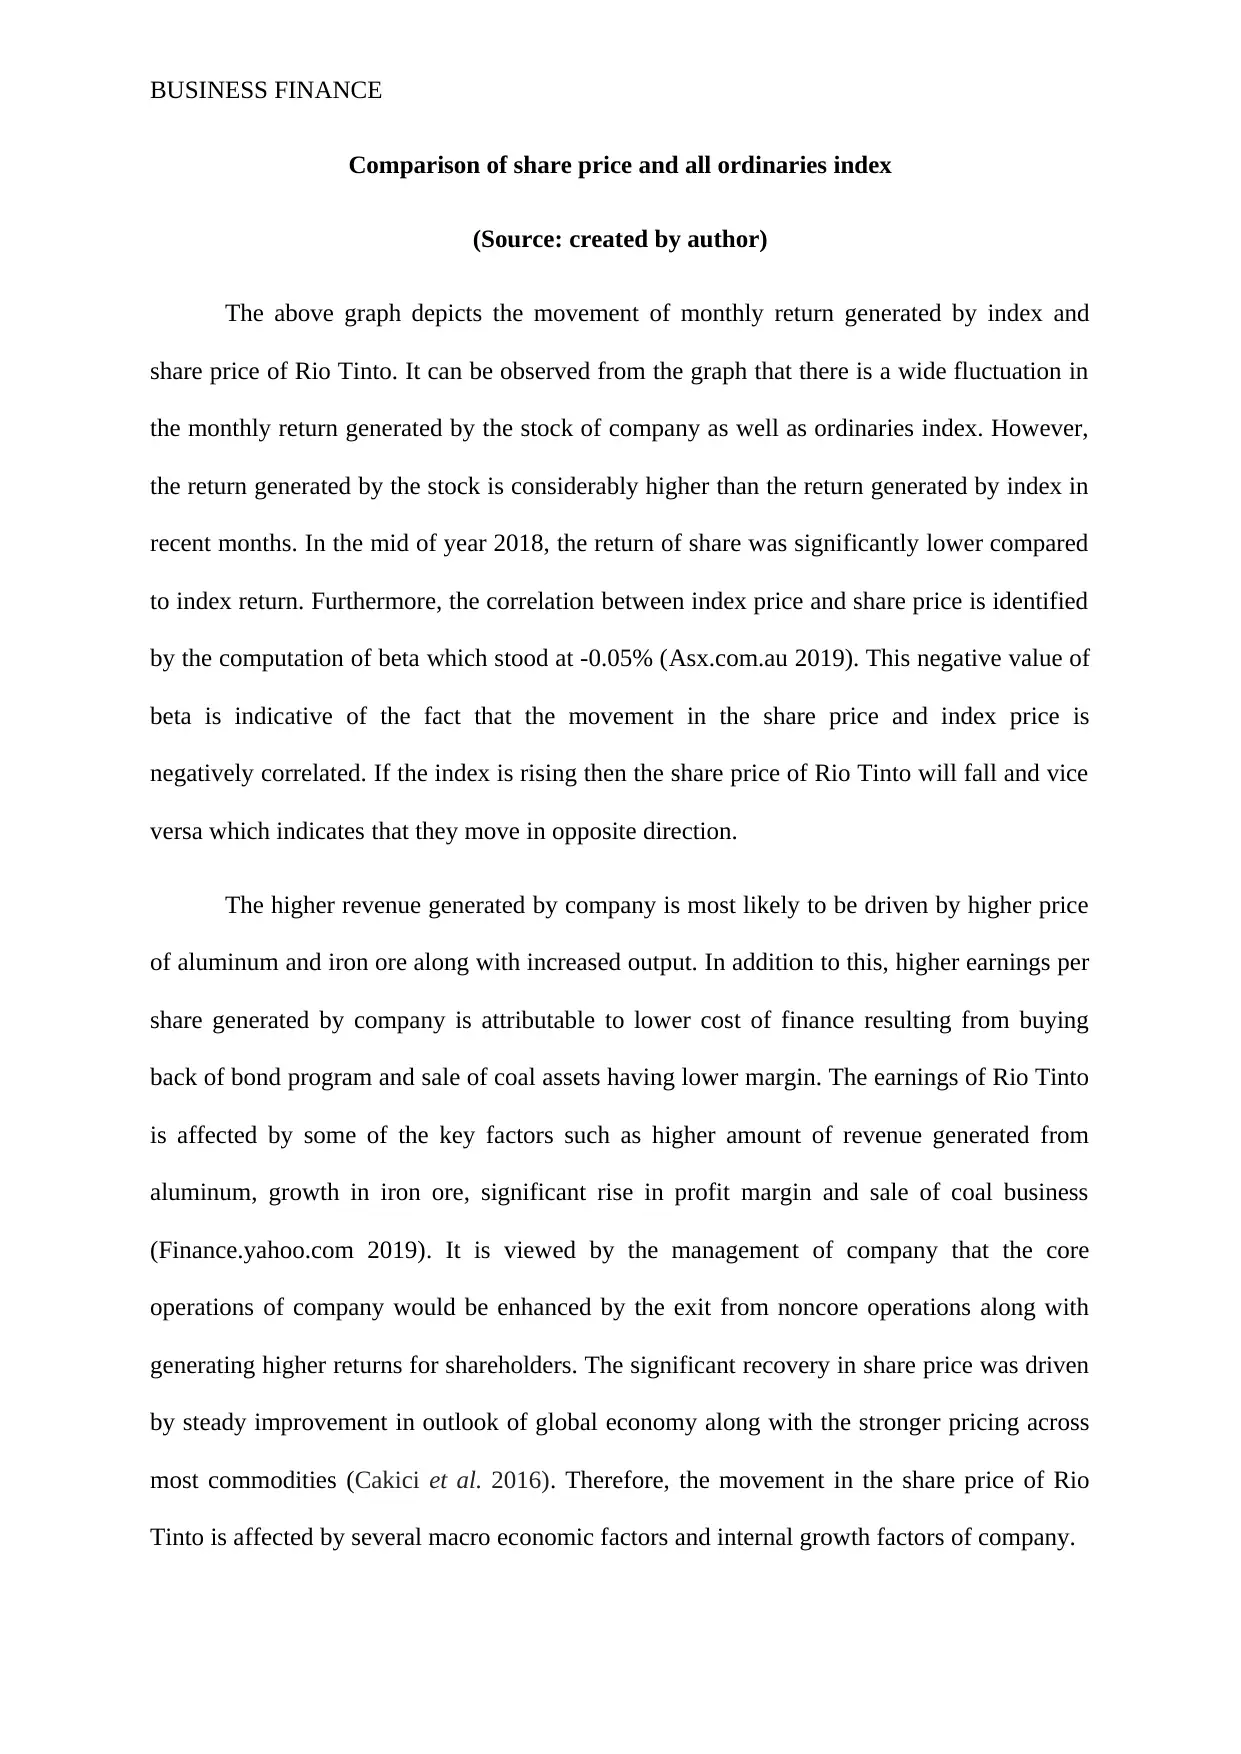
Comparison of share price and all ordinaries index
(Source: created by author)
The above graph depicts the movement of monthly return generated by index and
share price of Rio Tinto. It can be observed from the graph that there is a wide fluctuation in
the monthly return generated by the stock of company as well as ordinaries index. However,
the return generated by the stock is considerably higher than the return generated by index in
recent months. In the mid of year 2018, the return of share was significantly lower compared
to index return. Furthermore, the correlation between index price and share price is identified
by the computation of beta which stood at -0.05% (Asx.com.au 2019). This negative value of
beta is indicative of the fact that the movement in the share price and index price is
negatively correlated. If the index is rising then the share price of Rio Tinto will fall and vice
versa which indicates that they move in opposite direction.
The higher revenue generated by company is most likely to be driven by higher price
of aluminum and iron ore along with increased output. In addition to this, higher earnings per
share generated by company is attributable to lower cost of finance resulting from buying
back of bond program and sale of coal assets having lower margin. The earnings of Rio Tinto
is affected by some of the key factors such as higher amount of revenue generated from
aluminum, growth in iron ore, significant rise in profit margin and sale of coal business
(Finance.yahoo.com 2019). It is viewed by the management of company that the core
operations of company would be enhanced by the exit from noncore operations along with
generating higher returns for shareholders. The significant recovery in share price was driven
by steady improvement in outlook of global economy along with the stronger pricing across
most commodities (Cakici et al. 2016). Therefore, the movement in the share price of Rio
Tinto is affected by several macro economic factors and internal growth factors of company.
Paraphrase This Document
Need a fresh take? Get an instant paraphrase of this document with our AI Paraphraser
BUSINESS FINANCE
2.4 Calculation of cost of equity
The dividend growth model is used for computing the cost of equity which is the
return generated by the investment made in equity. Such model takes into account the
assumption that the dividend paid by company grows at constant rate. The market cost of
equity and the value of equity of firms are linked by modeling the expected future value of
dividends that would be received by shareholders (Boyer et al. 2017). The growth model
makes use of following formula for computing the cost of equity.
Cost of equity= (Annual dividend paid in the next year/ Current price of stock) + growth rate
of dividend
Constant growth rate of dividend= 4%
Current price of stock= 45.003
Annual dividend paid= $ 5.3 billion
Cost of equity= (5.3/45.003) + 4%= 0.11776*100+4= 15.776%
Therefore, the required rate of return generated on equity investment of Rio Tinto is
15.776%.
2.5 Identify the capital structure
The capital structure of organization is how the organization finances their growth and
operations by using different sources of funds. It is desirable for organization to have optimal
capital structure that there should be proper and appropriate proportion of equity and debt in
the capital structure which indicates that the firm has best combination of debt and equity
(Adam et al. 2017). In other words, the proportion of equity and debt that results in lowest
WACC (weighted average cost of capital) gives the optimal capital structure.
BUSINESS FINANCE
The weighted average cost of capital is computed by the organization for determining
the level of risk so that the cost of capital is lower than the expected return on capital. In this
section, it is required to compute the weighted average cost of capital of Rio Tinto for which
the required rate of return on preference shares and required rate of return on industrial debt
is given. The formula for computing the weighted average cost of capital is given below:
WACC= (E/V * Re) + ((D/V*Kd)* (1-T))
Where E is the market value of firm’s equity
D is the market value of firm’s debt and V denotes the total value of capital.
D/V is the weightage of debt to total capital and E/V is the weightage of equity to total
capital.
Kd is the debt cost and Re is the equity cost
T is the rate of tax
In the computation of WACC, it is seen that the company does not have any
preference shares and hence no required rate of return on preference share is taken into
account while computing the cost of capital (Brusov et al. 2017).
Therefore, WACC= (51115/66263*16%) + (15148/66263*5%)*(1-30%) = 16%.
From the computation of WACC, it can be seen that the value of WACC is
approximately same as the cost of equity.
The change in structure of capital of Rio Tinto is presented in the table below which
shows the change in value of debt and equity in relation to the total amount of capital. The
weight of debt and equity is also computed.
⊘ This is a preview!⊘
Do you want full access?
Subscribe today to unlock all pages.
Trusted by 1+ million students worldwide
1 out of 17
Related Documents


Your All-in-One AI-Powered Toolkit for Academic Success.
+13062052269
info@desklib.com
Available 24*7 on WhatsApp / Email
![[object Object]](/_next/static/media/star-bottom.7253800d.svg)
Unlock your academic potential
Copyright © 2020–2026 A2Z Services. All Rights Reserved. Developed and managed by ZUCOL.