Financial Decision Making: Starbucks' Takeover of Roast Ltd Analysis
VerifiedAdded on 2023/01/12
|18
|4622
|55
Report
AI Summary
This report provides a comprehensive financial analysis of Roast Ltd, a UK cafe franchise, focusing on financial decision-making in the context of a potential Starbucks takeover. The analysis includes an industry review, examining market trends and challenges within the coffee shop sector. The core of the report analyzes Roast Ltd's financial performance through its profit and loss statements, balance sheets, and cash flow statements, utilizing financial ratios to assess profitability, liquidity, and solvency. The report also explores investment appraisal techniques, such as dividend yield, NPV, and payback period, considering their advantages and disadvantages in the context of Roast Ltd. The findings aim to assist Starbucks in making informed decisions regarding the acquisition of Roast Ltd, offering insights into the company's financial health and potential for growth.

Financial Decision Making
Paraphrase This Document
Need a fresh take? Get an instant paraphrase of this document with our AI Paraphraser

Contents
EXECUTIVE SUMMARY.........................................................................................................................4
MAIN BODY..............................................................................................................................................4
Part 1. Industry Review:..............................................................................................................................4
Part 2. Business Performance Analysis:......................................................................................................5
2.1 Analysis of profit and loss account statement....................................................................................5
2.2 Statement of financial position:.........................................................................................................7
2.3 Statement of Cash flow....................................................................................................................10
Part 3. Investment Appraisals:...................................................................................................................14
3.1 a Management forecast....................................................................................................................14
3.1 b Investment appraisal technique:...................................................................................................15
3.2 Source of finance.............................................................................................................................16
REFERENCES..........................................................................................................................................18
⊘ This is a preview!⊘
Do you want full access?
Subscribe today to unlock all pages.
Trusted by 1+ million students worldwide
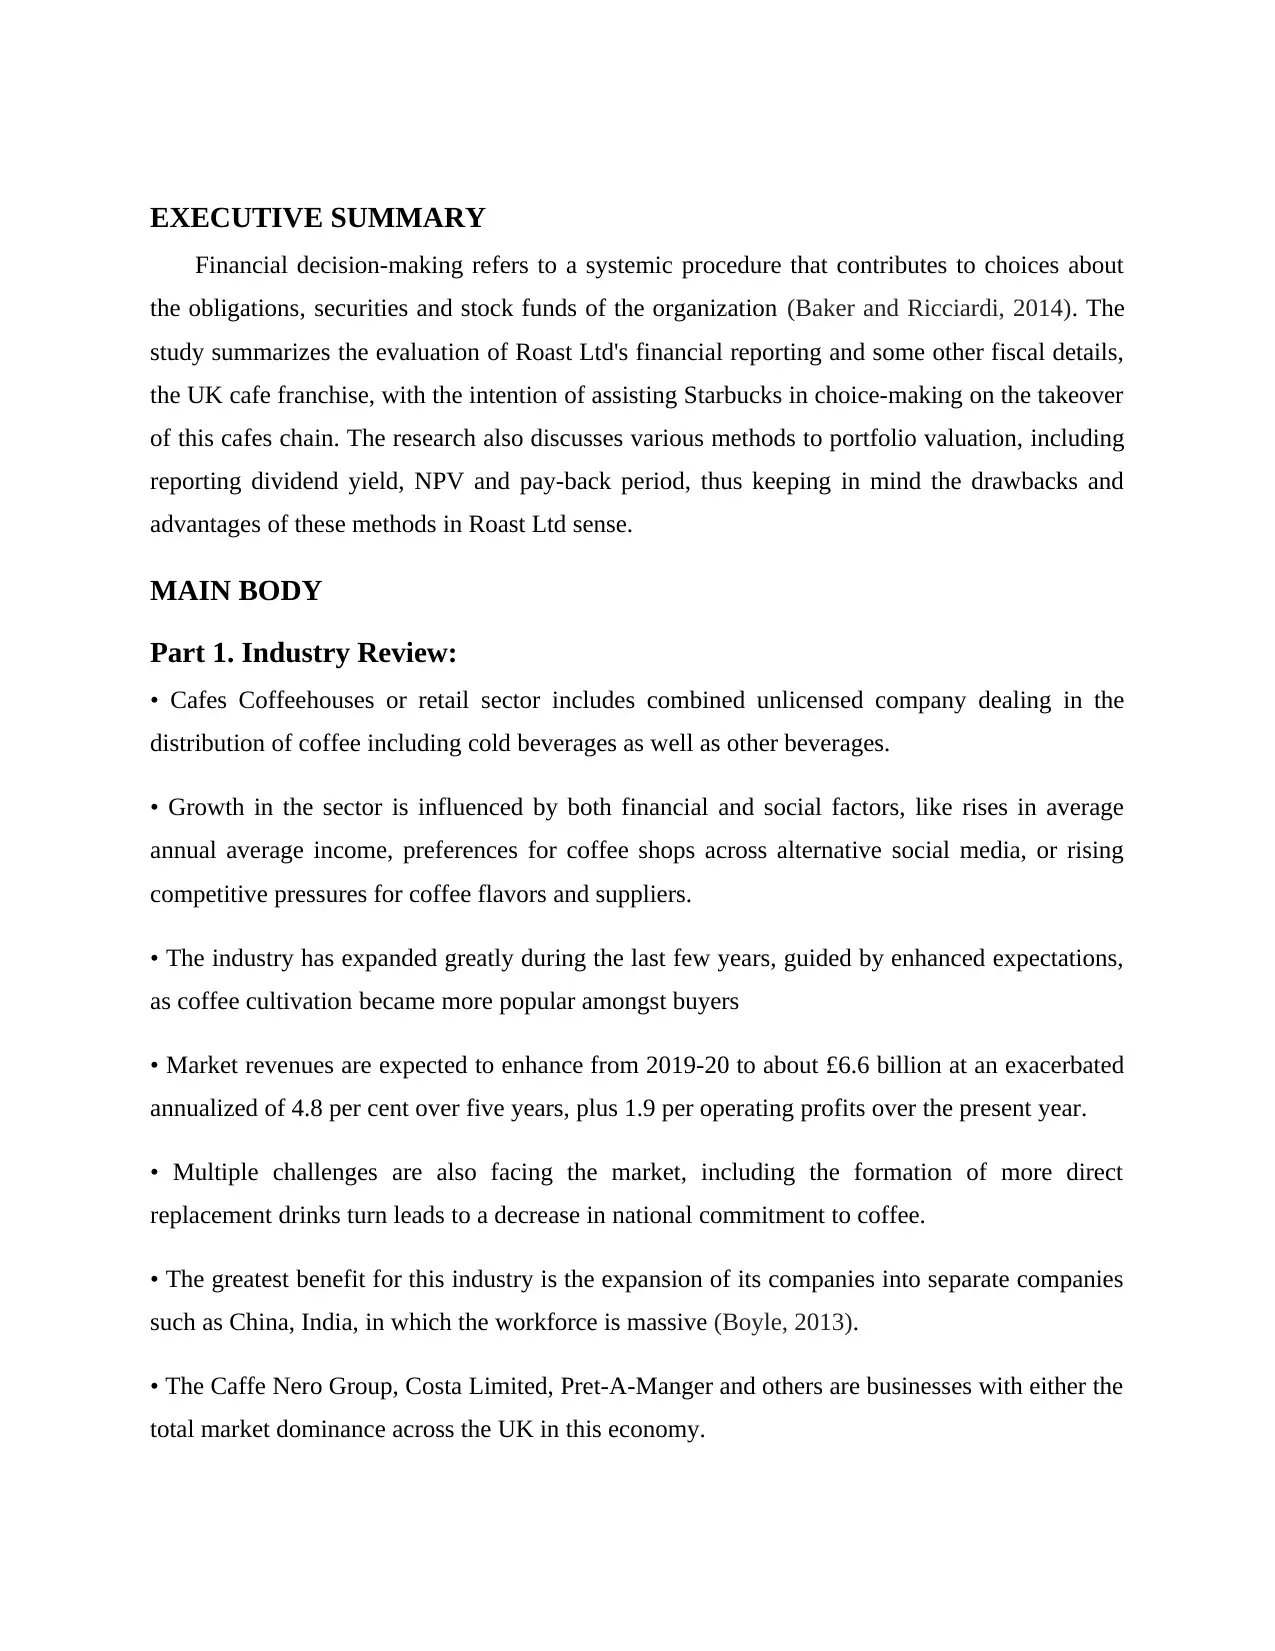
EXECUTIVE SUMMARY
Financial decision-making refers to a systemic procedure that contributes to choices about
the obligations, securities and stock funds of the organization (Baker and Ricciardi, 2014). The
study summarizes the evaluation of Roast Ltd's financial reporting and some other fiscal details,
the UK cafe franchise, with the intention of assisting Starbucks in choice-making on the takeover
of this cafes chain. The research also discusses various methods to portfolio valuation, including
reporting dividend yield, NPV and pay-back period, thus keeping in mind the drawbacks and
advantages of these methods in Roast Ltd sense.
MAIN BODY
Part 1. Industry Review:
• Cafes Coffeehouses or retail sector includes combined unlicensed company dealing in the
distribution of coffee including cold beverages as well as other beverages.
• Growth in the sector is influenced by both financial and social factors, like rises in average
annual average income, preferences for coffee shops across alternative social media, or rising
competitive pressures for coffee flavors and suppliers.
• The industry has expanded greatly during the last few years, guided by enhanced expectations,
as coffee cultivation became more popular amongst buyers
• Market revenues are expected to enhance from 2019-20 to about £6.6 billion at an exacerbated
annualized of 4.8 per cent over five years, plus 1.9 per operating profits over the present year.
• Multiple challenges are also facing the market, including the formation of more direct
replacement drinks turn leads to a decrease in national commitment to coffee.
• The greatest benefit for this industry is the expansion of its companies into separate companies
such as China, India, in which the workforce is massive (Boyle, 2013).
• The Caffe Nero Group, Costa Limited, Pret-A-Manger and others are businesses with either the
total market dominance across the UK in this economy.
Paraphrase This Document
Need a fresh take? Get an instant paraphrase of this document with our AI Paraphraser
• Increases in average wages will have a huge impact on the degree of productivity of the market
managers. Coffee houses and coffee company usually hire a relatively large variety of tight-paid
workers, and the labor costs are a significant percentage of net income by traders.
• Domestic cost of food and un-alcoholic drinks covers products bought from supermarkets,
cafes, and stores. Even though some of these expenditures benefit industries that compete with
the shops-coffee shops market, higher overall household consumption on these goods usually
suggests better opportunities for market businesses.
Part 2. Business Performance Analysis:
2.1 Analysis of profit and loss account statement
The P&L statement evaluation involves examining the various row components in a
document, and also monitoring patterns for similar line items over many periods. This approach
is being used to recognize a business's value systems as well as its ability to make money
(Huston, Finke and Smith, 2012). It helps to assess the degree of likelihood of a business over a
given time. This research helps to identify the projected success of the company and frames a
strategy with more credible and precise forecasts.
In this sense, Roast Ltd's revenue report review reveals that the company's turnover grew
from £2022000 to £2534000 (25.32 percent growth) between 2017 and 2018, while the
company's sales cost improved from £1505000 to £1990000 (32.23 percent growth) between
2017 and 2018. Operating profits for the Organization in 2018 was 60,000. Although production
costs rose from £466,000 in 2017 to £477,000 in 2018. At 2018 and 2017, Roast Ltd posted
annual profit of 127000 and 51000 suggesting an upward trend, separately. The gross net income
of the company in 2018 and 2017 was 81000 and 36000 accordingly, and indicates the relative
performance of the organization that will be enhanced.
Introduction of specific ratio will be beneficial for more successful review of the business's
P&L report. Ratio helps understand the success of the organization when examining main
relationships in one or even more segment income statements between various recorded objects
(Lee and Lee, 2015). Below are some ratios relevant to Roast Ltd's revenue-statement evaluation,
as adopts:
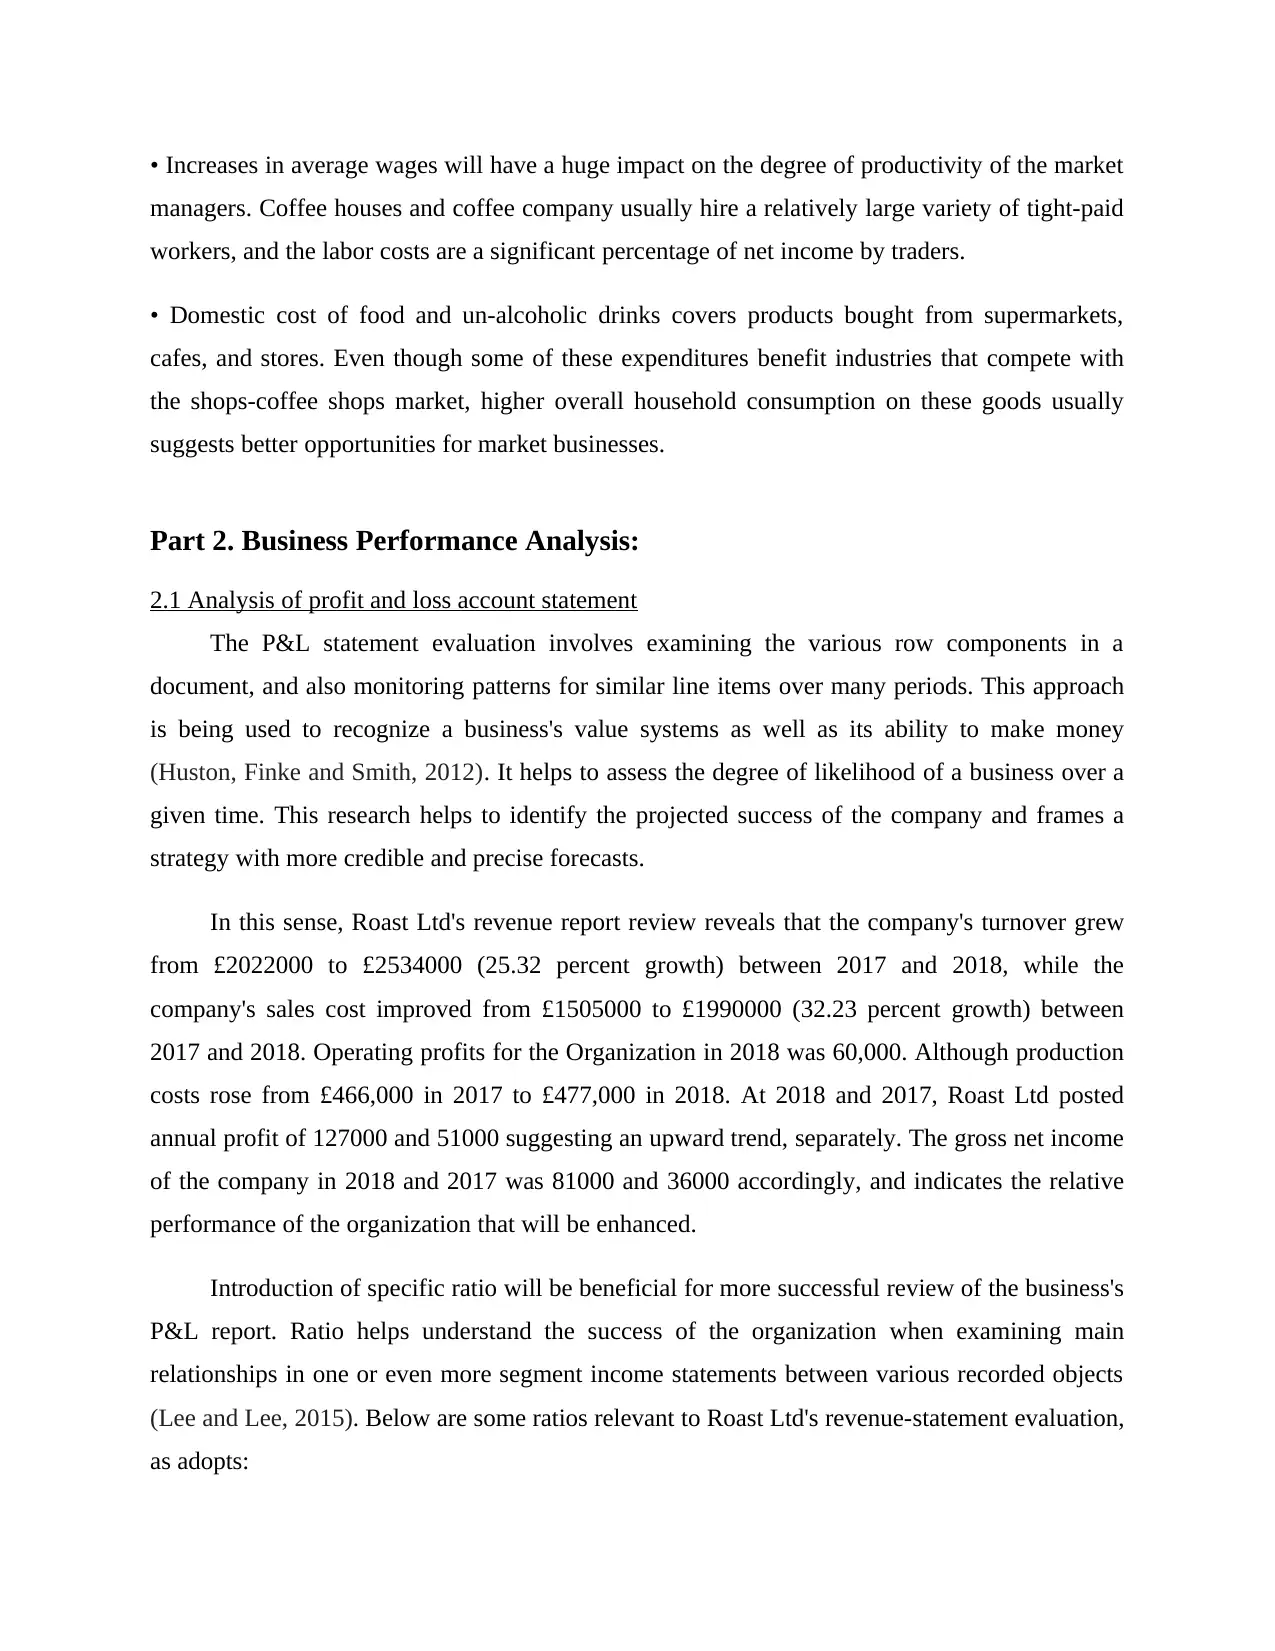
Gross Margin: This shows a particular share of the revenue that the business reported
after removing operating costs from the total retention. Under chart presents the gross margin
estimate of Roast Ltd as per the revenue and gross margin statistics published, as obeys:
(£'000) Year - 2017 Year - 2018
Gross profit 517 544
Net sales 2022 2534
Gross profit Margin = Gross
profit/ Net sales x 100
25.57% 21.47%
Review of the business's total margin(percent) shows that the gross margin company gained in
2018 was 21.47 percent, which in 2017 was 25.57 percent, suggesting a declining trend. It
ensures that the productivity of the corporation in providing total revenue has been decreased
before subtracting any operating or non-operating expenses.
Operating profit: This ratio covers gross income company gained since paying all of its
operating costs even before investment expenses and taxes. That supports to understand the
operational efficiency of an organization (Lusardi, 2012). The table below shows the operating
profit ratio of Roast Ltd for two years, as obeys:
(£'000) Year – 2017 Year - 2018
Operating profit 51 127
Net sales 2022 2534
Operating profit ratio=
Operating profit/ Net sales x
100
2.52% 5.01%
The operating ratio of the business in 2018 and 2017 is 5.01 percent and 2.52 percent,
pointing to a growing trend. Another pattern indicates that the company's capacity to produce
⊘ This is a preview!⊘
Do you want full access?
Subscribe today to unlock all pages.
Trusted by 1+ million students worldwide
income has been improved through its net cash. This also clearly means that the operating costs
of the company have been reduced and that total revenues have therefore improved.
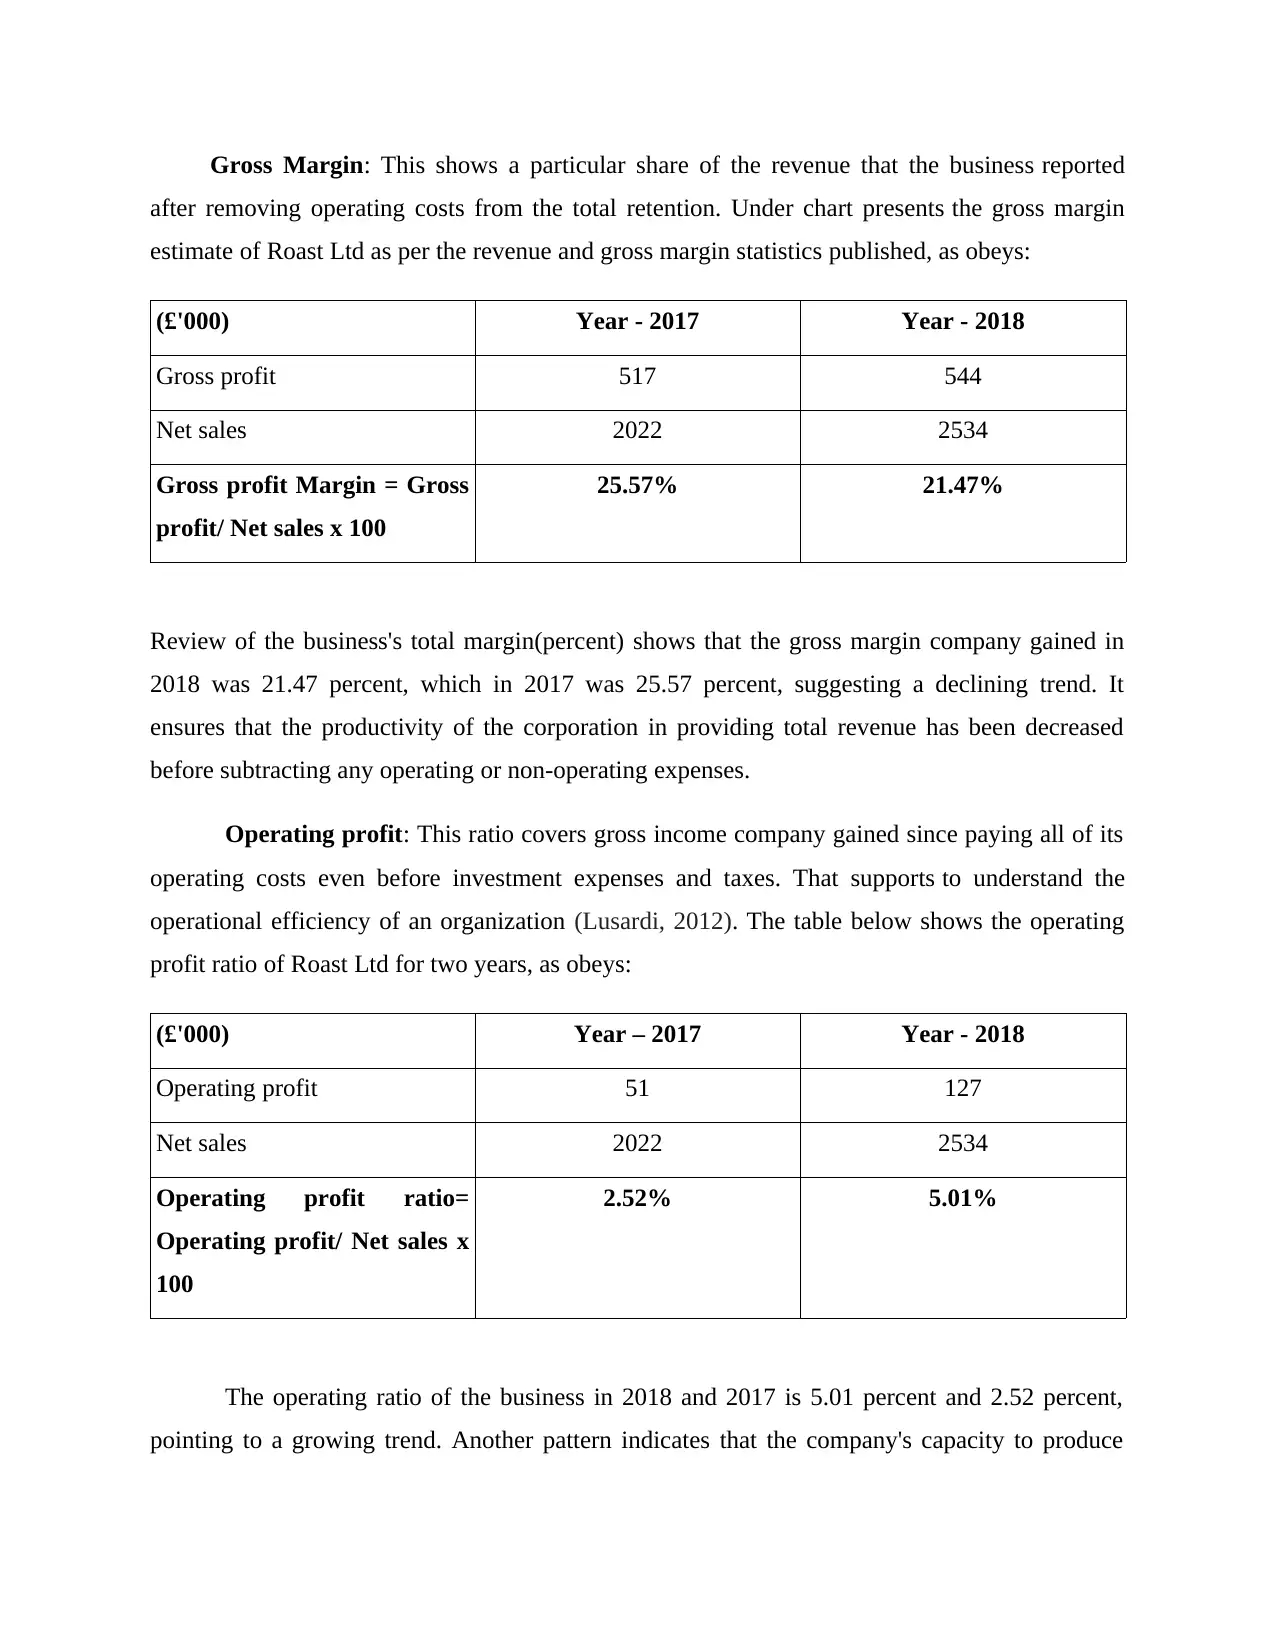
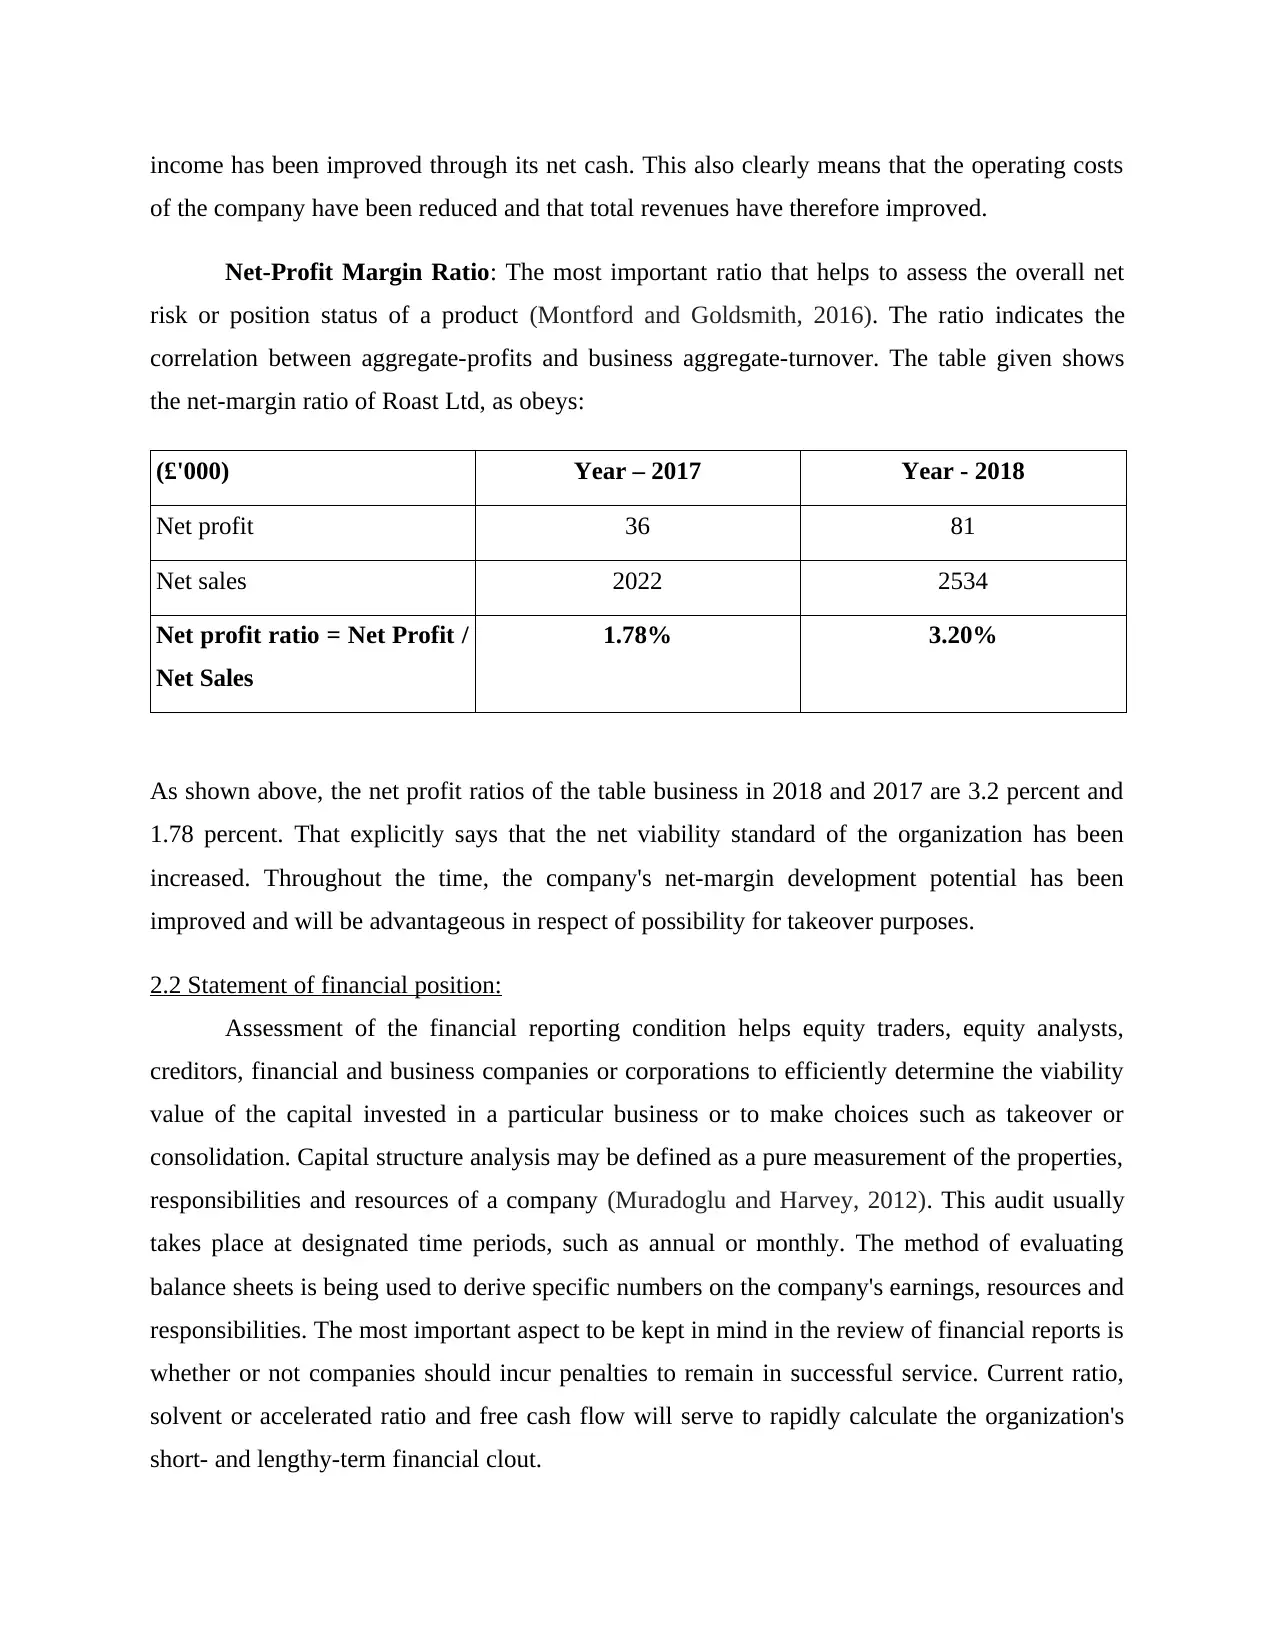
Net-Profit Margin Ratio: The most important ratio that helps to assess the overall net
risk or position status of a product (Montford and Goldsmith, 2016). The ratio indicates the
correlation between aggregate-profits and business aggregate-turnover. The table given shows
the net-margin ratio of Roast Ltd, as obeys:
(£'000) Year – 2017 Year - 2018
Net profit 36 81
Net sales 2022 2534
Net profit ratio = Net Profit /
Net Sales
1.78% 3.20%
As shown above, the net profit ratios of the table business in 2018 and 2017 are 3.2 percent and
1.78 percent. That explicitly says that the net viability standard of the organization has been
increased. Throughout the time, the company's net-margin development potential has been
improved and will be advantageous in respect of possibility for takeover purposes.
2.2 Statement of financial position:
Assessment of the financial reporting condition helps equity traders, equity analysts,
creditors, financial and business companies or corporations to efficiently determine the viability
value of the capital invested in a particular business or to make choices such as takeover or
consolidation. Capital structure analysis may be defined as a pure measurement of the properties,
responsibilities and resources of a company (Muradoglu and Harvey, 2012). This audit usually
takes place at designated time periods, such as annual or monthly. The method of evaluating
balance sheets is being used to derive specific numbers on the company's earnings, resources and
responsibilities. The most important aspect to be kept in mind in the review of financial reports is
whether or not companies should incur penalties to remain in successful service. Current ratio,
solvent or accelerated ratio and free cash flow will serve to rapidly calculate the organization's
short- and lengthy-term financial clout.
of the company have been reduced and that total revenues have therefore improved.
Net-Profit Margin Ratio: The most important ratio that helps to assess the overall net
risk or position status of a product (Montford and Goldsmith, 2016). The ratio indicates the
correlation between aggregate-profits and business aggregate-turnover. The table given shows
the net-margin ratio of Roast Ltd, as obeys:
(£'000) Year – 2017 Year - 2018
Net profit 36 81
Net sales 2022 2534
Net profit ratio = Net Profit /
Net Sales
1.78% 3.20%
As shown above, the net profit ratios of the table business in 2018 and 2017 are 3.2 percent and
1.78 percent. That explicitly says that the net viability standard of the organization has been
increased. Throughout the time, the company's net-margin development potential has been
improved and will be advantageous in respect of possibility for takeover purposes.
2.2 Statement of financial position:
Assessment of the financial reporting condition helps equity traders, equity analysts,
creditors, financial and business companies or corporations to efficiently determine the viability
value of the capital invested in a particular business or to make choices such as takeover or
consolidation. Capital structure analysis may be defined as a pure measurement of the properties,
responsibilities and resources of a company (Muradoglu and Harvey, 2012). This audit usually
takes place at designated time periods, such as annual or monthly. The method of evaluating
balance sheets is being used to derive specific numbers on the company's earnings, resources and
responsibilities. The most important aspect to be kept in mind in the review of financial reports is
whether or not companies should incur penalties to remain in successful service. Current ratio,
solvent or accelerated ratio and free cash flow will serve to rapidly calculate the organization's
short- and lengthy-term financial clout.
Paraphrase This Document
Need a fresh take? Get an instant paraphrase of this document with our AI Paraphraser
In this context, as a result of the review of the budget aspects mentioned in Roast Ltd's
Report of Financial Condition, the business produced capital spending on the acquisition of
Land, Plant or Equipment as the PPE valuation of the company was improved from £670,000 to
£996,000 between 2017 and 2018. One interesting point with this is that the money and
marketable securities of the business, which in 2017 was £134,000, were listed as zero in 2018,
indicating that the firm used all of its financial resources throughout 2018. Although current total
amount of wealth was achieved at £447,000 in 2017 which was £347,000. No shares were issued
by the business throughout 2018 as the stock equity of both years of the business is £200000. In
2018, the accumulated earnings of the net income or other capital business were registered at
£660,000, which was £579,000 in 2017. Hence cumulative stock funds are rising from £779000
to £860000.
Long-term interest payments of the business are rising dramatically, as lengthy-term
liabilities of the firm were exceeded at £275,000 in 2018, which was £100,000 in 2017. A
banking debit allowance of £73,000 was also purchased by the organization in 2018. Although
exchange stakeholders for the business were adjusted from 138000 to 235000 during most of the
2017-2018 timeframe. In the year 2017 to 2018, net debts were raised about £345000 (from
£238000 to £583000). In addition, many key factors are described in the study for better
explanation of the corresponding overall financial condition when considered significant budget
items of the financial statements.
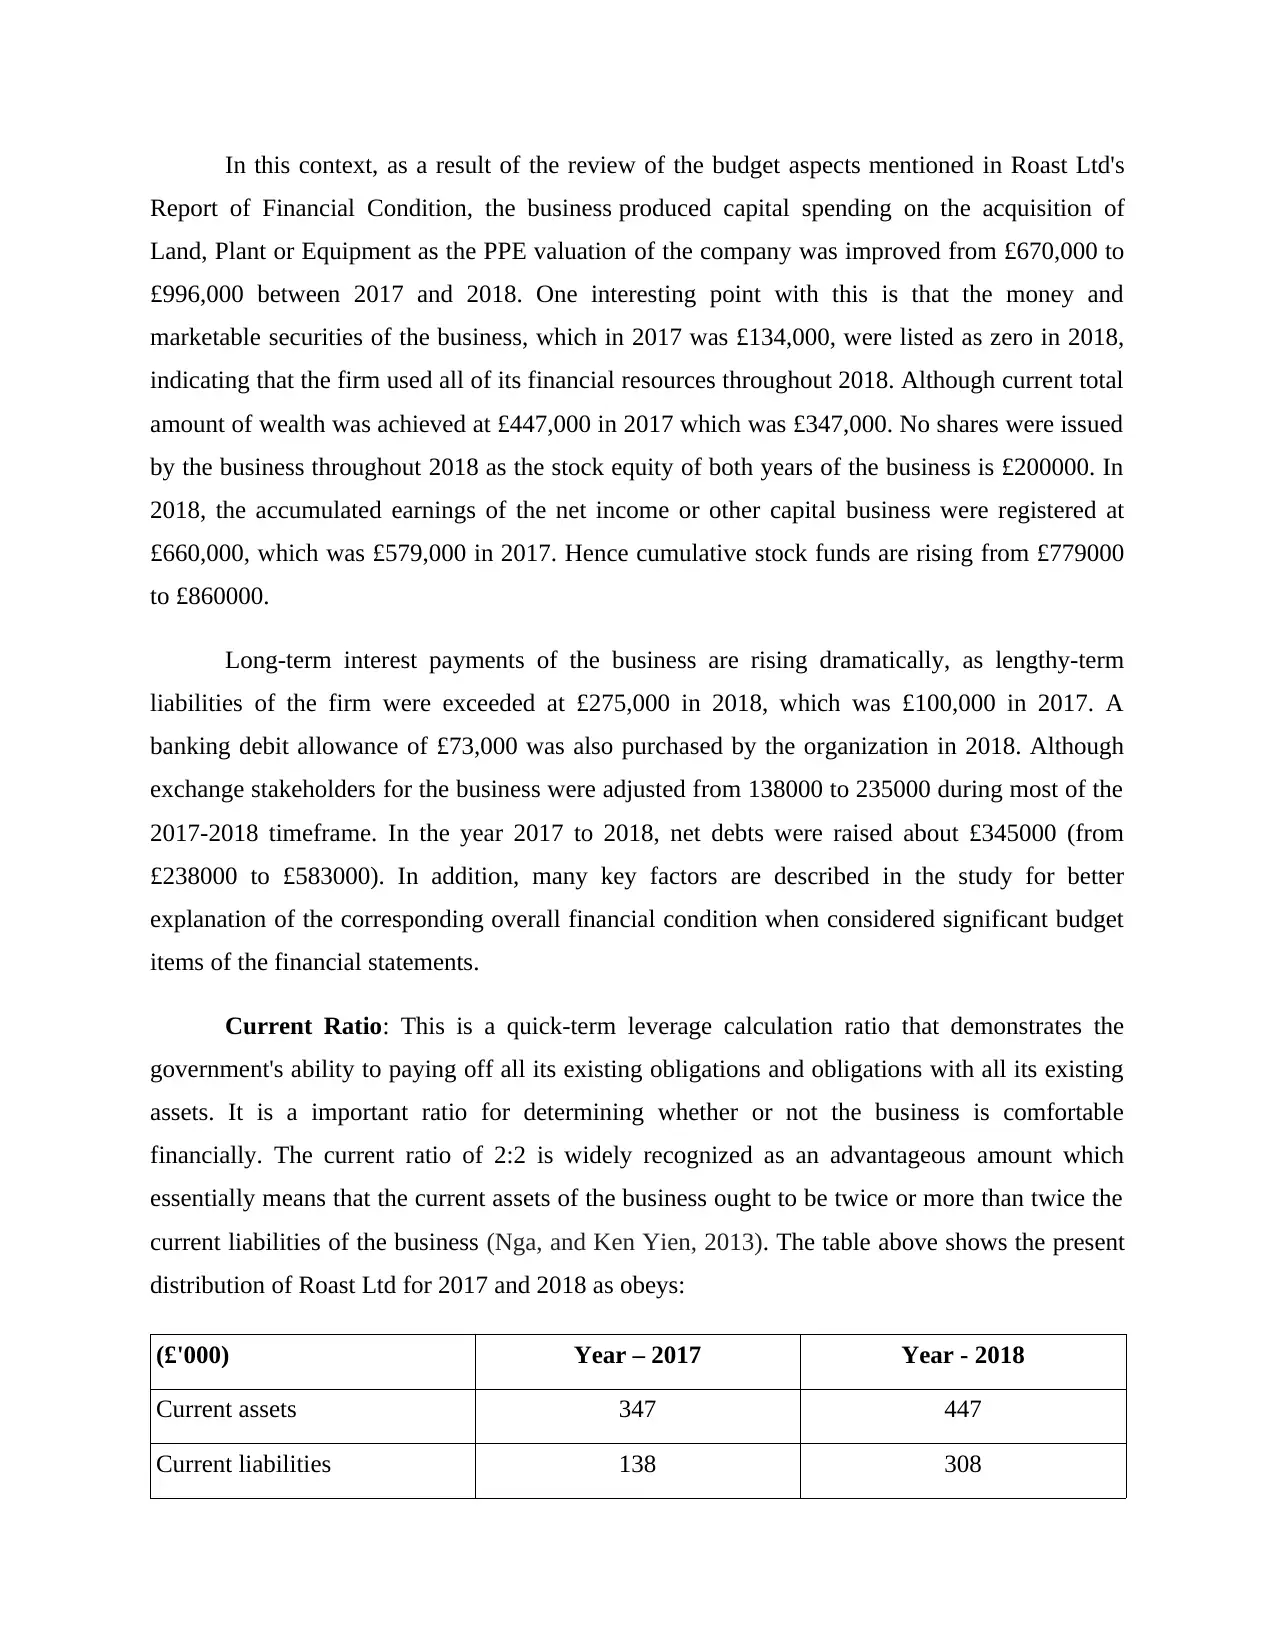
Current Ratio: This is a quick-term leverage calculation ratio that demonstrates the
government's ability to paying off all its existing obligations and obligations with all its existing
assets. It is a important ratio for determining whether or not the business is comfortable
financially. The current ratio of 2:2 is widely recognized as an advantageous amount which
essentially means that the current assets of the business ought to be twice or more than twice the
current liabilities of the business (Nga, and Ken Yien, 2013). The table above shows the present
distribution of Roast Ltd for 2017 and 2018 as obeys:
(£'000) Year – 2017 Year - 2018
Current assets 347 447
Current liabilities 138 308
Report of Financial Condition, the business produced capital spending on the acquisition of
Land, Plant or Equipment as the PPE valuation of the company was improved from £670,000 to
£996,000 between 2017 and 2018. One interesting point with this is that the money and
marketable securities of the business, which in 2017 was £134,000, were listed as zero in 2018,
indicating that the firm used all of its financial resources throughout 2018. Although current total
amount of wealth was achieved at £447,000 in 2017 which was £347,000. No shares were issued
by the business throughout 2018 as the stock equity of both years of the business is £200000. In
2018, the accumulated earnings of the net income or other capital business were registered at
£660,000, which was £579,000 in 2017. Hence cumulative stock funds are rising from £779000
to £860000.
Long-term interest payments of the business are rising dramatically, as lengthy-term
liabilities of the firm were exceeded at £275,000 in 2018, which was £100,000 in 2017. A
banking debit allowance of £73,000 was also purchased by the organization in 2018. Although
exchange stakeholders for the business were adjusted from 138000 to 235000 during most of the
2017-2018 timeframe. In the year 2017 to 2018, net debts were raised about £345000 (from
£238000 to £583000). In addition, many key factors are described in the study for better
explanation of the corresponding overall financial condition when considered significant budget
items of the financial statements.
Current Ratio: This is a quick-term leverage calculation ratio that demonstrates the
government's ability to paying off all its existing obligations and obligations with all its existing
assets. It is a important ratio for determining whether or not the business is comfortable
financially. The current ratio of 2:2 is widely recognized as an advantageous amount which
essentially means that the current assets of the business ought to be twice or more than twice the
current liabilities of the business (Nga, and Ken Yien, 2013). The table above shows the present
distribution of Roast Ltd for 2017 and 2018 as obeys:
(£'000) Year – 2017 Year - 2018
Current assets 347 447
Current liabilities 138 308
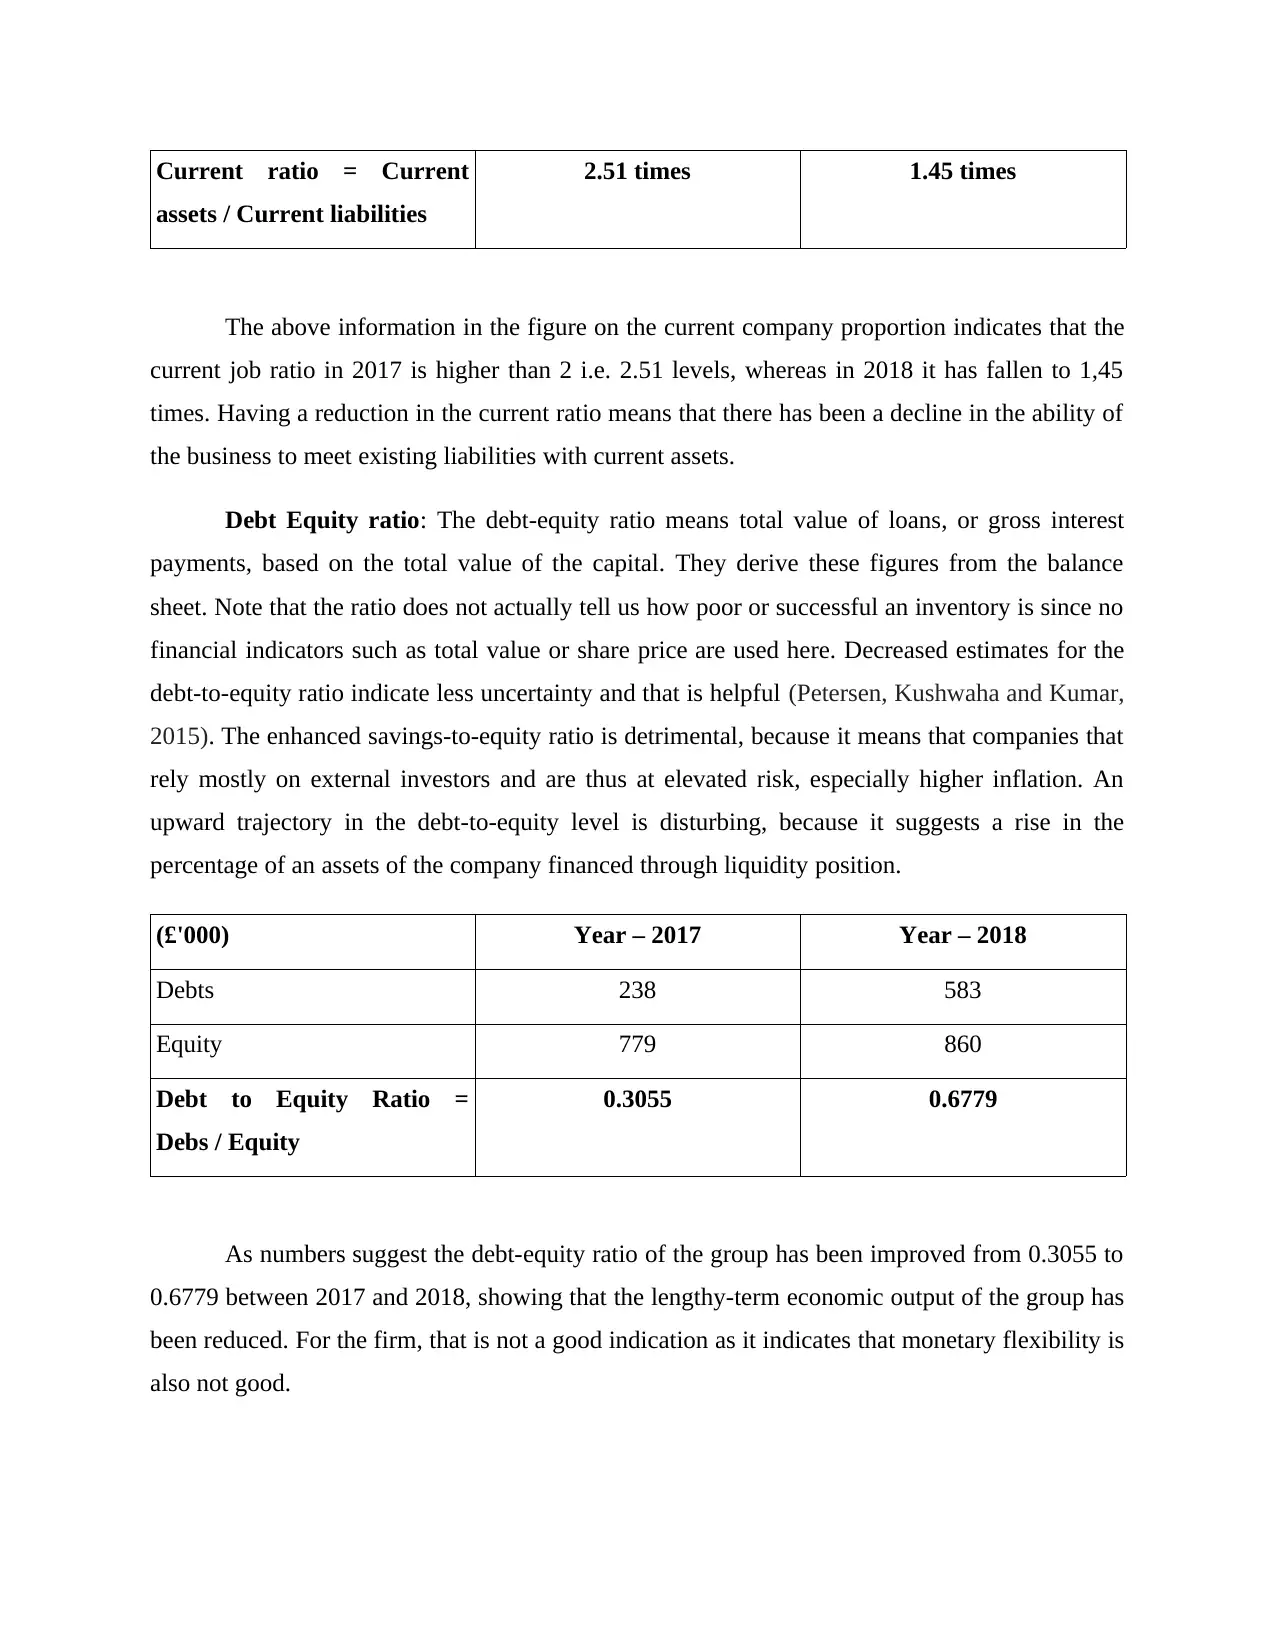
Current ratio = Current
assets / Current liabilities
2.51 times 1.45 times
The above information in the figure on the current company proportion indicates that the
current job ratio in 2017 is higher than 2 i.e. 2.51 levels, whereas in 2018 it has fallen to 1,45
times. Having a reduction in the current ratio means that there has been a decline in the ability of
the business to meet existing liabilities with current assets.
Debt Equity ratio: The debt-equity ratio means total value of loans, or gross interest
payments, based on the total value of the capital. They derive these figures from the balance
sheet. Note that the ratio does not actually tell us how poor or successful an inventory is since no
financial indicators such as total value or share price are used here. Decreased estimates for the
debt-to-equity ratio indicate less uncertainty and that is helpful (Petersen, Kushwaha and Kumar,
2015). The enhanced savings-to-equity ratio is detrimental, because it means that companies that
rely mostly on external investors and are thus at elevated risk, especially higher inflation. An
upward trajectory in the debt-to-equity level is disturbing, because it suggests a rise in the
percentage of an assets of the company financed through liquidity position.
(£'000) Year – 2017 Year – 2018
Debts 238 583
Equity 779 860
Debt to Equity Ratio =
Debs / Equity
0.3055 0.6779
As numbers suggest the debt-equity ratio of the group has been improved from 0.3055 to
0.6779 between 2017 and 2018, showing that the lengthy-term economic output of the group has
been reduced. For the firm, that is not a good indication as it indicates that monetary flexibility is
also not good.
⊘ This is a preview!⊘
Do you want full access?
Subscribe today to unlock all pages.
Trusted by 1+ million students worldwide
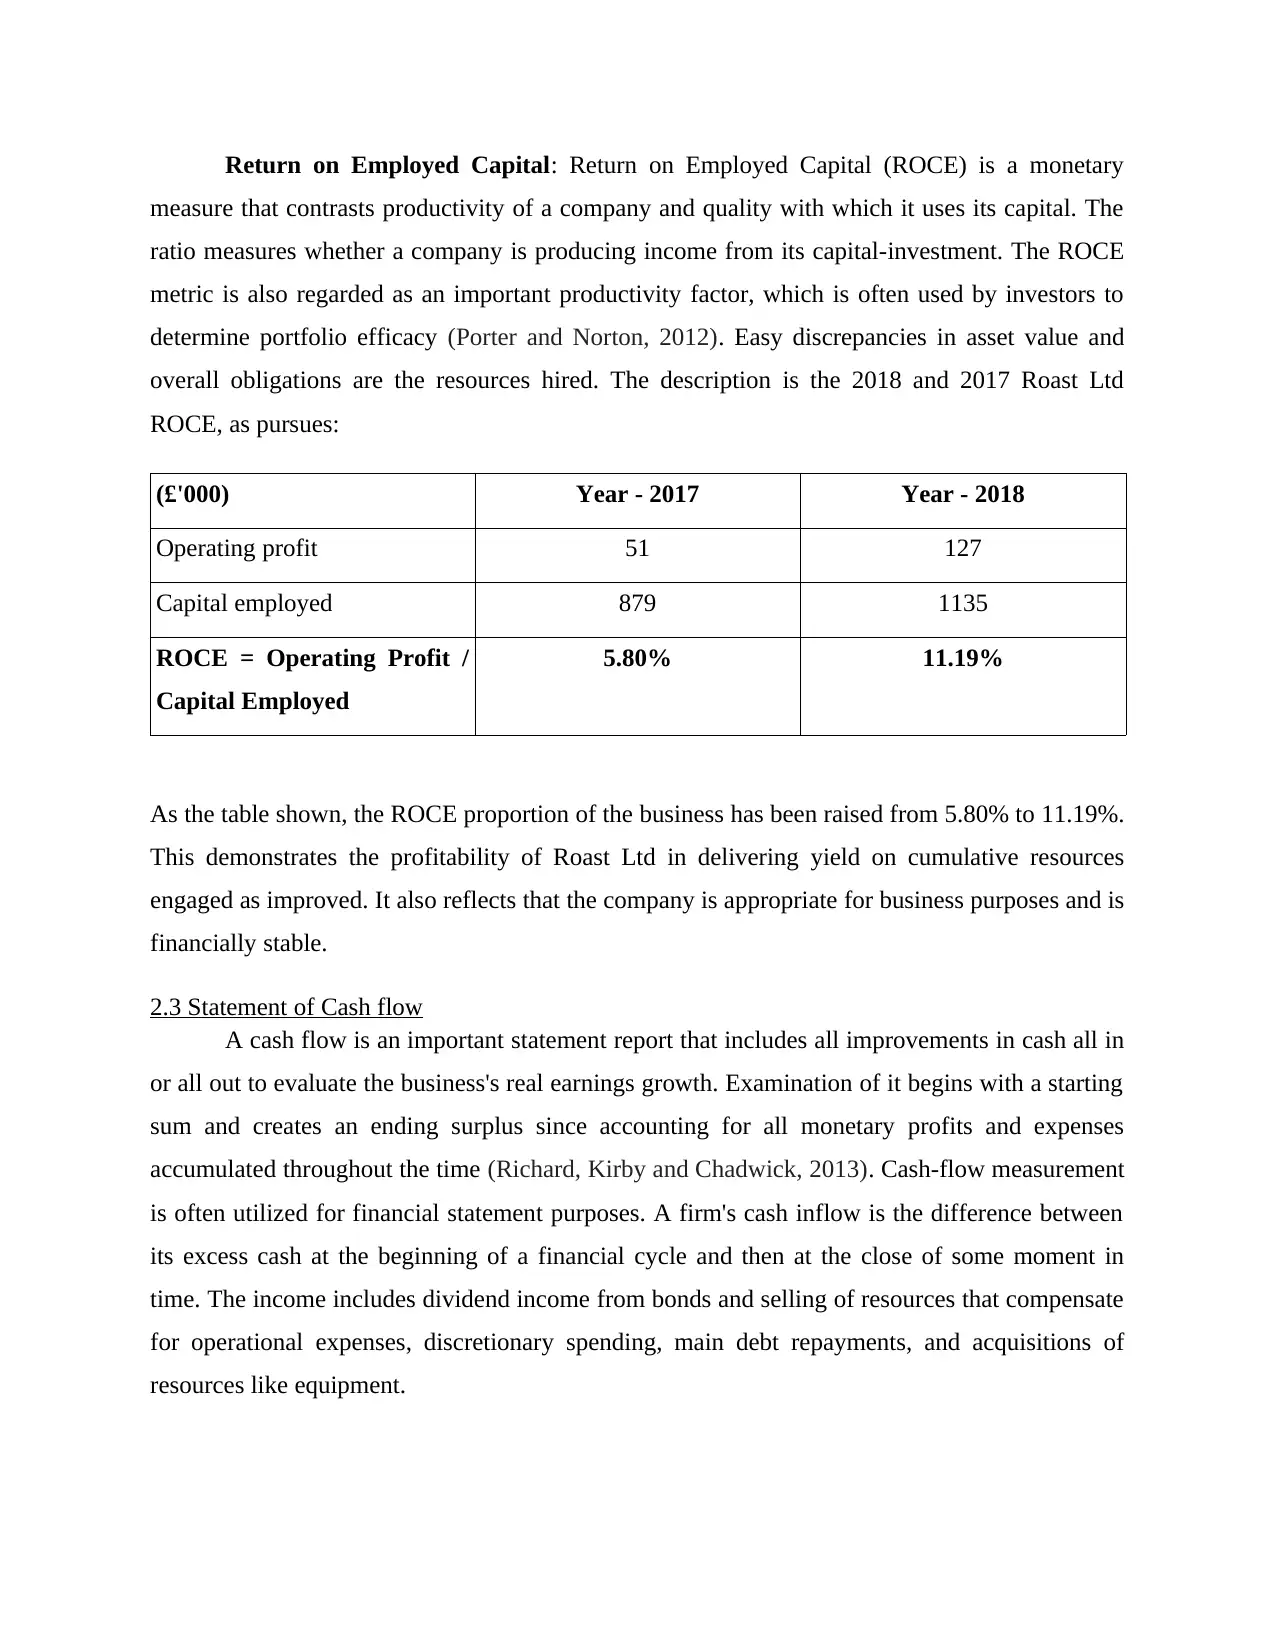
Return on Employed Capital: Return on Employed Capital (ROCE) is a monetary
measure that contrasts productivity of a company and quality with which it uses its capital. The
ratio measures whether a company is producing income from its capital-investment. The ROCE
metric is also regarded as an important productivity factor, which is often used by investors to
determine portfolio efficacy (Porter and Norton, 2012). Easy discrepancies in asset value and
overall obligations are the resources hired. The description is the 2018 and 2017 Roast Ltd
ROCE, as pursues:
(£'000) Year - 2017 Year - 2018
Operating profit 51 127
Capital employed 879 1135
ROCE = Operating Profit /
Capital Employed
5.80% 11.19%
As the table shown, the ROCE proportion of the business has been raised from 5.80% to 11.19%.
This demonstrates the profitability of Roast Ltd in delivering yield on cumulative resources
engaged as improved. It also reflects that the company is appropriate for business purposes and is
financially stable.
2.3 Statement of Cash flow
A cash flow is an important statement report that includes all improvements in cash all in
or all out to evaluate the business's real earnings growth. Examination of it begins with a starting
sum and creates an ending surplus since accounting for all monetary profits and expenses
accumulated throughout the time (Richard, Kirby and Chadwick, 2013). Cash-flow measurement
is often utilized for financial statement purposes. A firm's cash inflow is the difference between
its excess cash at the beginning of a financial cycle and then at the close of some moment in
time. The income includes dividend income from bonds and selling of resources that compensate
for operational expenses, discretionary spending, main debt repayments, and acquisitions of
resources like equipment.
Paraphrase This Document
Need a fresh take? Get an instant paraphrase of this document with our AI Paraphraser
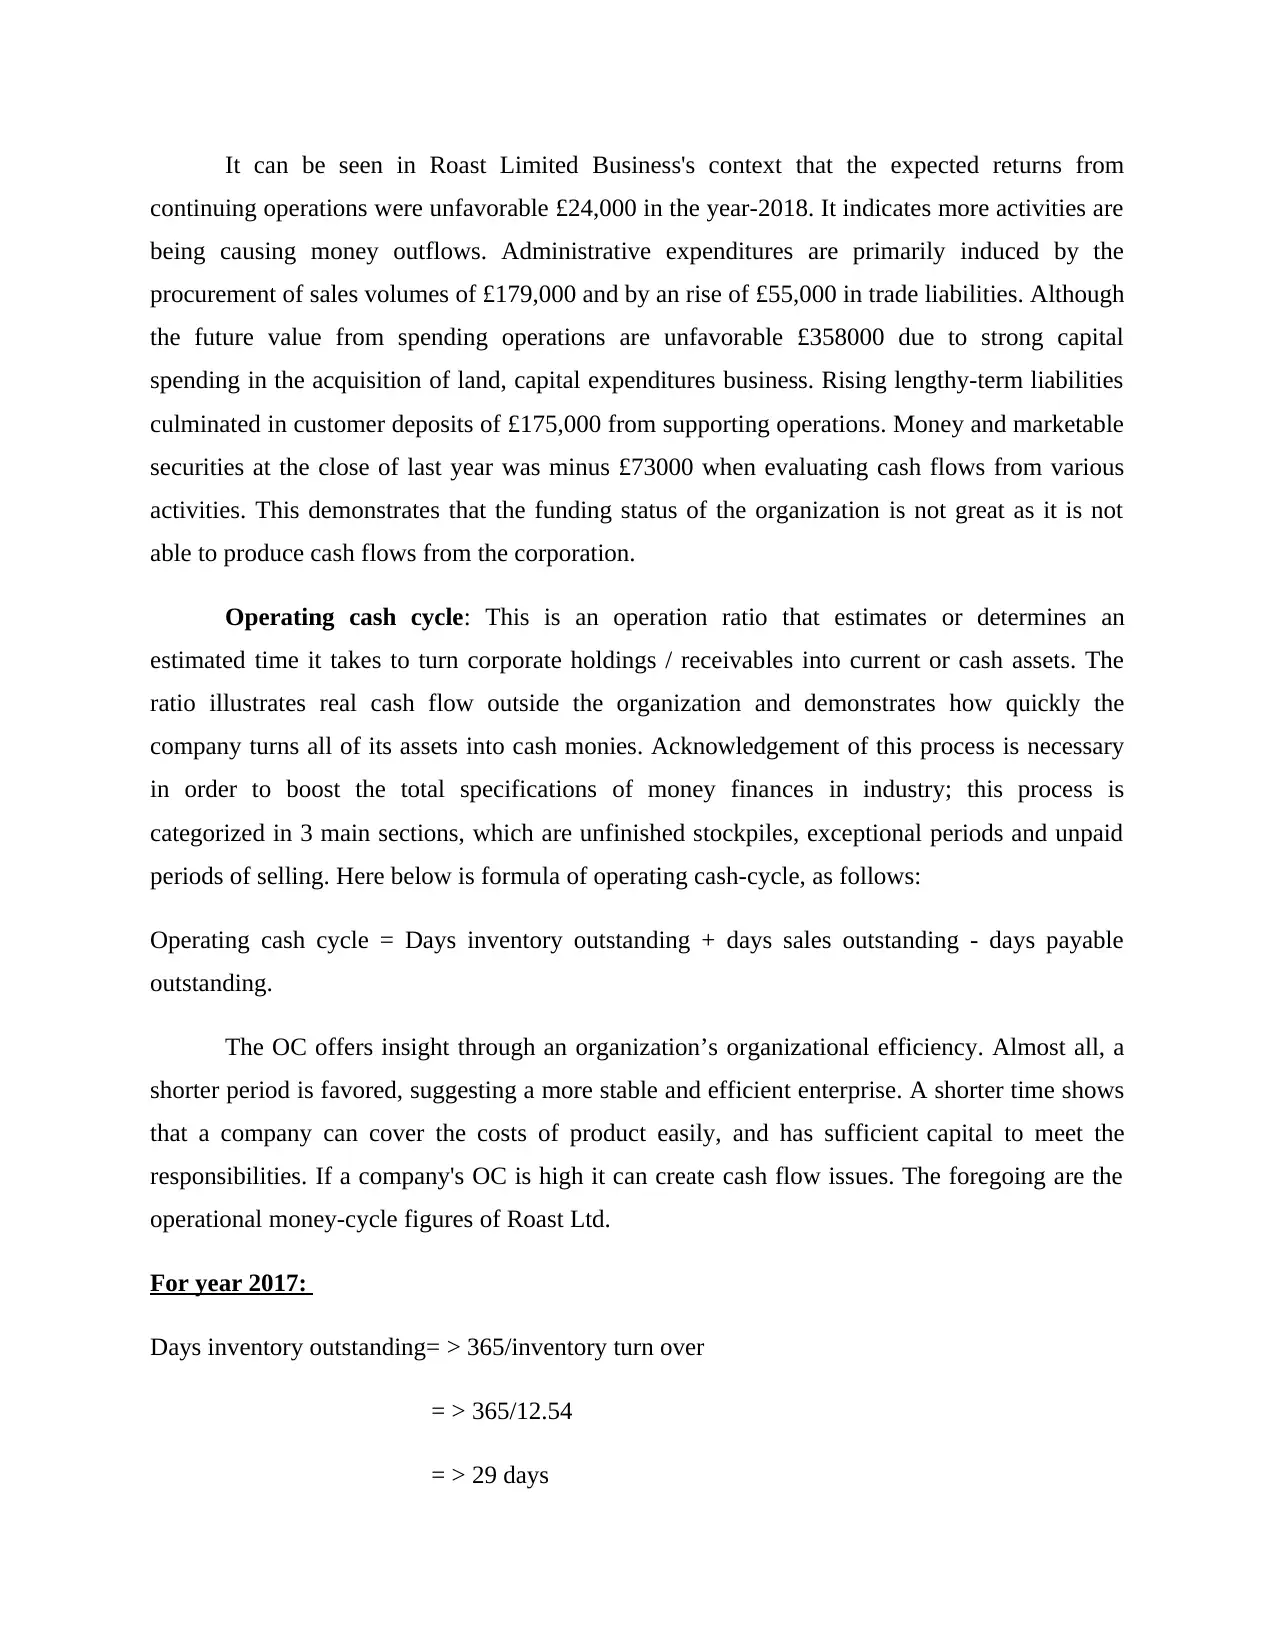
It can be seen in Roast Limited Business's context that the expected returns from
continuing operations were unfavorable £24,000 in the year-2018. It indicates more activities are
being causing money outflows. Administrative expenditures are primarily induced by the
procurement of sales volumes of £179,000 and by an rise of £55,000 in trade liabilities. Although
the future value from spending operations are unfavorable £358000 due to strong capital
spending in the acquisition of land, capital expenditures business. Rising lengthy-term liabilities
culminated in customer deposits of £175,000 from supporting operations. Money and marketable
securities at the close of last year was minus £73000 when evaluating cash flows from various
activities. This demonstrates that the funding status of the organization is not great as it is not
able to produce cash flows from the corporation.
Operating cash cycle: This is an operation ratio that estimates or determines an
estimated time it takes to turn corporate holdings / receivables into current or cash assets. The
ratio illustrates real cash flow outside the organization and demonstrates how quickly the
company turns all of its assets into cash monies. Acknowledgement of this process is necessary
in order to boost the total specifications of money finances in industry; this process is
categorized in 3 main sections, which are unfinished stockpiles, exceptional periods and unpaid
periods of selling. Here below is formula of operating cash-cycle, as follows:
Operating cash cycle = Days inventory outstanding + days sales outstanding - days payable
outstanding.
The OC offers insight through an organization’s organizational efficiency. Almost all, a
shorter period is favored, suggesting a more stable and efficient enterprise. A shorter time shows
that a company can cover the costs of product easily, and has sufficient capital to meet the
responsibilities. If a company's OC is high it can create cash flow issues. The foregoing are the
operational money-cycle figures of Roast Ltd.
For year 2017:
Days inventory outstanding= > 365/inventory turn over
= > 365/12.54
= > 29 days
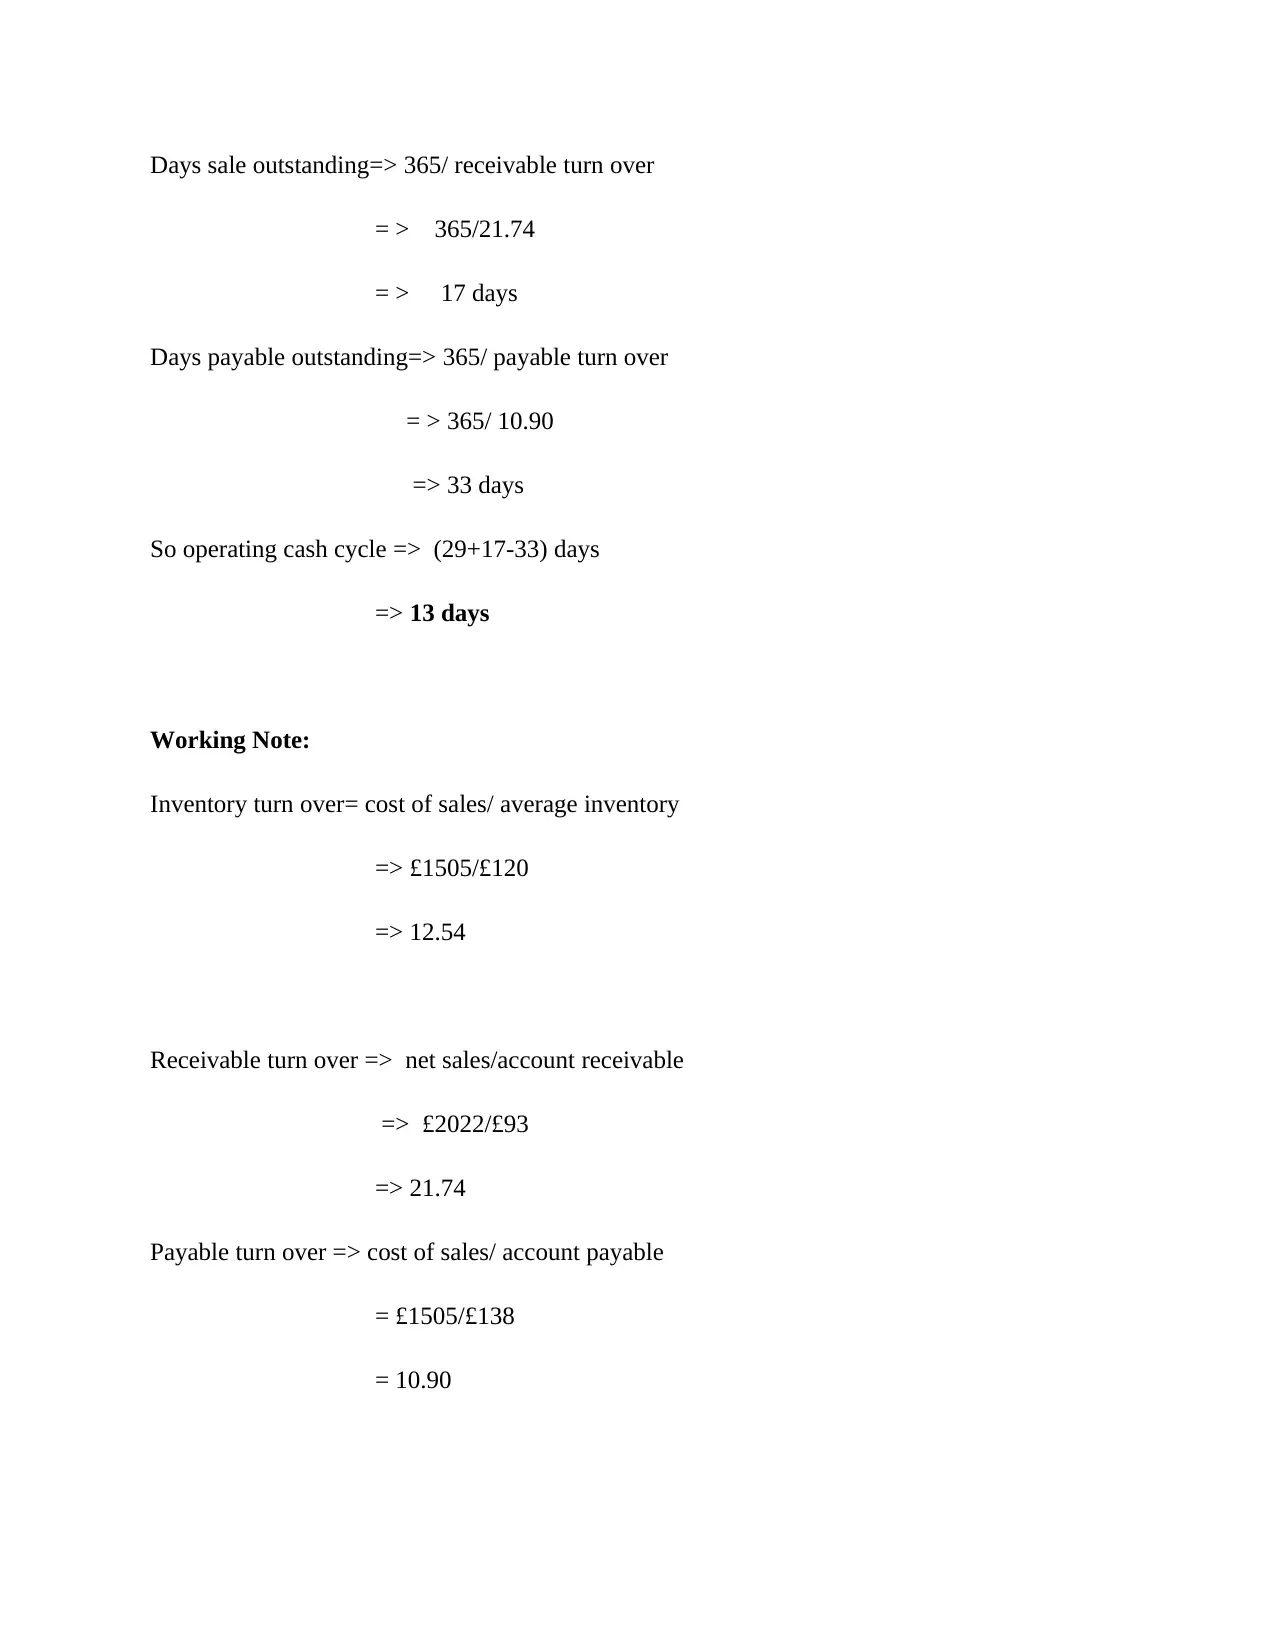
Days sale outstanding=> 365/ receivable turn over
= > 365/21.74
= > 17 days
Days payable outstanding=> 365/ payable turn over
= > 365/ 10.90
=> 33 days
So operating cash cycle => (29+17-33) days
=> 13 days
Working Note:
Inventory turn over= cost of sales/ average inventory
=> £1505/£120
=> 12.54
Receivable turn over => net sales/account receivable
=> £2022/£93
=> 21.74
Payable turn over => cost of sales/ account payable
= £1505/£138
= 10.90
⊘ This is a preview!⊘
Do you want full access?
Subscribe today to unlock all pages.
Trusted by 1+ million students worldwide
1 out of 18
Related Documents


Your All-in-One AI-Powered Toolkit for Academic Success.
+13062052269
info@desklib.com
Available 24*7 on WhatsApp / Email
![[object Object]](/_next/static/media/star-bottom.7253800d.svg)
Unlock your academic potential
Copyright © 2020–2026 A2Z Services. All Rights Reserved. Developed and managed by ZUCOL.