Financial Report: Analysis of Roast Ltd Business Performance
VerifiedAdded on 2023/01/16
|17
|4533
|23
Report
AI Summary
This report provides a comprehensive financial analysis of Roast Ltd, a coffee chain, to inform Starbucks' potential acquisition decision. It reviews the UK cafe-coffee industry, highlighting market competition and economic factors. The analysis includes profit and loss statements, financial position statements (balance sheets), and cash flow statements from 2017 to 2018. Key performance indicators such as gross profit margin, operating profit ratio, net profit margin, current ratio, and debt-to-equity ratio are calculated and interpreted. The report uses investment appraisal techniques like NPV and payback period to assess Roast Ltd's viability, considering various financing sources. The overall assessment suggests that acquiring Roast Ltd. could offer Starbucks a competitive advantage and higher returns.

Financial Decision Making
Paraphrase This Document
Need a fresh take? Get an instant paraphrase of this document with our AI Paraphraser
Table of Contents
EXECUSTIVE SUMMARY...........................................................................................................1
MAIN BODY...................................................................................................................................1
PART 1: Industry Review................................................................................................................1
PART 2: Analysis of business performance....................................................................................2
2.1 Profit and loss statement analysis.....................................................................................2
2.2 Analysis of financial position statement...........................................................................4
2.3 Analysis of cash flow statement.......................................................................................7
PART 3: Investment Appraisals ...................................................................................................10
3.1 Management Forecast and investment appraisal-technique...........................................10
3.2 Sources of finance..........................................................................................................11
REFERENCES..............................................................................................................................13
.......................................................................................................................................................14

⊘ This is a preview!⊘
Do you want full access?
Subscribe today to unlock all pages.
Trusted by 1+ million students worldwide
EXECUSTIVE SUMMARY
Financial decision-making is the concept that assist the management and different
stakeholders in relation to build decisions about investment, assets, liabilities, bond and equity
funds. Ratio analysis and other tools and techniques related to this have significant contribution
in effective decision making that resultant into attainment of high amount of return (Arnold,
2012). The current report is based upon the financial analysis of the organisation named as Roast
Ltd. It is a coffee chain and having significant operations at different locations of London. The
main aim of this report is to assist the management of Starbucks in relation to frame decision
making about acquisition of Roast Ltd. Analysis of different financial aspects of Roast Ltd is
undertaken in relation to build effective decisions such as profit and loss account, balance sheet
and cash flow statements. The tools and techniques used for further detailed analysis includes
determination of different ratios, NPV and pay-back period. From the overall analysis and
attainment of the results, suggested to the management of Starbucks that viable to acquire Roast
Ltd. This will definitely provides an opportunity to attain higher amount of returns along with
competitive advantage in market.
MAIN BODY
PART 1: Industry Review
This part includes the description about information related to cafe coffee industry in UK.
This has huge importance in determination of the level of competition in industry along with
market conditions (Current coffee house industry of United Kingdom, 2019). Success of any
individual organisation depends over the adherence of analysed results. Cafe-coffee industry is
provided below:
This includes the large number of competitors within this industry. Majorly are of them
are unlicensed. They have the operations in respect to the selling of coffee, cold drinks
and soft drinks.
The different number of factor that have the impact over the success of he industry
players includes economical and social conditions of nation. In segregation these includes
per capital income, household income, influence of social platforms, preferences of
consumers, demand of coffee etc.
1
Paraphrase This Document
Need a fresh take? Get an instant paraphrase of this document with our AI Paraphraser
Analysis of this industry depicts the strong growth of this sector. The reason behind such
positive change and trend includes high demand of coffee in market along development
of prominent economical and social culture (Correia, Dussault and Pontes, 2015).
The sales growth ascertained in this industry from the comparative analysis of the last
five year figures analysed that increases around with the rate of 4.8 percent. In the current
year the amount ascertained regarding the sales of coffee in this industry is about £6.6
Billion.
The number of challenges that have negative impact over the operations of the players
prevails in this industry. These includes availability of high number of substitutes, intense
competition, preference over consumption of healthy etc.
The emerging markets present in front of this industry to grow with continuous rate
includes China and India where trend starts about the consumption of coffee along with
presence of population in large number.
The main competitors present in the UK industry includes Cafe Nero, Costa and many
other. All these have significant of market share along with potential ability to attract new
consumers towards their products and services.
Ascertainment of any change in minimum wages have huge impact over the earning
capacity of the organisations prevails in this industry (Dinçer and Yüksel, 2018). This is
so because this will either increase their profit margin or decrease due to having direct
relation with cost of production.
PART 2: Analysis of business performance
2.1 Profit and loss statement analysis
Profit and loss account includes all the details about the financial transactions of the
organisation. At the end of the year, this help in determination of the profit and loss. Analysis of
this help in ascertainment of the information in respect to trends in between different elements.
The further elaborated contribution is that provides an opportunity to determine the cost structure
along with ability of resources to earn profits within specific period of time. It directly help the
management to made effective projects about future activities (Epstein, Buhovac and Yuthas,
2015).
2
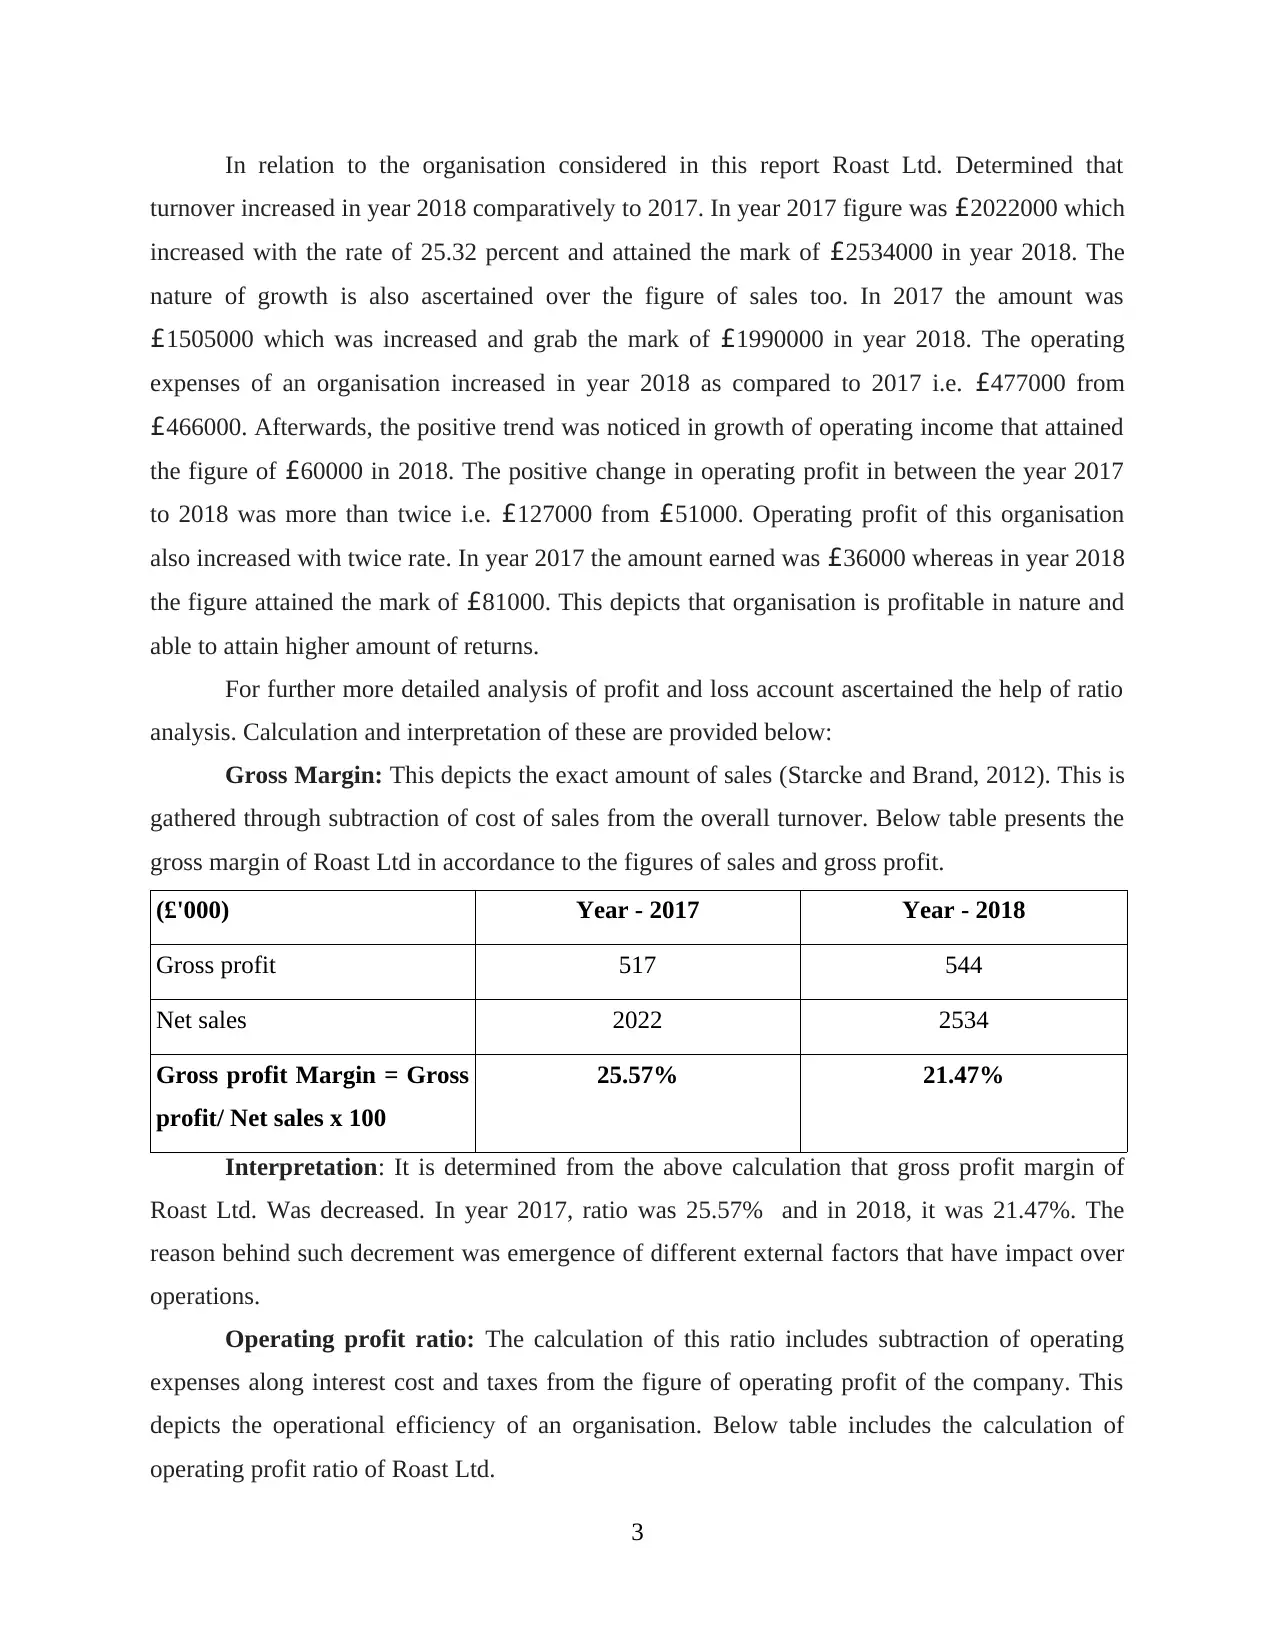
In relation to the organisation considered in this report Roast Ltd. Determined that
turnover increased in year 2018 comparatively to 2017. In year 2017 figure was £2022000 which
increased with the rate of 25.32 percent and attained the mark of £2534000 in year 2018. The
nature of growth is also ascertained over the figure of sales too. In 2017 the amount was
£1505000 which was increased and grab the mark of £1990000 in year 2018. The operating
expenses of an organisation increased in year 2018 as compared to 2017 i.e. £477000 from
£466000. Afterwards, the positive trend was noticed in growth of operating income that attained
the figure of £60000 in 2018. The positive change in operating profit in between the year 2017
to 2018 was more than twice i.e. £127000 from £51000. Operating profit of this organisation
also increased with twice rate. In year 2017 the amount earned was £36000 whereas in year 2018
the figure attained the mark of £81000. This depicts that organisation is profitable in nature and
able to attain higher amount of returns.
For further more detailed analysis of profit and loss account ascertained the help of ratio
analysis. Calculation and interpretation of these are provided below:
Gross Margin: This depicts the exact amount of sales (Starcke and Brand, 2012). This is
gathered through subtraction of cost of sales from the overall turnover. Below table presents the
gross margin of Roast Ltd in accordance to the figures of sales and gross profit.
(£'000) Year - 2017 Year - 2018
Gross profit 517 544
Net sales 2022 2534
Gross profit Margin = Gross
profit/ Net sales x 100
25.57% 21.47%
Interpretation: It is determined from the above calculation that gross profit margin of
Roast Ltd. Was decreased. In year 2017, ratio was 25.57% and in 2018, it was 21.47%. The
reason behind such decrement was emergence of different external factors that have impact over
operations.
Operating profit ratio: The calculation of this ratio includes subtraction of operating
expenses along interest cost and taxes from the figure of operating profit of the company. This
depicts the operational efficiency of an organisation. Below table includes the calculation of
operating profit ratio of Roast Ltd.
3
⊘ This is a preview!⊘
Do you want full access?
Subscribe today to unlock all pages.
Trusted by 1+ million students worldwide
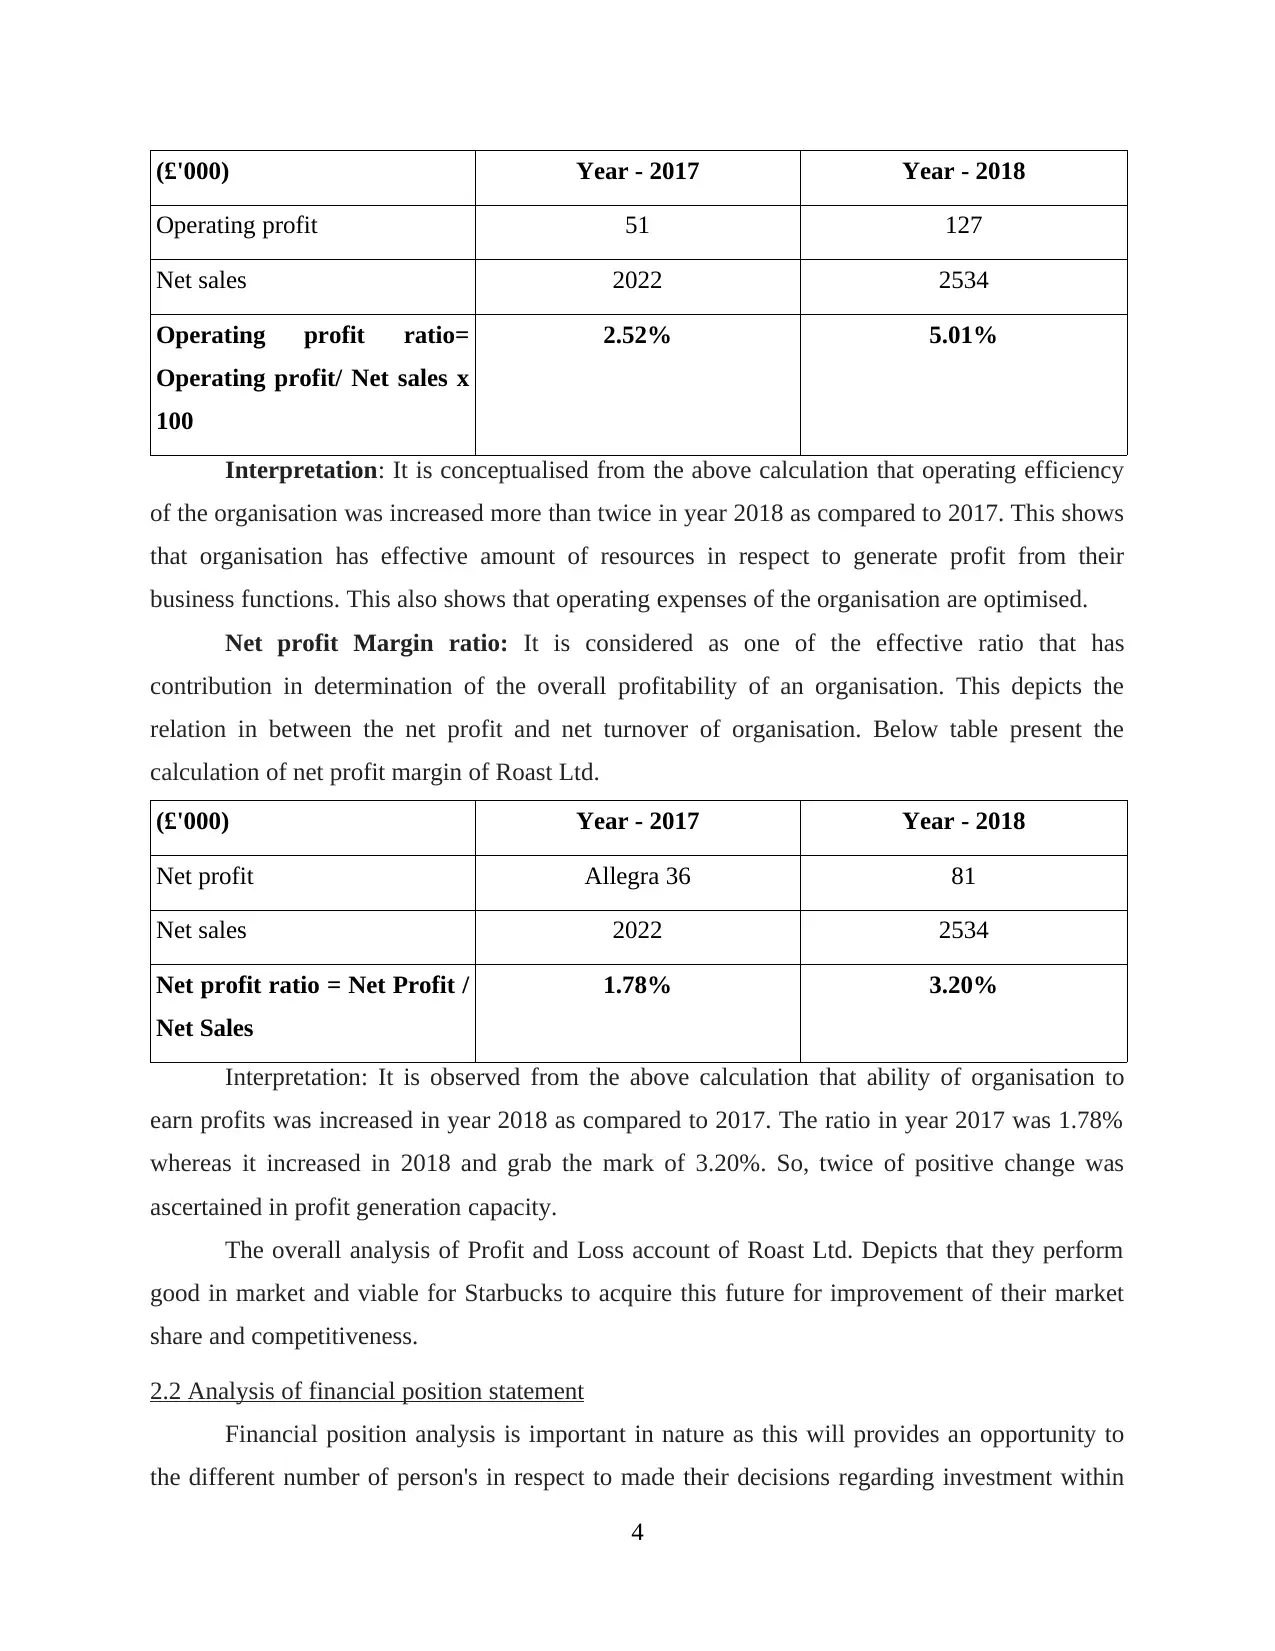
(£'000) Year - 2017 Year - 2018
Operating profit 51 127
Net sales 2022 2534
Operating profit ratio=
Operating profit/ Net sales x
100
2.52% 5.01%
Interpretation: It is conceptualised from the above calculation that operating efficiency
of the organisation was increased more than twice in year 2018 as compared to 2017. This shows
that organisation has effective amount of resources in respect to generate profit from their
business functions. This also shows that operating expenses of the organisation are optimised.
Net profit Margin ratio: It is considered as one of the effective ratio that has
contribution in determination of the overall profitability of an organisation. This depicts the
relation in between the net profit and net turnover of organisation. Below table present the
calculation of net profit margin of Roast Ltd.
(£'000) Year - 2017 Year - 2018
Net profit Allegra 36 81
Net sales 2022 2534
Net profit ratio = Net Profit /
Net Sales
1.78% 3.20%
Interpretation: It is observed from the above calculation that ability of organisation to
earn profits was increased in year 2018 as compared to 2017. The ratio in year 2017 was 1.78%
whereas it increased in 2018 and grab the mark of 3.20%. So, twice of positive change was
ascertained in profit generation capacity.
The overall analysis of Profit and Loss account of Roast Ltd. Depicts that they perform
good in market and viable for Starbucks to acquire this future for improvement of their market
share and competitiveness.
2.2 Analysis of financial position statement
Financial position analysis is important in nature as this will provides an opportunity to
the different number of person's in respect to made their decisions regarding investment within
4
Paraphrase This Document
Need a fresh take? Get an instant paraphrase of this document with our AI Paraphraser
an organisation. The different personnels that get benefited from this are named as investors,
brokers, creditors, banks, financial institutions etc. The document that depicts and important for
analysis to determine financial position of an organisation is Balance Sheet. This aid in
determination of the organisations assets, liabilities and capital. This kind of analysis can be done
on yearly and quarterly basis (Finke and Huston, 2014). It help in ascertainment of the actual
figure of profitability of organisation along with capacity to generate earnings. This also shows
the ability of the organisation to stand in market and pay off their liabilities. The ratios that
contributes in the determination of financial strength of an organisation are current, liquid and
working capital ratio.
In relation to the current report ascertained from the analysis of the balance sheet of
Roast Ltd that this organisation has made capital expenditure in relation to the purchase of
property, plant and equipments. This was shown from the increased amount in the balance-sheet
of 2018 compared to 2017 i.e. £996000 from £670000. The other aspect in respect to that
information is gathered includes cash and cash equivalents. In year 2017 the amount was
£134000 which was nil in year 2018. This means the whole amount is used by the organisation
during the current year for successful operation of business. The increment is also seen in the
current assets. The figure in 2017 was £347000 that increased and attained the mark of £447000
in year 2018. The share capital of this organisation was £200000. No dividend is paid out by the
organisation from their earnings to shareholders. The retailed earnings of the organisation was
also increased in the year 2018 as compared to 2017 i.e. £660000 from £579000. The increment
was visible in equity from £779000 to £860000.
The change is noticed in the liabilities part too where long term borrowings of company
are increased in year 2018 and attained the mark of £275000 whereas it was just £100000 in
2017. Th use of bank overdraft facility was also noticed in year 2018 i.e. £73000. The increment
also seen in the trade creditors of the organisation where amount in 2017 was £138000 and
increased in year 2018 to £235000. The overall increment seen in the liabilities section by
£34500 compared to 2017 and 2018.
Calculation of the ratios has effective contribution in the detailed analysis of the other
major aspects of the balance sheet (Finke, 2013). Usage of these ratios in respect to
determination of financial position of organisation along with calculation is presented below:
5
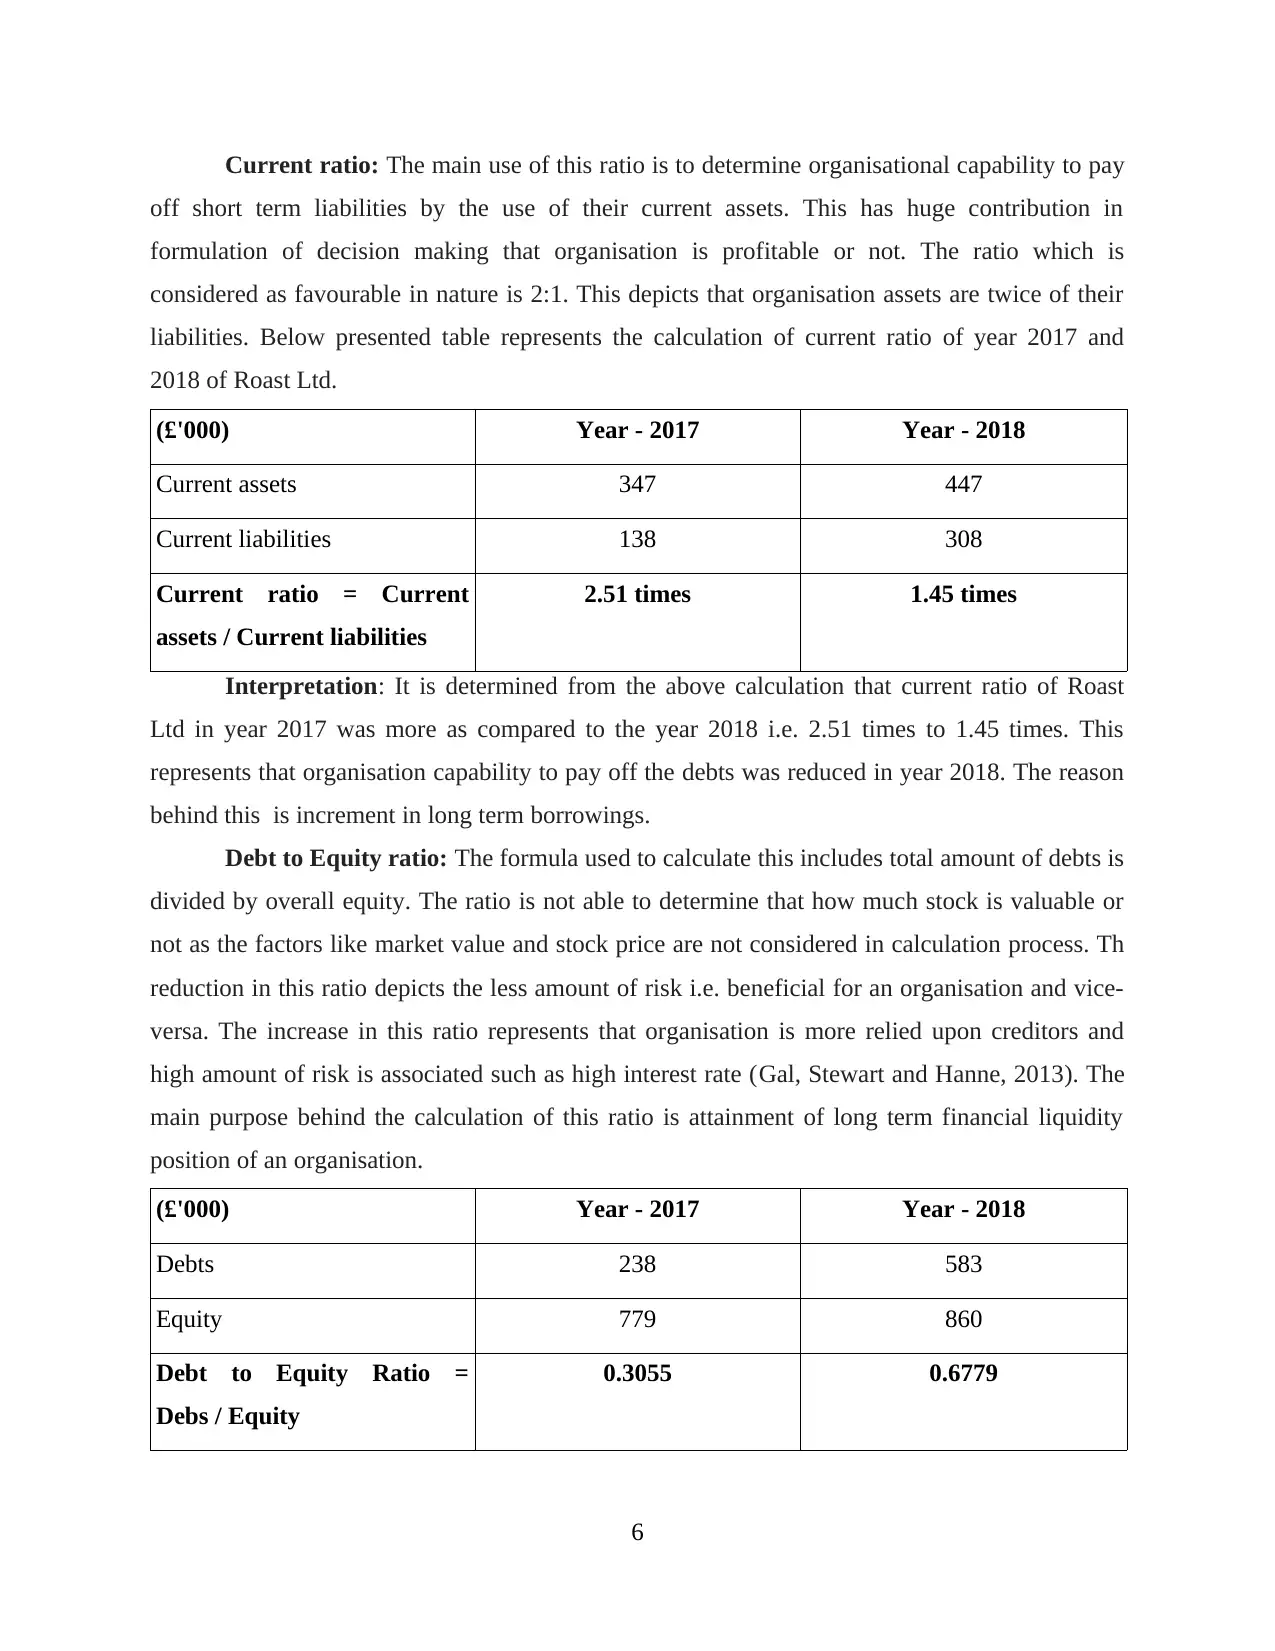
Current ratio: The main use of this ratio is to determine organisational capability to pay
off short term liabilities by the use of their current assets. This has huge contribution in
formulation of decision making that organisation is profitable or not. The ratio which is
considered as favourable in nature is 2:1. This depicts that organisation assets are twice of their
liabilities. Below presented table represents the calculation of current ratio of year 2017 and
2018 of Roast Ltd.
(£'000) Year - 2017 Year - 2018
Current assets 347 447
Current liabilities 138 308
Current ratio = Current
assets / Current liabilities
2.51 times 1.45 times
Interpretation: It is determined from the above calculation that current ratio of Roast
Ltd in year 2017 was more as compared to the year 2018 i.e. 2.51 times to 1.45 times. This
represents that organisation capability to pay off the debts was reduced in year 2018. The reason
behind this is increment in long term borrowings.
Debt to Equity ratio: The formula used to calculate this includes total amount of debts is
divided by overall equity. The ratio is not able to determine that how much stock is valuable or
not as the factors like market value and stock price are not considered in calculation process. Th
reduction in this ratio depicts the less amount of risk i.e. beneficial for an organisation and vice-
versa. The increase in this ratio represents that organisation is more relied upon creditors and
high amount of risk is associated such as high interest rate (Gal, Stewart and Hanne, 2013). The
main purpose behind the calculation of this ratio is attainment of long term financial liquidity
position of an organisation.
(£'000) Year - 2017 Year - 2018
Debts 238 583
Equity 779 860
Debt to Equity Ratio =
Debs / Equity
0.3055 0.6779
6
⊘ This is a preview!⊘
Do you want full access?
Subscribe today to unlock all pages.
Trusted by 1+ million students worldwide
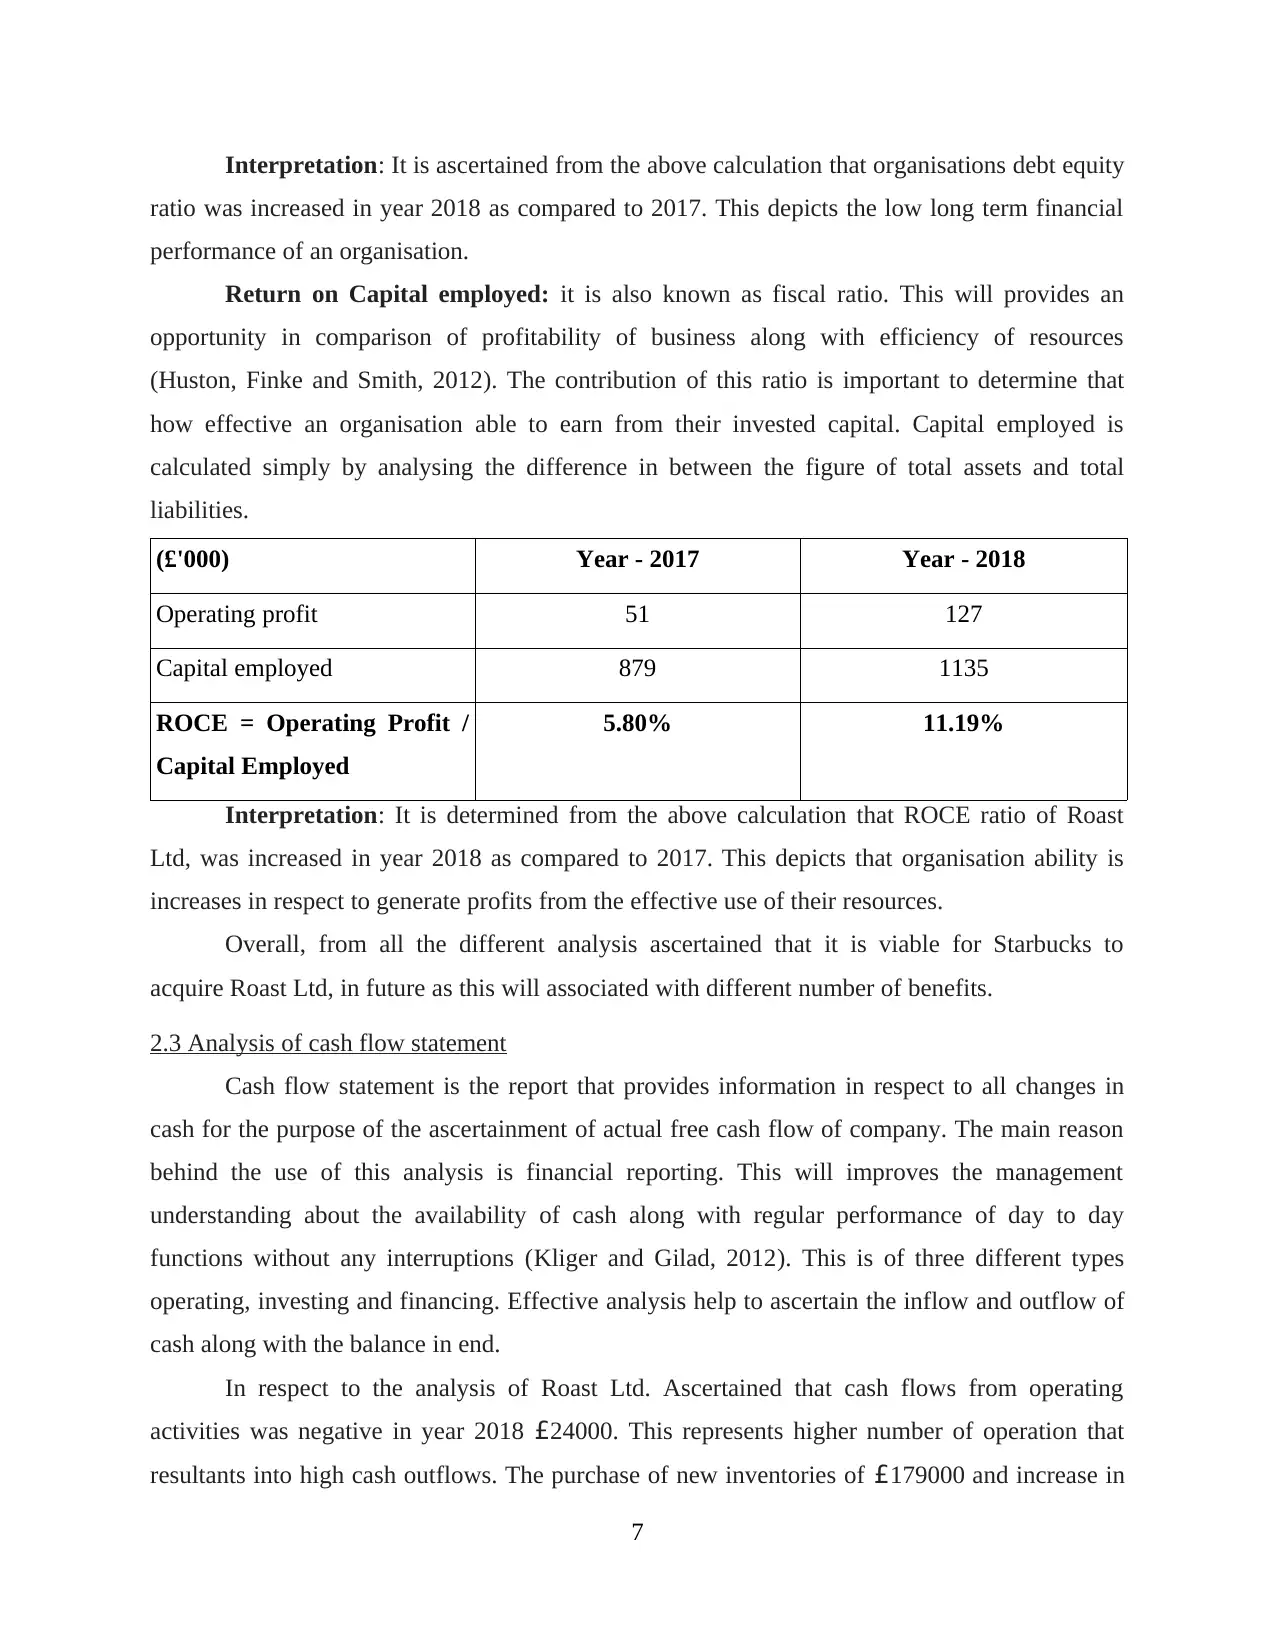
Interpretation: It is ascertained from the above calculation that organisations debt equity
ratio was increased in year 2018 as compared to 2017. This depicts the low long term financial
performance of an organisation.
Return on Capital employed: it is also known as fiscal ratio. This will provides an
opportunity in comparison of profitability of business along with efficiency of resources
(Huston, Finke and Smith, 2012). The contribution of this ratio is important to determine that
how effective an organisation able to earn from their invested capital. Capital employed is
calculated simply by analysing the difference in between the figure of total assets and total
liabilities.
(£'000) Year - 2017 Year - 2018
Operating profit 51 127
Capital employed 879 1135
ROCE = Operating Profit /
Capital Employed
5.80% 11.19%
Interpretation: It is determined from the above calculation that ROCE ratio of Roast
Ltd, was increased in year 2018 as compared to 2017. This depicts that organisation ability is
increases in respect to generate profits from the effective use of their resources.
Overall, from all the different analysis ascertained that it is viable for Starbucks to
acquire Roast Ltd, in future as this will associated with different number of benefits.
2.3 Analysis of cash flow statement
Cash flow statement is the report that provides information in respect to all changes in
cash for the purpose of the ascertainment of actual free cash flow of company. The main reason
behind the use of this analysis is financial reporting. This will improves the management
understanding about the availability of cash along with regular performance of day to day
functions without any interruptions (Kliger and Gilad, 2012). This is of three different types
operating, investing and financing. Effective analysis help to ascertain the inflow and outflow of
cash along with the balance in end.
In respect to the analysis of Roast Ltd. Ascertained that cash flows from operating
activities was negative in year 2018 £24000. This represents higher number of operation that
resultants into high cash outflows. The purchase of new inventories of £179000 and increase in
7
Paraphrase This Document
Need a fresh take? Get an instant paraphrase of this document with our AI Paraphraser
trade receivables by £55000 are the main outflow of cash. The cash flow from the investing
activities was negative £358000. The main reason behind the attainment of negative result
includes high amount of investment in the purchase of property and plant and equipments.
Financing activities depicts flow of cash due to increase in long term debts. The amount
ascertained was £175000. From the overall analysis determined at the end as cash and cash
equivalents was negative i.e. £73000. The represents that poor liquidity position of the
organisation as unable to generate cash from their business operations.
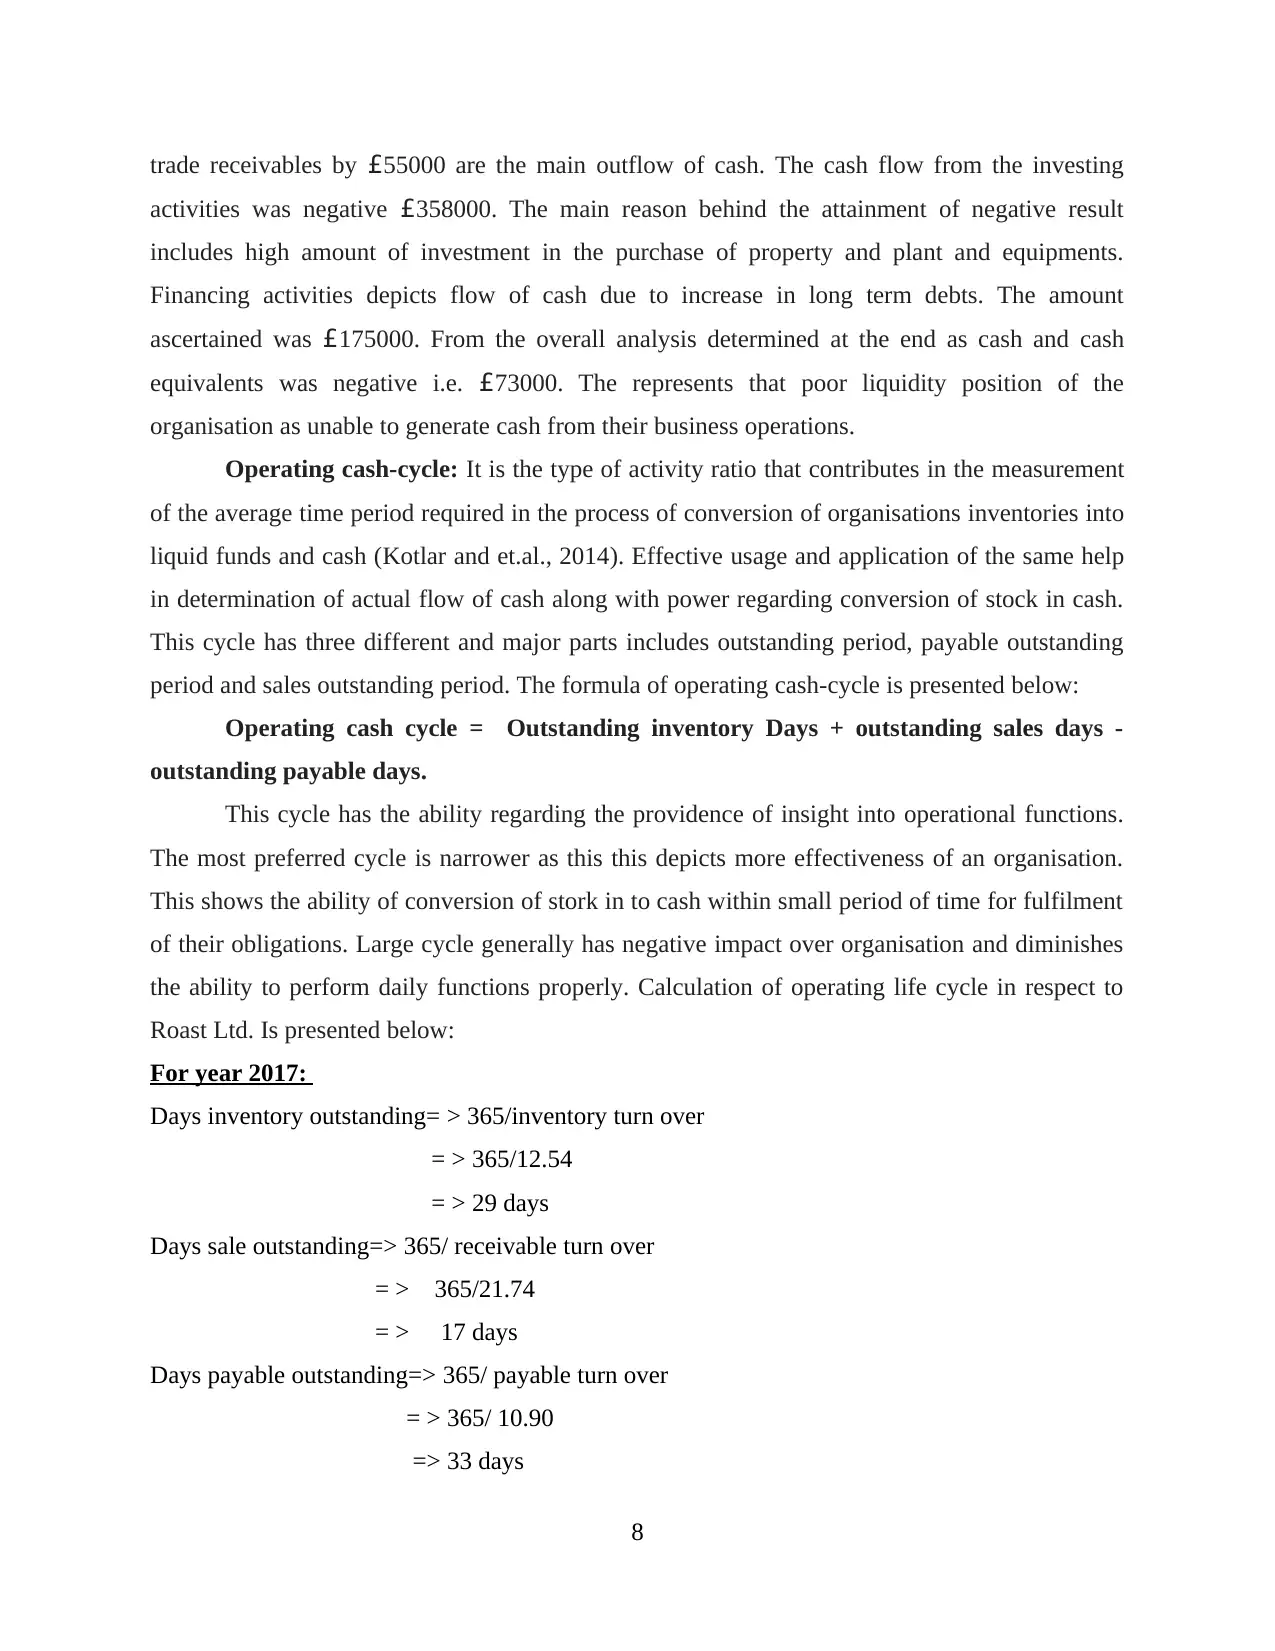
Operating cash-cycle: It is the type of activity ratio that contributes in the measurement
of the average time period required in the process of conversion of organisations inventories into
liquid funds and cash (Kotlar and et.al., 2014). Effective usage and application of the same help
in determination of actual flow of cash along with power regarding conversion of stock in cash.
This cycle has three different and major parts includes outstanding period, payable outstanding
period and sales outstanding period. The formula of operating cash-cycle is presented below:
Operating cash cycle = Outstanding inventory Days + outstanding sales days -
outstanding payable days.
This cycle has the ability regarding the providence of insight into operational functions.
The most preferred cycle is narrower as this this depicts more effectiveness of an organisation.
This shows the ability of conversion of stork in to cash within small period of time for fulfilment
of their obligations. Large cycle generally has negative impact over organisation and diminishes
the ability to perform daily functions properly. Calculation of operating life cycle in respect to
Roast Ltd. Is presented below:
For year 2017:
Days inventory outstanding= > 365/inventory turn over
= > 365/12.54
= > 29 days
Days sale outstanding=> 365/ receivable turn over
= > 365/21.74
= > 17 days
Days payable outstanding=> 365/ payable turn over
= > 365/ 10.90
=> 33 days
8
activities was negative £358000. The main reason behind the attainment of negative result
includes high amount of investment in the purchase of property and plant and equipments.
Financing activities depicts flow of cash due to increase in long term debts. The amount
ascertained was £175000. From the overall analysis determined at the end as cash and cash
equivalents was negative i.e. £73000. The represents that poor liquidity position of the
organisation as unable to generate cash from their business operations.
Operating cash-cycle: It is the type of activity ratio that contributes in the measurement
of the average time period required in the process of conversion of organisations inventories into
liquid funds and cash (Kotlar and et.al., 2014). Effective usage and application of the same help
in determination of actual flow of cash along with power regarding conversion of stock in cash.
This cycle has three different and major parts includes outstanding period, payable outstanding
period and sales outstanding period. The formula of operating cash-cycle is presented below:
Operating cash cycle = Outstanding inventory Days + outstanding sales days -
outstanding payable days.
This cycle has the ability regarding the providence of insight into operational functions.
The most preferred cycle is narrower as this this depicts more effectiveness of an organisation.
This shows the ability of conversion of stork in to cash within small period of time for fulfilment
of their obligations. Large cycle generally has negative impact over organisation and diminishes
the ability to perform daily functions properly. Calculation of operating life cycle in respect to
Roast Ltd. Is presented below:
For year 2017:
Days inventory outstanding= > 365/inventory turn over
= > 365/12.54
= > 29 days
Days sale outstanding=> 365/ receivable turn over
= > 365/21.74
= > 17 days
Days payable outstanding=> 365/ payable turn over
= > 365/ 10.90
=> 33 days
8
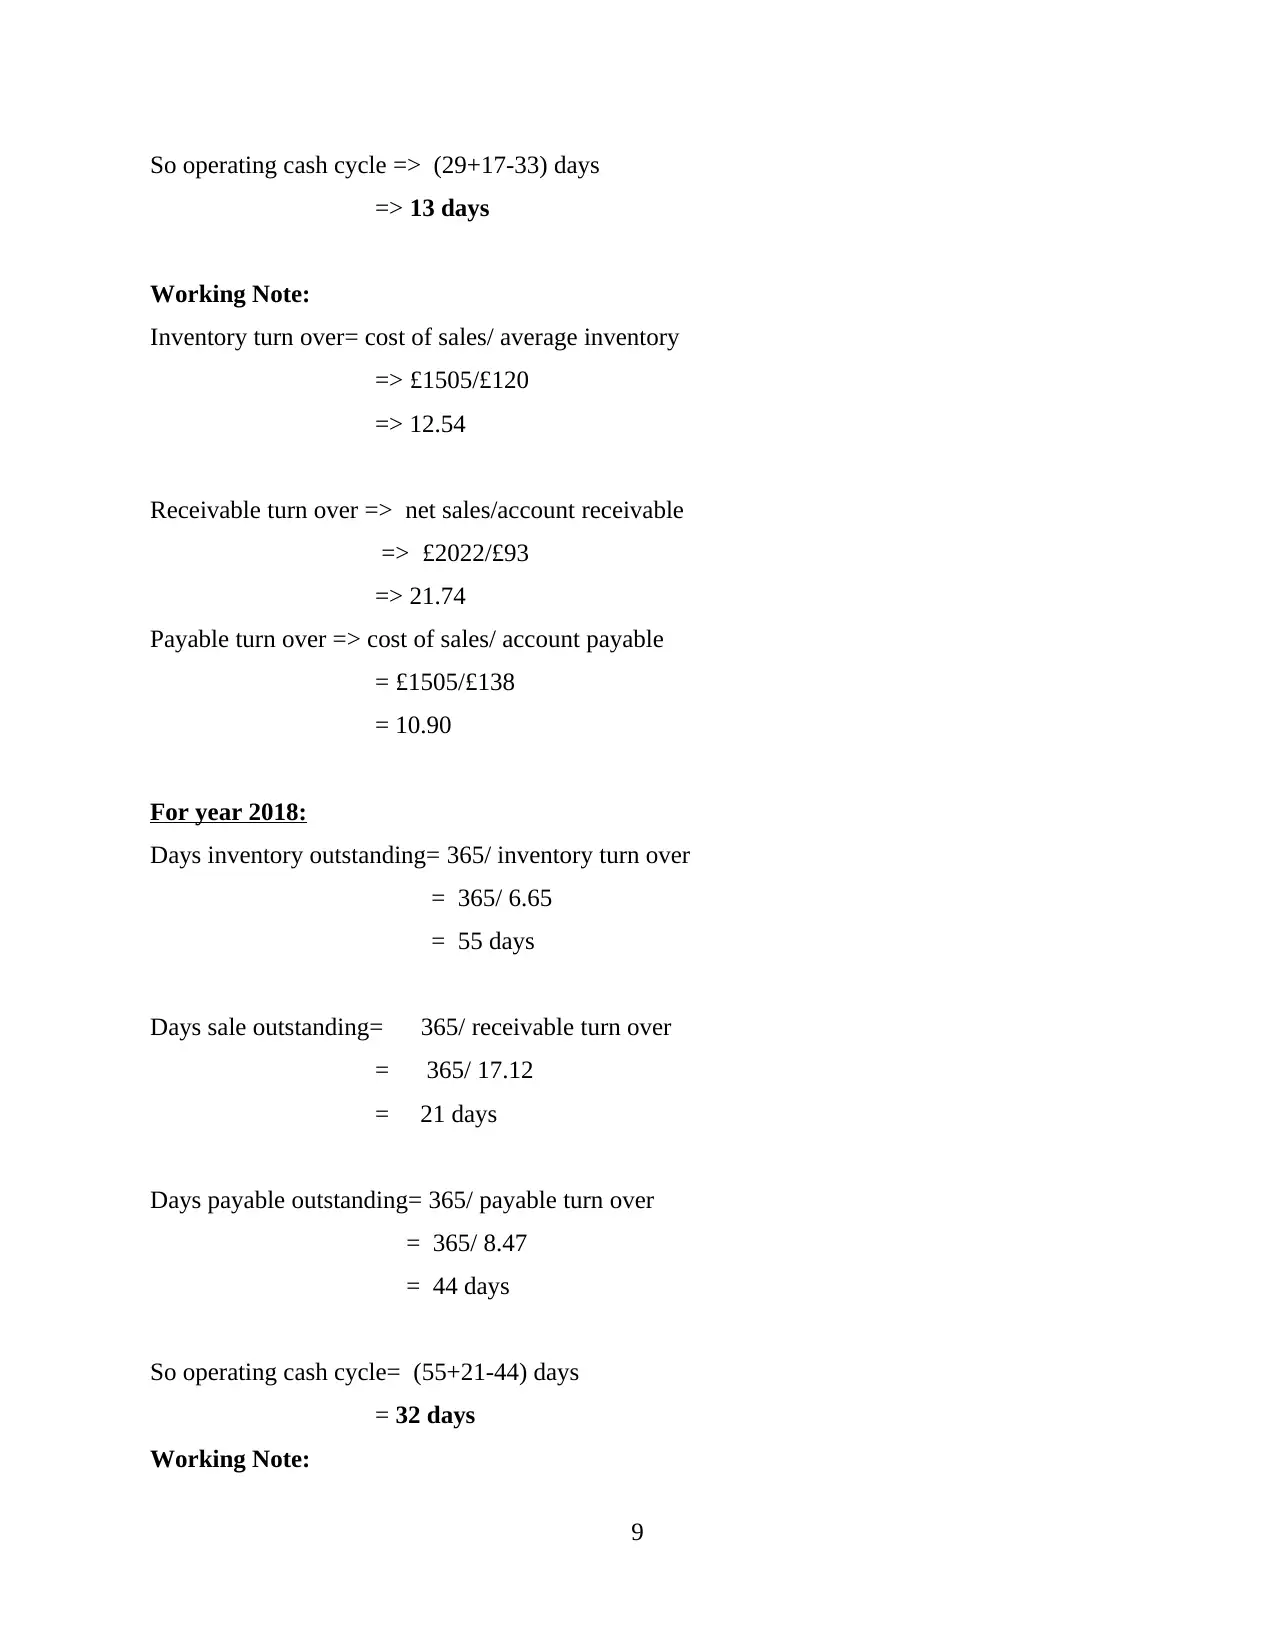
So operating cash cycle => (29+17-33) days
=> 13 days
Working Note:
Inventory turn over= cost of sales/ average inventory
=> £1505/£120
=> 12.54
Receivable turn over => net sales/account receivable
=> £2022/£93
=> 21.74
Payable turn over => cost of sales/ account payable
= £1505/£138
= 10.90
For year 2018:
Days inventory outstanding= 365/ inventory turn over
= 365/ 6.65
= 55 days
Days sale outstanding= 365/ receivable turn over
= 365/ 17.12
= 21 days
Days payable outstanding= 365/ payable turn over
= 365/ 8.47
= 44 days
So operating cash cycle= (55+21-44) days
= 32 days
Working Note:
9
⊘ This is a preview!⊘
Do you want full access?
Subscribe today to unlock all pages.
Trusted by 1+ million students worldwide
1 out of 17
Related Documents


Your All-in-One AI-Powered Toolkit for Academic Success.
+13062052269
info@desklib.com
Available 24*7 on WhatsApp / Email
![[object Object]](/_next/static/media/star-bottom.7253800d.svg)
Unlock your academic potential
Copyright © 2020–2026 A2Z Services. All Rights Reserved. Developed and managed by ZUCOL.