Financial Performance Analysis of Royal Mail Plc - Level 5 SBLC5005
VerifiedAdded on 2023/05/27
|15
|3714
|208
Report
AI Summary
This report provides a detailed financial analysis of Royal Mail Plc from 2014 to 2018, utilizing ratio analysis to assess the company's profitability, liquidity, efficiency, and solvency. Key financial ratios such as net profit margin, return on equity, current ratio, and quick ratio are examined to evaluate the company's financial health and performance trends over the five-year period. The analysis also includes a review of the company's working capital management, capital structure, and stock price trends, offering insights into its ability to generate income, manage short-term obligations, and leverage assets. The report concludes with an assessment of the overall financial vitality of Royal Mail Plc, providing stakeholders with information to make informed investment decisions. Desklib offers a platform for students to find similar reports and past papers.

23 December 2018
Financial Management Analysis
Royal Mail Plc.
Financial Management Analysis
Royal Mail Plc.
Paraphrase This Document
Need a fresh take? Get an instant paraphrase of this document with our AI Paraphraser
REPORT 1
Table of Contents
Introduction................................................................................................................................2
Analysis of Financial Statements: Theoretical Framework.......................................................2
Analysis of Financial Statements: Practical Application...........................................................3
Ratio Analysis........................................................................................................................3
Profitability........................................................................................................................3
Liquidity.............................................................................................................................5
Efficiency or the Working Capital Management...............................................................6
Solvency.............................................................................................................................7
General Financial Data and Stock Price Analysis..................................................................8
Conclusion..................................................................................................................................9
References................................................................................................................................10
REPORT 2
Introduction
The accounting regulating organisations of various nations cast a duty of the management of
an entity to prepare and present the financial statements of an entity, which represent a true
and fair view of the affairs of the entity. The fair and transparent representation assists the
stakeholders and experts to arrive at meaningful business and other decisions (Fabozzi and
Drake, 2009). The following report is aimed at analysing the financial performance of the
entity Royal Mail Plc. The company Royal Mail Plc. is engaged in the business of postal
services and courier services in the UK. The shares of the entity are listed on the London
Stock Exchange. The company belongs to the Integrated Shipping & Logistics industry. The
company operates its business through a number of subsidiaries such as Royal Mail Group
Limited and the General Logistics Systems. The report will make use of the various ratios to
analyse the financial performance of the entity over the period of five years, i.e. the financial
years starting from year 20145 to 2018. The report is further aimed at analysing the trends in
the stock market of the share prices of the said entity. This would be followed by the
conclusion as to whether it is vital to invest in the entity on the basis of the financial health of
the company.
Analysis of Financial Statements: Theoretical Framework
As prescribed in the US GAAP framework formulated by the regulators, financial statements
are prepared with the intention to serve the various stakeholders. It must further be noted that
these statements must be in the comparative format in order to evaluate the performances in a
detailed manner. In addition, it is significant to note that, as there exist a number of
stakeholders, there is no specific purpose for the preparation and presentation of the financial
statements. This means that financial statement serves as the base for a number of decisions,
such as lending, buying, and regulating and many more (Delen, Kuzey and Uyar, 2013).
While the investors are keen to know the overall financial health of the company, the
regulators have the prime objective of ensuring that the statements comply with the corporate
governance requirements and applicable accounting framework (Robinson et. al, 2015). Thus,
in order to make the decisions, stakeholders must analyse the statements according to their
needs. Further, the statements provide a competitive analysis of the performance with respect
to the performance of the competitors belonging to the same industry.
⊘ This is a preview!⊘
Do you want full access?
Subscribe today to unlock all pages.
Trusted by 1+ million students worldwide
REPORT 3
There have been prescribed a number of techniques for analysing the financial vitality of an
enterprise. These techniques make use of the relevant and specific data from the financial
statements and the market, about the enterprise (Stickney et al., 2009). One such technique is
ratio analysis. A comparative ratio analysis aids an individual to gain an insight about the
profitability, efficiency, liquidity, and solvency positions of an entity. The ratios are further
useful when compared with the industry average and the relative data of the competitors
(Bragg, 2012). In addition, the ratios aid in further trend analysis and thus overall financial
vitality of a company can be assessed.
Another way of evaluating the current performance and the worth of an entity is by making
use of the stock’s price, as derived from the live market or the stock exchange where the
shares of a public company are traded. It is significant to note that the analysis of the stock
price in the light of the historical performance of an enterprise would yield limited results
(Hillier, Grinblatt and Titman, 2011). The said evaluation must be done in conjunction with
the company’s future prospects and the current news in relation to recent agreements entered
into by an entity. An industry analysis must also be combined. The evaluation on the above
lines will give an overall insight at a macro level of the position of an enterprise.
Accordingly, the stakeholders can make investment and regulatory decisions.
Analysis of Financial Statements: Practical Application
Ratio Analysis
Profitability
The profitability position of an entity can be primarily assessed with the help of three key
ratios namely the return on equity, the gross profit margin, and the net margin (profit) ratio.
While the net profit ratio is calculated as the percentage of profits to the revenues, the return
on equity is computed as the percentage of profit on the total shareholder’s equity. The gross
profit is calculated taking the percentage of gross profit on the revenue. These ratios aid in
the evaluation of the company’s ability to generate income against the expenses and other
incidental costs incurred towards the income generation (Gill, Biger and Mathur, 2010). The
following graph depicts the net profit ratio in respect of the Royal Mail Plc. over the last five
years.
Paraphrase This Document
Need a fresh take? Get an instant paraphrase of this document with our AI Paraphraser
REPORT 4
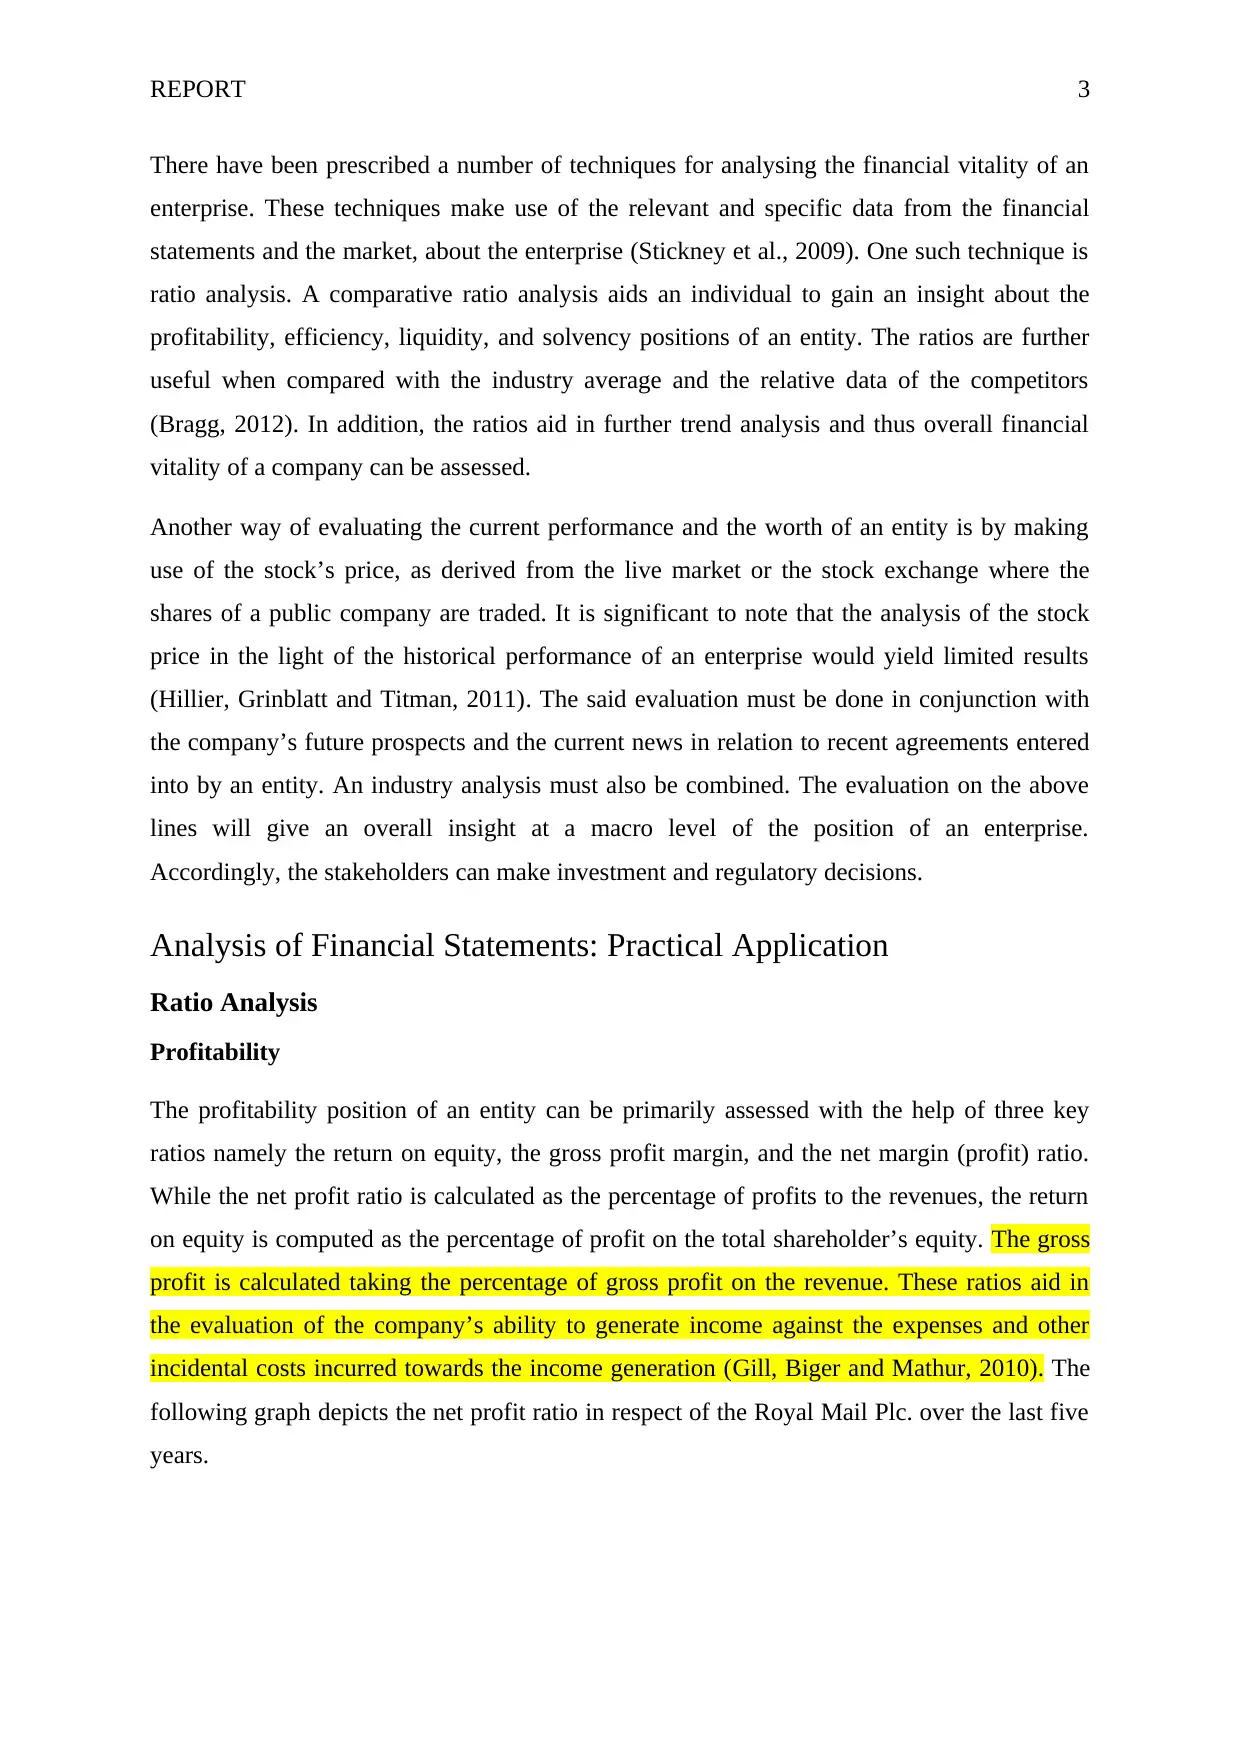
As depicted in the graph above, the net margins have been consistently falling since the year
2015. While the net profit margin for the year 2015 was 3.48 percent, it fell down to 2.61
percent in the year 2016. The fall is again evident in the year, where the net profit margin was
2.55 percent. However, it is significant to note that the net margin in the year 2014 are
extraordinary high due to the specific credit item namely the Royal Mail Pension Plan
amendment (Royal Mail Plc., 2015). The amount for the same had accounted for about £
1350 million in the year 2014. In addition, it is to be noted that the gross profit margin has
been consistent, except in the financial year 2017, where the gross profits were slightly
higher. The reason for the same was the lower people costs, distribution costs and the
conveyance costs.
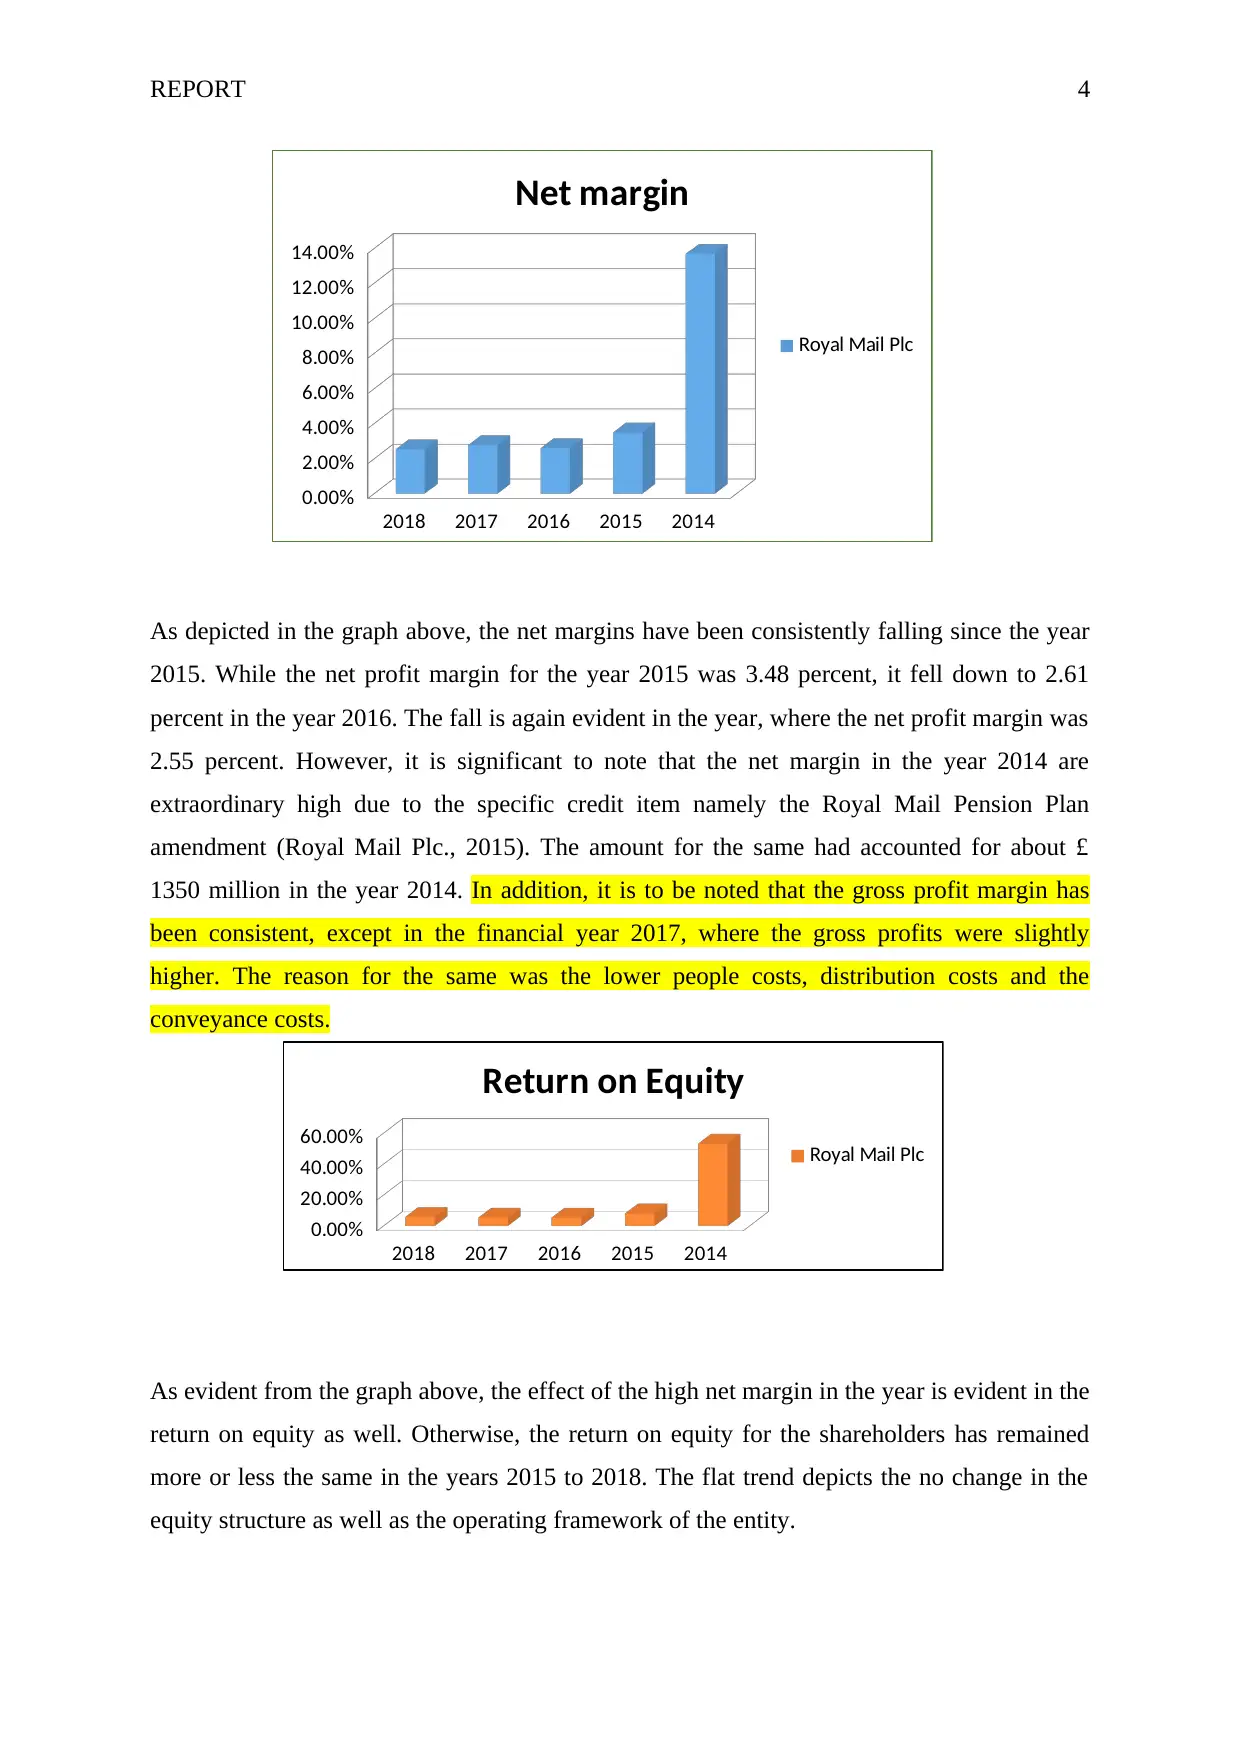
As evident from the graph above, the effect of the high net margin in the year is evident in the
return on equity as well. Otherwise, the return on equity for the shareholders has remained
more or less the same in the years 2015 to 2018. The flat trend depicts the no change in the
equity structure as well as the operating framework of the entity.
2018 2017 2016 2015 2014
0.00%
2.00%
4.00%
6.00%
8.00%
10.00%
12.00%
14.00%
Net margin
Royal Mail Plc
2018 2017 2016 2015 2014
0.00%
20.00%
40.00%
60.00%
Return on Equity
Royal Mail Plc
As depicted in the graph above, the net margins have been consistently falling since the year
2015. While the net profit margin for the year 2015 was 3.48 percent, it fell down to 2.61
percent in the year 2016. The fall is again evident in the year, where the net profit margin was
2.55 percent. However, it is significant to note that the net margin in the year 2014 are
extraordinary high due to the specific credit item namely the Royal Mail Pension Plan
amendment (Royal Mail Plc., 2015). The amount for the same had accounted for about £
1350 million in the year 2014. In addition, it is to be noted that the gross profit margin has
been consistent, except in the financial year 2017, where the gross profits were slightly
higher. The reason for the same was the lower people costs, distribution costs and the
conveyance costs.
As evident from the graph above, the effect of the high net margin in the year is evident in the
return on equity as well. Otherwise, the return on equity for the shareholders has remained
more or less the same in the years 2015 to 2018. The flat trend depicts the no change in the
equity structure as well as the operating framework of the entity.
2018 2017 2016 2015 2014
0.00%
2.00%
4.00%
6.00%
8.00%
10.00%
12.00%
14.00%
Net margin
Royal Mail Plc
2018 2017 2016 2015 2014
0.00%
20.00%
40.00%
60.00%
Return on Equity
Royal Mail Plc
REPORT 5
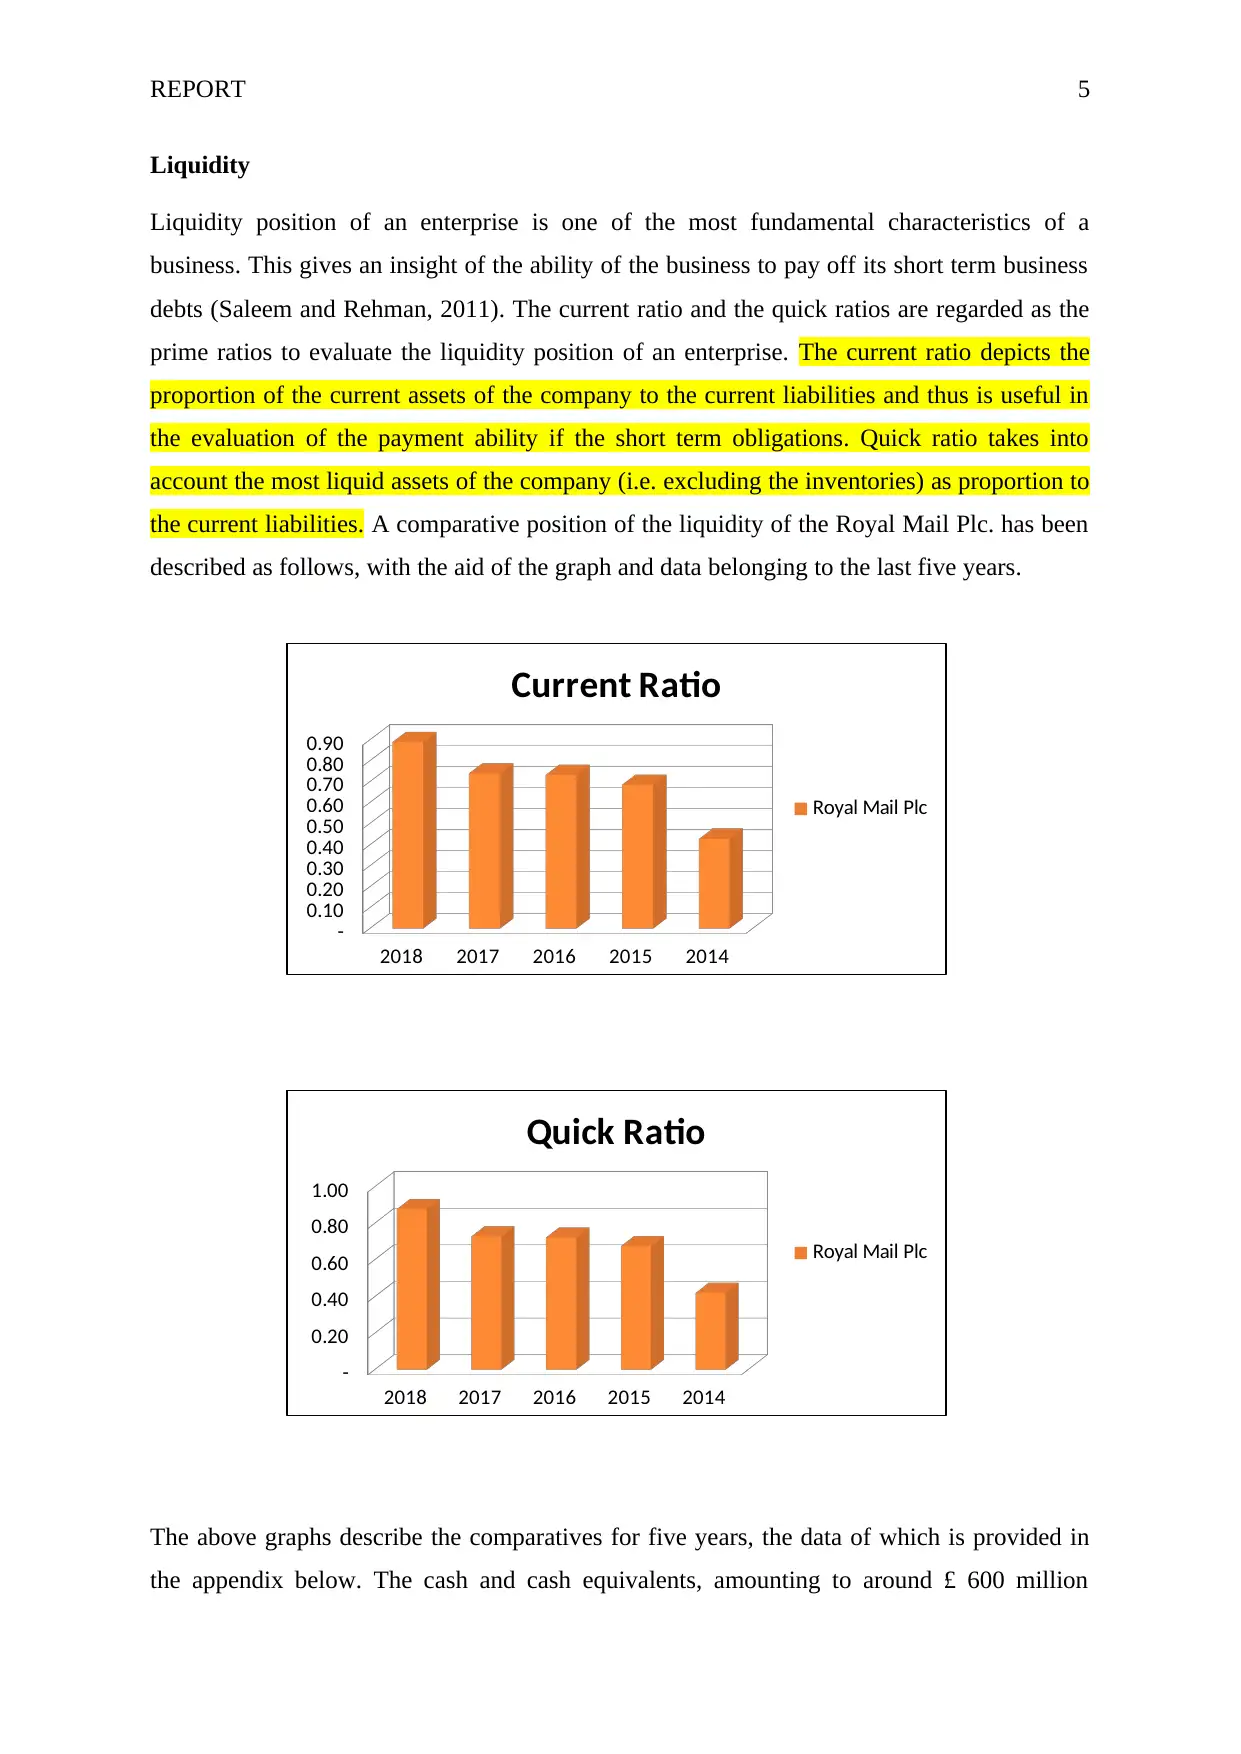
Liquidity
Liquidity position of an enterprise is one of the most fundamental characteristics of a
business. This gives an insight of the ability of the business to pay off its short term business
debts (Saleem and Rehman, 2011). The current ratio and the quick ratios are regarded as the
prime ratios to evaluate the liquidity position of an enterprise. The current ratio depicts the
proportion of the current assets of the company to the current liabilities and thus is useful in
the evaluation of the payment ability if the short term obligations. Quick ratio takes into
account the most liquid assets of the company (i.e. excluding the inventories) as proportion to
the current liabilities. A comparative position of the liquidity of the Royal Mail Plc. has been
described as follows, with the aid of the graph and data belonging to the last five years.
The above graphs describe the comparatives for five years, the data of which is provided in
the appendix below. The cash and cash equivalents, amounting to around £ 600 million
2018 2017 2016 2015 2014
-
0.10
0.20
0.30
0.40
0.50
0.60
0.70
0.80
0.90
Current Ratio
Royal Mail Plc
2018 2017 2016 2015 2014
-
0.20
0.40
0.60
0.80
1.00
Quick Ratio
Royal Mail Plc
⊘ This is a preview!⊘
Do you want full access?
Subscribe today to unlock all pages.
Trusted by 1+ million students worldwide
REPORT 6
(Yahoo Finance, 2018), own the major portion of the current assets of the year 2018 for the
entity Royal Mail Plc. The cash and the cash equivalents of the year 2018 are almost double
than that of the year 2017, depicting a better liquidity position of the enterprise. In addition,
the other current assets are at a better place than the previous year, together leading to the
increase in the overall current assets of the enterprise and the current ratio. Another major
contributory towards the better current ratio in the year 2018 is the reduction in the amount of
the short-term debt.
The quick ratio changes are at the same pace as that of the current ratio change because of the
consistency in the amount of the inventories over the years, as depicted in the data in the
appendix.
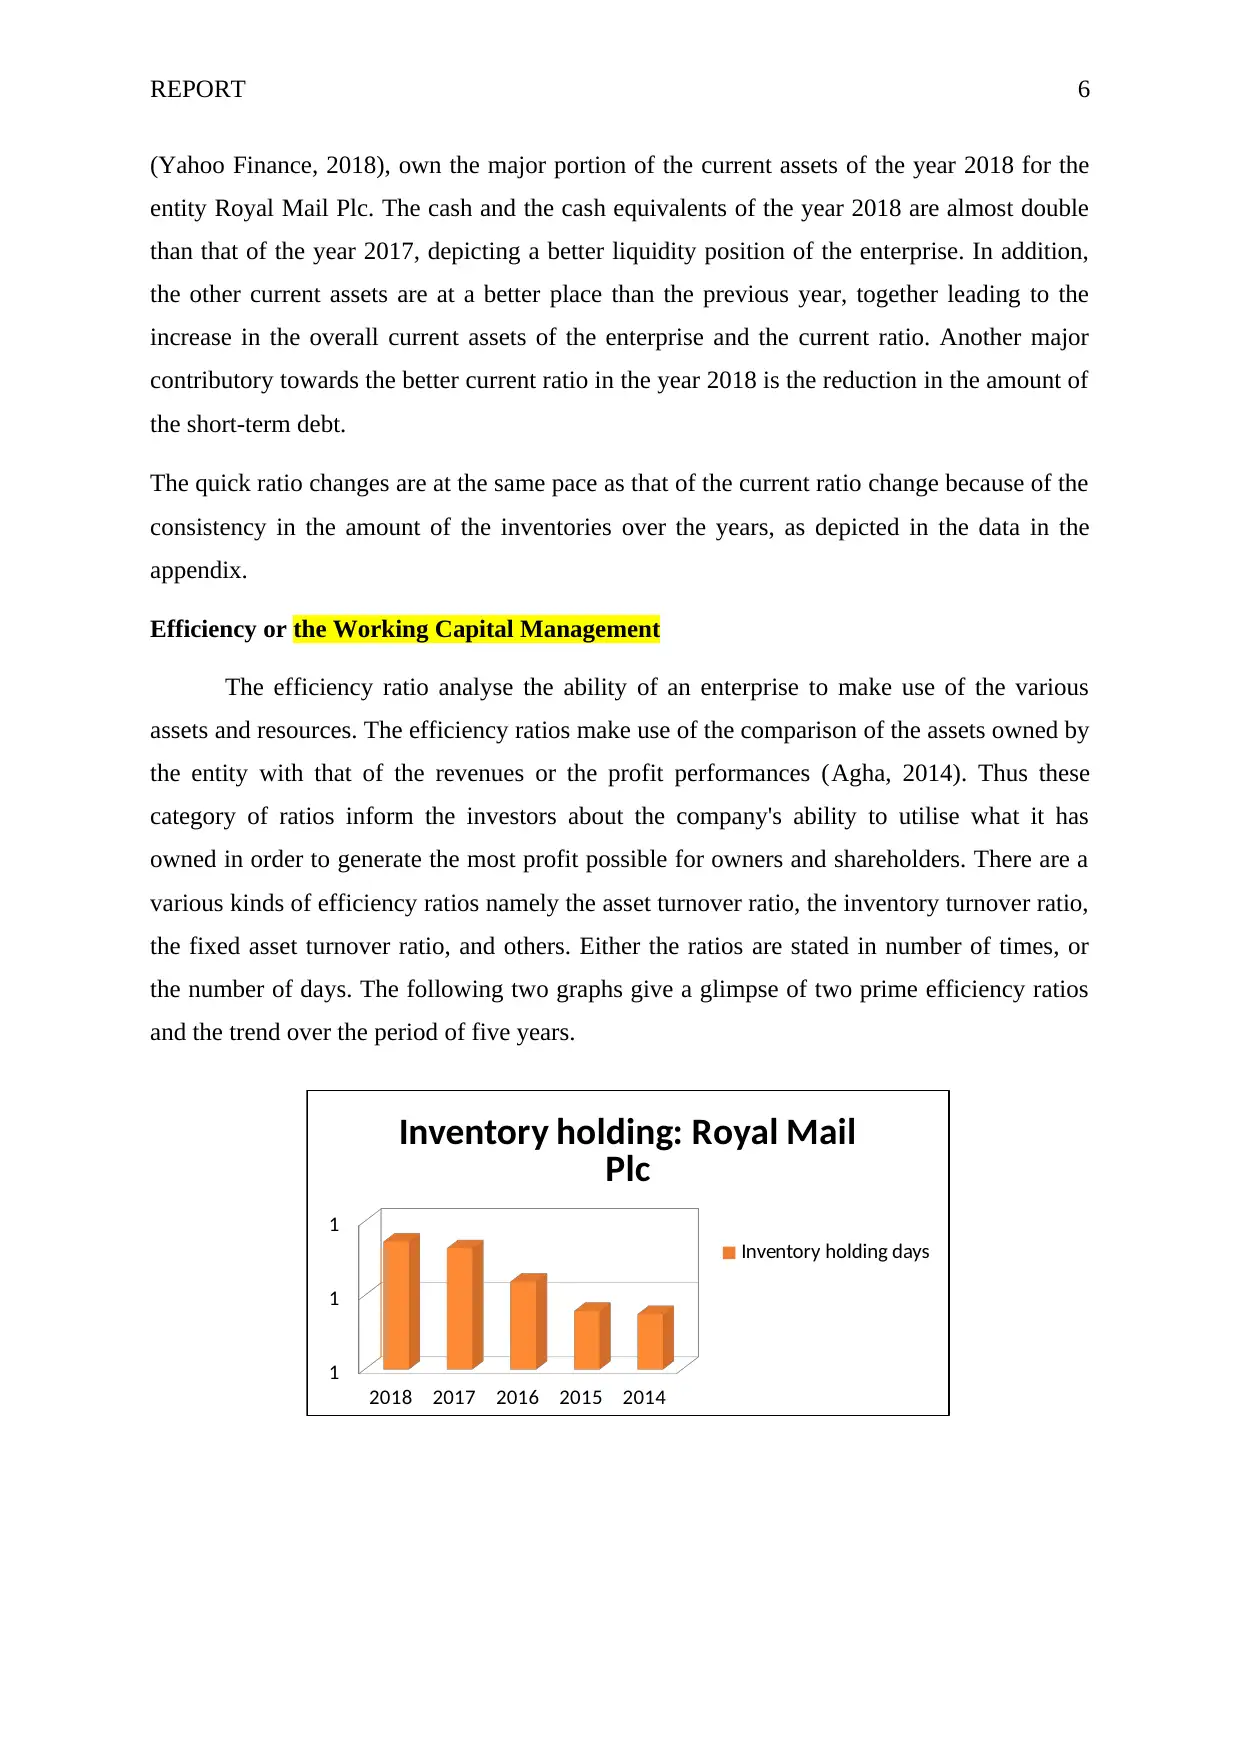
Efficiency or the Working Capital Management
The efficiency ratio analyse the ability of an enterprise to make use of the various
assets and resources. The efficiency ratios make use of the comparison of the assets owned by
the entity with that of the revenues or the profit performances (Agha, 2014). Thus these
category of ratios inform the investors about the company's ability to utilise what it has
owned in order to generate the most profit possible for owners and shareholders. There are a
various kinds of efficiency ratios namely the asset turnover ratio, the inventory turnover ratio,
the fixed asset turnover ratio, and others. Either the ratios are stated in number of times, or
the number of days. The following two graphs give a glimpse of two prime efficiency ratios
and the trend over the period of five years.
2018 2017 2016 2015 2014
1
1
1
Inventory holding: Royal Mail
Plc
Inventory holding days
(Yahoo Finance, 2018), own the major portion of the current assets of the year 2018 for the
entity Royal Mail Plc. The cash and the cash equivalents of the year 2018 are almost double
than that of the year 2017, depicting a better liquidity position of the enterprise. In addition,
the other current assets are at a better place than the previous year, together leading to the
increase in the overall current assets of the enterprise and the current ratio. Another major
contributory towards the better current ratio in the year 2018 is the reduction in the amount of
the short-term debt.
The quick ratio changes are at the same pace as that of the current ratio change because of the
consistency in the amount of the inventories over the years, as depicted in the data in the
appendix.
Efficiency or the Working Capital Management
The efficiency ratio analyse the ability of an enterprise to make use of the various
assets and resources. The efficiency ratios make use of the comparison of the assets owned by
the entity with that of the revenues or the profit performances (Agha, 2014). Thus these
category of ratios inform the investors about the company's ability to utilise what it has
owned in order to generate the most profit possible for owners and shareholders. There are a
various kinds of efficiency ratios namely the asset turnover ratio, the inventory turnover ratio,
the fixed asset turnover ratio, and others. Either the ratios are stated in number of times, or
the number of days. The following two graphs give a glimpse of two prime efficiency ratios
and the trend over the period of five years.
2018 2017 2016 2015 2014
1
1
1
Inventory holding: Royal Mail
Plc
Inventory holding days
Paraphrase This Document
Need a fresh take? Get an instant paraphrase of this document with our AI Paraphraser
REPORT 7
The inventory days refers to the average number of days, goods or the inventory remain
before being sold by the enterprise. Thus, a low ratio indicates that a company is quickly
converting its inventory into the sales. The entity Royal Mail Plc. has been depicting a
consistent low inventory holding days, because of the nature of the inventory involved.
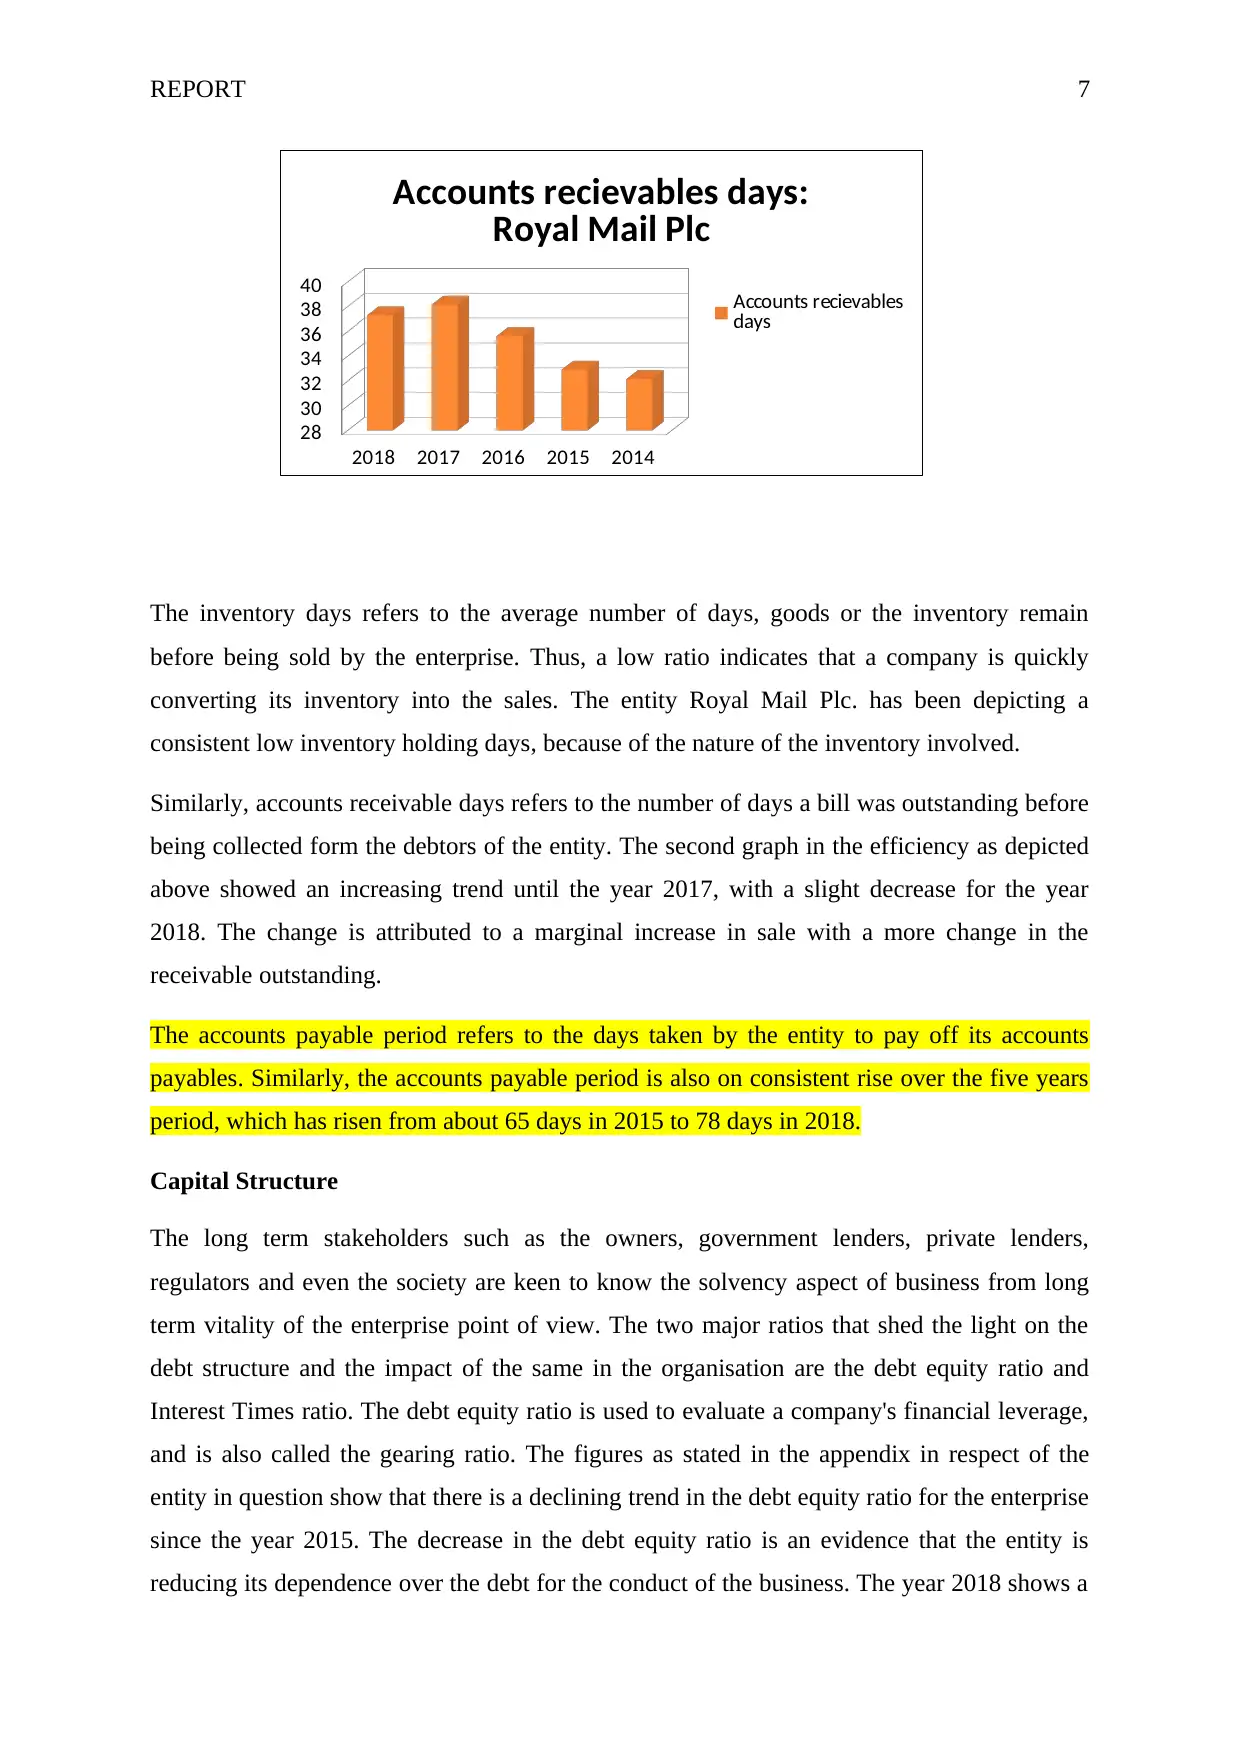
Similarly, accounts receivable days refers to the number of days a bill was outstanding before
being collected form the debtors of the entity. The second graph in the efficiency as depicted
above showed an increasing trend until the year 2017, with a slight decrease for the year
2018. The change is attributed to a marginal increase in sale with a more change in the
receivable outstanding.
The accounts payable period refers to the days taken by the entity to pay off its accounts
payables. Similarly, the accounts payable period is also on consistent rise over the five years
period, which has risen from about 65 days in 2015 to 78 days in 2018.
Capital Structure
The long term stakeholders such as the owners, government lenders, private lenders,
regulators and even the society are keen to know the solvency aspect of business from long
term vitality of the enterprise point of view. The two major ratios that shed the light on the
debt structure and the impact of the same in the organisation are the debt equity ratio and
Interest Times ratio. The debt equity ratio is used to evaluate a company's financial leverage,
and is also called the gearing ratio. The figures as stated in the appendix in respect of the
entity in question show that there is a declining trend in the debt equity ratio for the enterprise
since the year 2015. The decrease in the debt equity ratio is an evidence that the entity is
reducing its dependence over the debt for the conduct of the business. The year 2018 shows a
2018 2017 2016 2015 2014
28
30
32
34
36
38
40
Accounts recievables days:
Royal Mail Plc
Accounts recievables
days
The inventory days refers to the average number of days, goods or the inventory remain
before being sold by the enterprise. Thus, a low ratio indicates that a company is quickly
converting its inventory into the sales. The entity Royal Mail Plc. has been depicting a
consistent low inventory holding days, because of the nature of the inventory involved.
Similarly, accounts receivable days refers to the number of days a bill was outstanding before
being collected form the debtors of the entity. The second graph in the efficiency as depicted
above showed an increasing trend until the year 2017, with a slight decrease for the year
2018. The change is attributed to a marginal increase in sale with a more change in the
receivable outstanding.
The accounts payable period refers to the days taken by the entity to pay off its accounts
payables. Similarly, the accounts payable period is also on consistent rise over the five years
period, which has risen from about 65 days in 2015 to 78 days in 2018.
Capital Structure
The long term stakeholders such as the owners, government lenders, private lenders,
regulators and even the society are keen to know the solvency aspect of business from long
term vitality of the enterprise point of view. The two major ratios that shed the light on the
debt structure and the impact of the same in the organisation are the debt equity ratio and
Interest Times ratio. The debt equity ratio is used to evaluate a company's financial leverage,
and is also called the gearing ratio. The figures as stated in the appendix in respect of the
entity in question show that there is a declining trend in the debt equity ratio for the enterprise
since the year 2015. The decrease in the debt equity ratio is an evidence that the entity is
reducing its dependence over the debt for the conduct of the business. The year 2018 shows a
2018 2017 2016 2015 2014
28
30
32
34
36
38
40
Accounts recievables days:
Royal Mail Plc
Accounts recievables
days
REPORT 8
drastic reduction in the entity’s other liabilities, and hence the fall. On the lines of the same, it
must be noted that the interest time’s ratio has significantly reduced from the financial year
2017 to the financial year 2018. The change is of almost 50 percent.
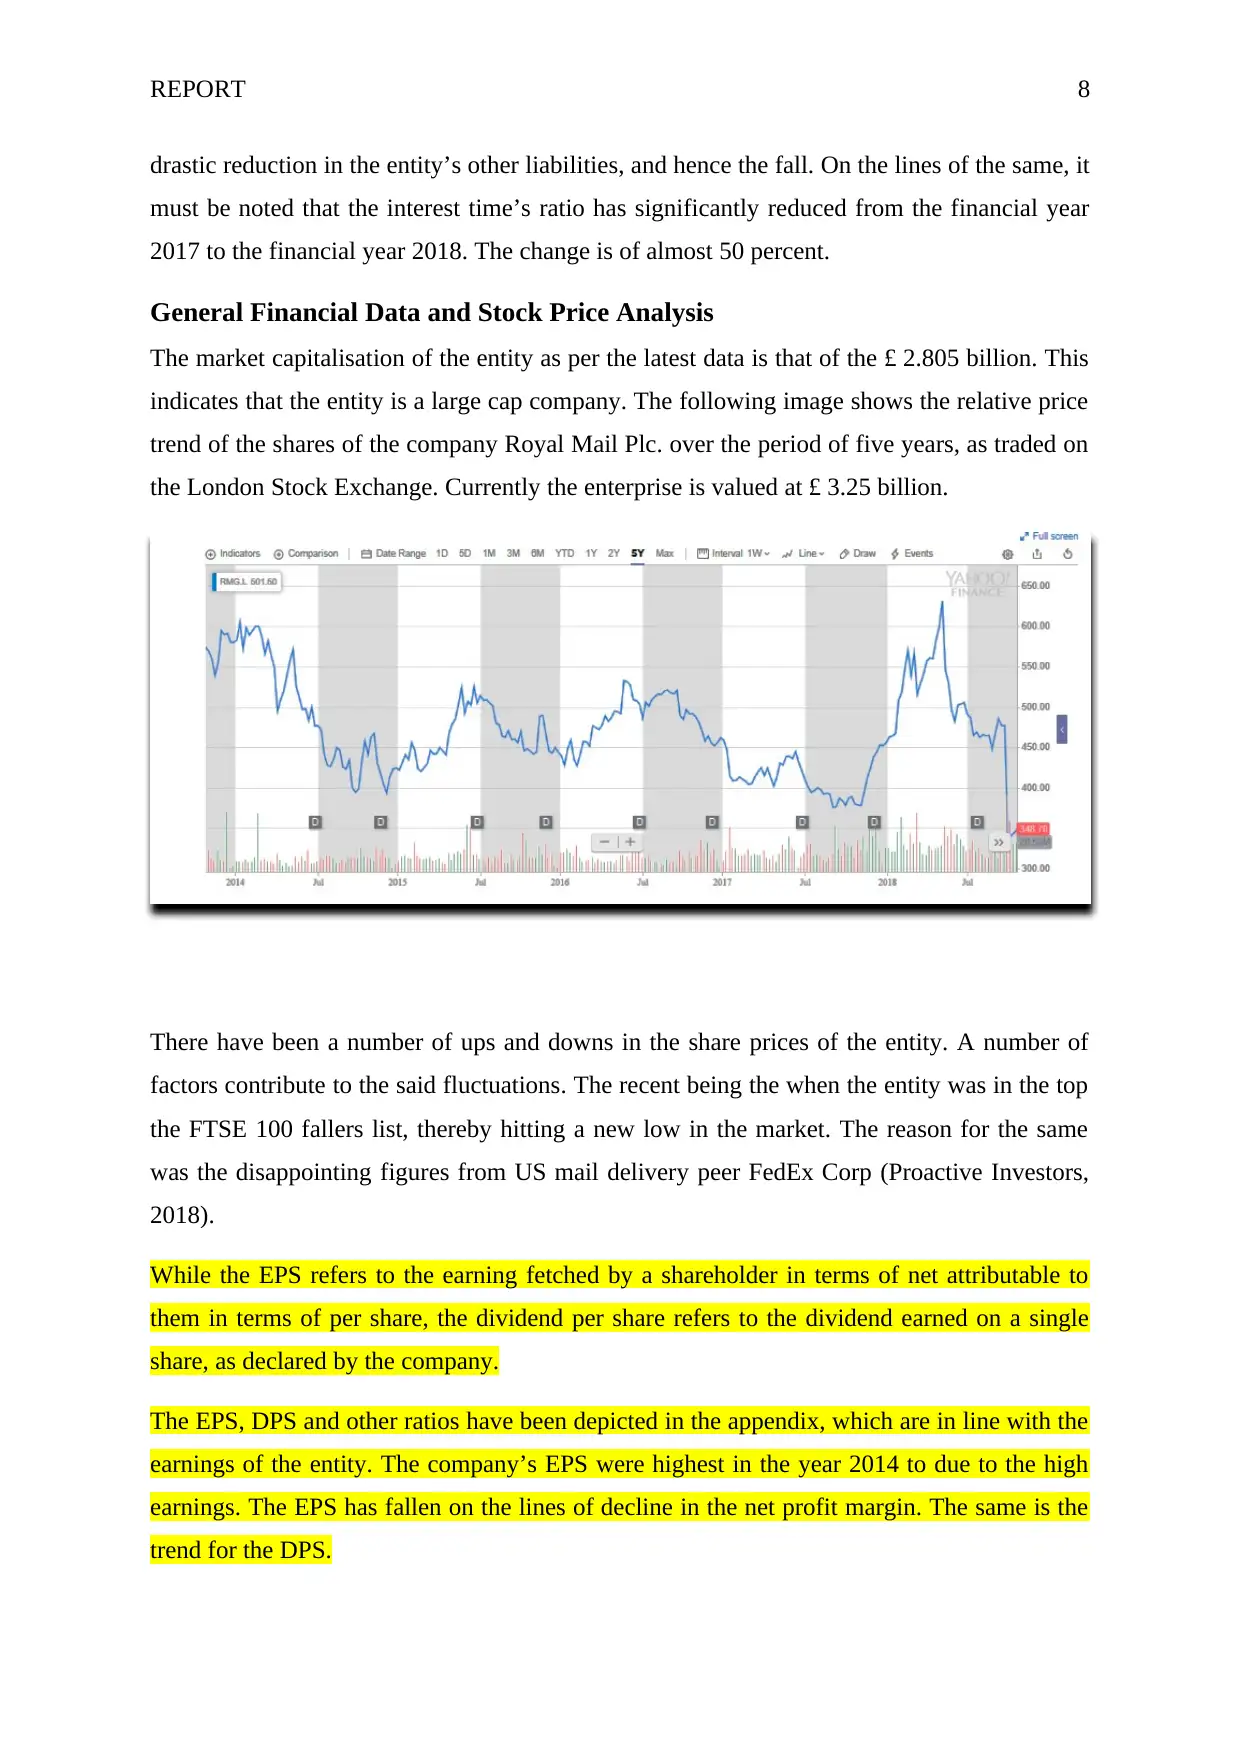
General Financial Data and Stock Price Analysis
The market capitalisation of the entity as per the latest data is that of the £ 2.805 billion. This
indicates that the entity is a large cap company. The following image shows the relative price
trend of the shares of the company Royal Mail Plc. over the period of five years, as traded on
the London Stock Exchange. Currently the enterprise is valued at £ 3.25 billion.
There have been a number of ups and downs in the share prices of the entity. A number of
factors contribute to the said fluctuations. The recent being the when the entity was in the top
the FTSE 100 fallers list, thereby hitting a new low in the market. The reason for the same
was the disappointing figures from US mail delivery peer FedEx Corp (Proactive Investors,
2018).
While the EPS refers to the earning fetched by a shareholder in terms of net attributable to
them in terms of per share, the dividend per share refers to the dividend earned on a single
share, as declared by the company.
The EPS, DPS and other ratios have been depicted in the appendix, which are in line with the
earnings of the entity. The company’s EPS were highest in the year 2014 to due to the high
earnings. The EPS has fallen on the lines of decline in the net profit margin. The same is the
trend for the DPS.
drastic reduction in the entity’s other liabilities, and hence the fall. On the lines of the same, it
must be noted that the interest time’s ratio has significantly reduced from the financial year
2017 to the financial year 2018. The change is of almost 50 percent.
General Financial Data and Stock Price Analysis
The market capitalisation of the entity as per the latest data is that of the £ 2.805 billion. This
indicates that the entity is a large cap company. The following image shows the relative price
trend of the shares of the company Royal Mail Plc. over the period of five years, as traded on
the London Stock Exchange. Currently the enterprise is valued at £ 3.25 billion.
There have been a number of ups and downs in the share prices of the entity. A number of
factors contribute to the said fluctuations. The recent being the when the entity was in the top
the FTSE 100 fallers list, thereby hitting a new low in the market. The reason for the same
was the disappointing figures from US mail delivery peer FedEx Corp (Proactive Investors,
2018).
While the EPS refers to the earning fetched by a shareholder in terms of net attributable to
them in terms of per share, the dividend per share refers to the dividend earned on a single
share, as declared by the company.
The EPS, DPS and other ratios have been depicted in the appendix, which are in line with the
earnings of the entity. The company’s EPS were highest in the year 2014 to due to the high
earnings. The EPS has fallen on the lines of decline in the net profit margin. The same is the
trend for the DPS.
⊘ This is a preview!⊘
Do you want full access?
Subscribe today to unlock all pages.
Trusted by 1+ million students worldwide
REPORT 9
However, the market value of shares is on consistent rise and that is a positive sign. The price
earnings ratio refers to the ratio of market price of a company’s share to its earning per share.
Accordingly, the price earnings ratio of the company has improved over the five years. The
increasing trend in the price earnings ratio indicates that the investors are bullish on the stock
and are expecting from the company to post higher earnings. The dividend yield is the ratio
of a company's annual dividend compared to its share price. The high dividend yields are
stated to be attractive. Lower dividend in the year 2018 has dragged down the dividend yield
as well, as compared to the year 2017.
Conclusion
As per the discussions conducted in the previous parts, it can be concluded that the
preparation and the presentation of the financial statements forms the integral part of the
businesses. These are essential not only in terms of the fair representation of the transactions
and events to the various stakeholders, but also make the entities accountable towards the
regulators of the accounting and the compliance provisions. It must further be noted that the
analysis of such financial statements assist the stakeholders in gaining the useful information
about the business enterprise on the lines of investment, financial wellness and the overall
competitiveness in the industry to which an entity relates. The report was an attempt to
analyse the financial data of the entity Royal Mail Plc, which is a popular name in the courier
and postal service industry. The ratio analysis technique was adopted for the analysis and the
same was presented with the aid of the graphical representations. The various ratios gave an
insight of the various facets such as the capital structure, the effectiveness of the utilisation of
the assets, the ability to pay off the debts and many more.
It has been recommended to the company to manage its short term liabilities and assets in a
better way, as the accounts receivable and payable periods are on rising trends, as shown by
the ratio analysis. The increasing trend in these ratios is an alarming trend for the entity.
In addition, a brief evaluation of the market vitals was done. Thus, it can be stated that
financial analysis serves a number of purposes for various stakeholders.
Paraphrase This Document
Need a fresh take? Get an instant paraphrase of this document with our AI Paraphraser
REPORT 10
References
Agha, H., (2014) Impact of working capital management on Profitability. European
Scientific Journal, ESJ, 10(1).
Bragg, S. M. (2012) Financial analysis: a controller's guide. UK: John Wiley & Sons.
Delen, D., Kuzey, C., and Uyar, A. (2013) Measuring firm performance using financial
ratios: A decision tree approach. Expert Systems with Applications, 40(10), pp. 3970-3983.
Fabozzi, F. J. and Drake, P. P. (2009) Finance: Capital Markets, Financial Management,
and Investment Management. UK: John Wiley & Sons.
Fridson, M. S. and Alvarez, F. (2011) Financial statement analysis: a practitioner's
guide (Vol. 597). UK: John Wiley & Sons.
Gill, A., Biger, N. and Mathur, N. (2010) The relationship between working capital
management and profitability: Evidence from the United States. Business and economics
journal, 10(1), pp. 1-9.
Hillier, D., Grinblatt, M., & Titman, S. (2011). Financial markets and corporate
strategy (No. 2nd Eu). UK: McGraw Hill.
Proactive Investors (2018) Royal Mail shares hit new record low as investors react to
disappointing numbers from FedEx. [online] Available from:
https://www.proactiveinvestors.co.uk/companies/news/211485/royal-mail-shares-hit-new-
record-low-as-investors-react-to-disappointing-numbers-from-fedex-211485.html [Accessed
on 24 December 2018].
Robinson, T. R., Henry, E., Pirie, W. L., and Broihahn, M. A. (2015) International Financial
Statement Analysis Workbook. UK: John Wiley & Sons.
REPORT 11
Saleem, Q. and Rehman, R. U. (2011) Impacts of liquidity ratios on
profitability. Interdisciplinary Journal of Research in Business, 1(7), pp. 95-98.
Stickney, C. P., Weil, R. L., Schipper, K., Francis, J. (2009) Financial Accounting: An
Introduction to Concepts, Methods and Uses. Boston MA: Cengage Learning.
Yahoo Finance (2018a) Royal Mail plc (RMG.L). [online] Available from:
https://uk.finance.yahoo.com/quote/RMG.L/balance-sheet?p=RMG.L [Accessed on 24
December 2018].
Yahoo Finance (2018b) Royal Mail plc (RMG.L). [online] Available from:
https://uk.finance.yahoo.com/quote/RMG.L/history?
period1=1396117800&period2=1522348200&interval=1mo&filter=history&frequency=1mo
[Accessed on 27 December 2018].
⊘ This is a preview!⊘
Do you want full access?
Subscribe today to unlock all pages.
Trusted by 1+ million students worldwide
1 out of 15
Related Documents


Your All-in-One AI-Powered Toolkit for Academic Success.
+13062052269
info@desklib.com
Available 24*7 on WhatsApp / Email
![[object Object]](/_next/static/media/star-bottom.7253800d.svg)
Unlock your academic potential
Copyright © 2020–2026 A2Z Services. All Rights Reserved. Developed and managed by ZUCOL.