Detailed Financial Analysis Report: Sainsbury and Tesco Comparison
VerifiedAdded on  2021/02/19
|32
|5616
|25
Report
AI Summary
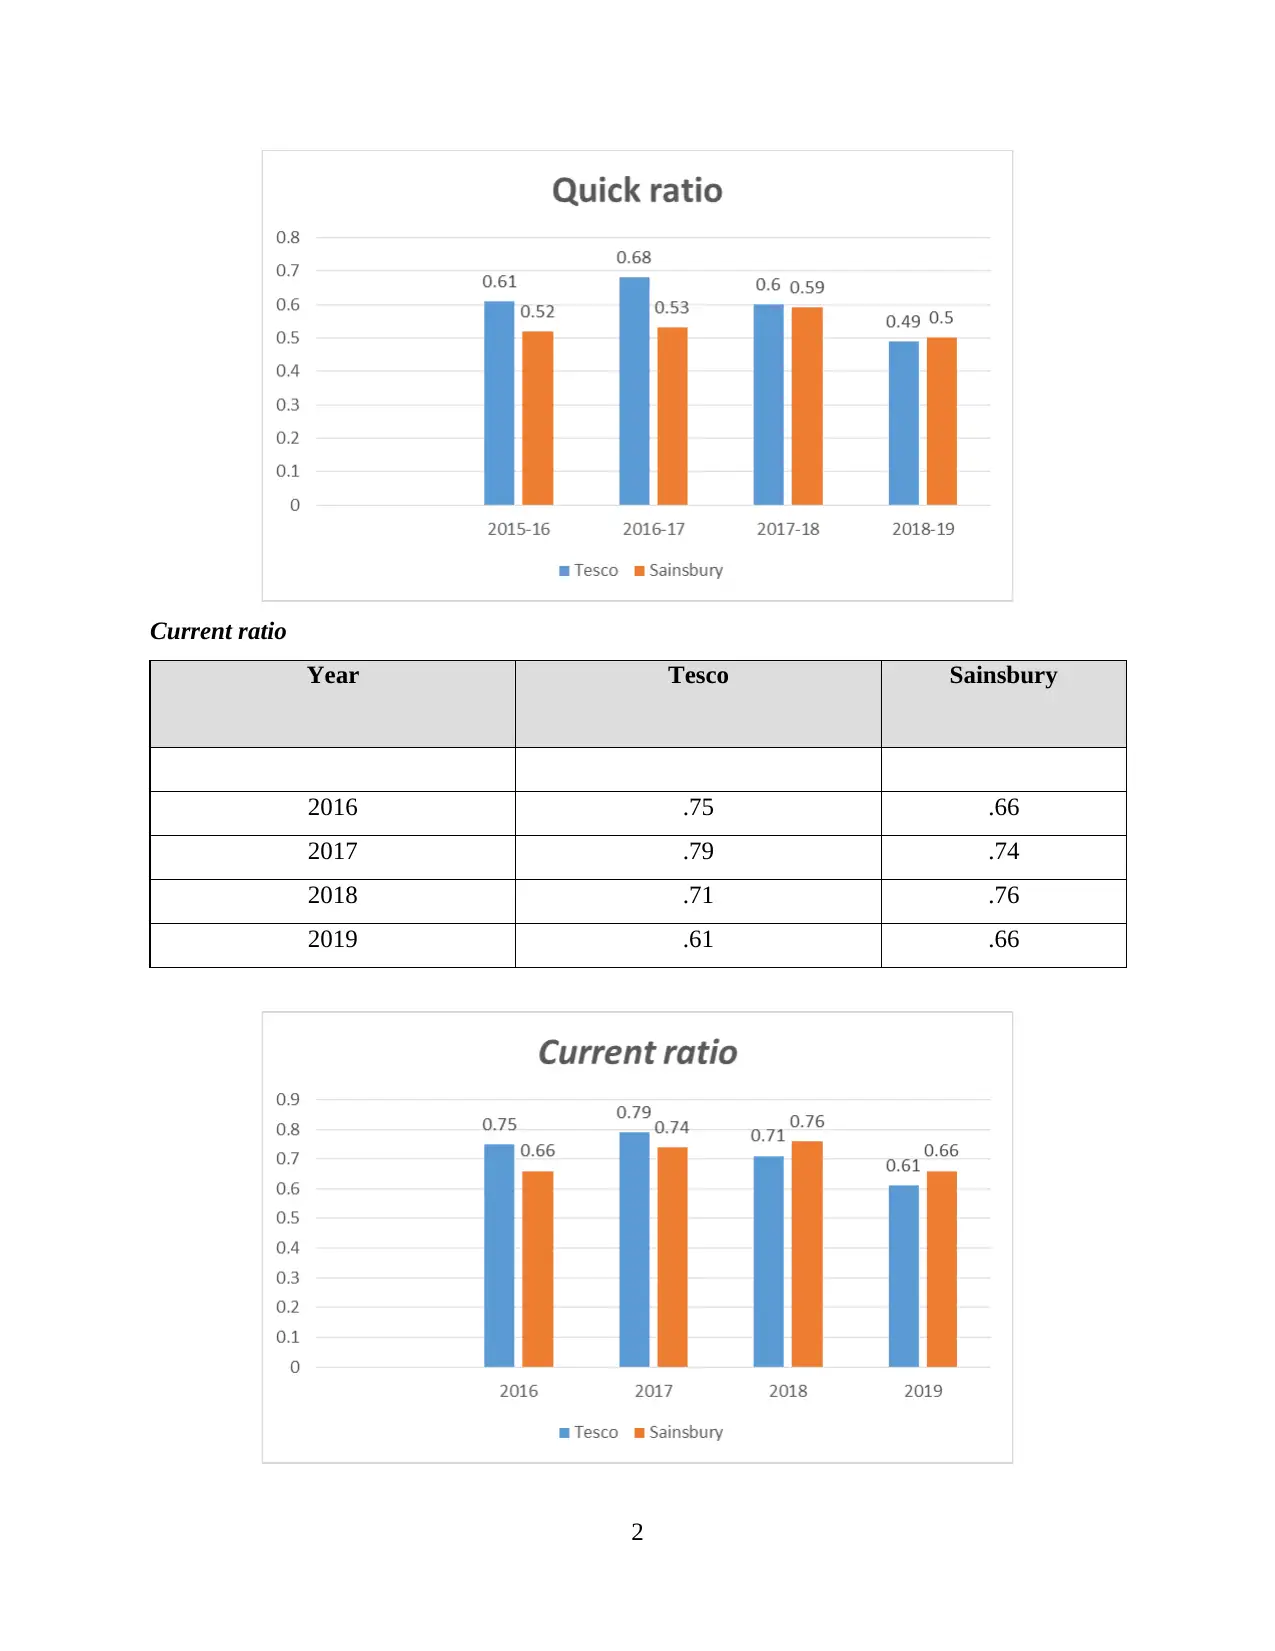
This report presents a detailed financial analysis comparing the performance of Sainsbury and Tesco plc. It begins with an introduction to financial analysis and its importance, followed by an in-depth examination of key financial ratios, including liquidity, investment, efficiency, solvency, and profitability ratios, calculated from the companies' financial statements between 2015 and 2019. The analysis includes a comparison of vertical and horizontal financial statements, providing insights into trends and changes over time. The report also emphasizes the significance of working capital analysis for both companies and offers a critical analysis of their cash flow statements. The findings highlight the financial strengths and weaknesses of each company, offering a comprehensive overview of their financial health and efficiency. The report concludes with a summary of the key findings and references to supporting financial data.

Financial Analysis
Management & Enterprise
Paraphrase This Document
Need a fresh take? Get an instant paraphrase of this document with our AI Paraphraser

TABLE OF CONTENTS
INTRODUCTION...........................................................................................................................1
MAIN BODY...................................................................................................................................1
1. Presenting detailed analysis of vertical, horizontal and financial ratios of Sainsbury and
Tesco plc......................................................................................................................................1
2. Explaining importance of working capital analysis of Sainsbury and Tesco........................13
3. Showing critical analysis of cash flow statements of both companies..................................14
CONCLUSION..............................................................................................................................15
REFERENCES..............................................................................................................................16
APPENDIX ...................................................................................................................................17

INTRODUCTION
A process consisting with analysis of financial performance of the centrepiece and and
comparing it with company's past and budgeted position in order to determine actual financial
performance of the firm (Hasche and et.al., 2018). Further, Financial management is nothing, but
a process performed by financial managers of the company in order to formulate strategies and
plan various procedures for the firm so that it could achieve its financial goals efficiently. The
present report shows report prepared by financial advisor to be submitted to the board of
directors of Asian food manufacturer. The report includes a comparison of financial performance
of Sainsbury and Tesco plc. It describes an analysis of vertical and horizontal financial
statements of both the companies along with analysis of their financial ratios as order to evaluate
financial efficiency of both the companies. Moreover, the report also mentions importance of
working capital analysis for both Sainsbury and Tesco. In addition, it also presents an indepth
analysis of cashflow position of both businesses. At the end of report, it shows different financial
statements of both companies as an evidence of above mentioned analysis.
MAIN BODY
1. Presenting detailed analysis of vertical, horizontal and financial ratios of Sainsbury and Tesco
plc
Liquidity ratio analysis
Quick ratio
Year Tesco Sainsbury
2015-16 .61 .52
2016-17 .68 .53
2017-18 .60 .59
2018-19 .49 .50
1
⊘ This is a preview!⊘
Do you want full access?
Subscribe today to unlock all pages.

Trusted by 1+ million students worldwide

Current ratio
Year Tesco Sainsbury
2016 .75 .66
2017 .79 .74
2018 .71 .76
2019 .61 .66
2
Year Tesco Sainsbury
2016 .75 .66
2017 .79 .74
2018 .71 .76
2019 .61 .66
2
Paraphrase This Document
Need a fresh take? Get an instant paraphrase of this document with our AI Paraphraser

Interpretations
Liquidity ratio derived from the financial data of a company helps in analysing the
efficiency of a company in maintaining sufficient amount of cash and cash equivalents within the
company (Suh and Kang, 2019). Companies having liquidity ratios between 1.5 to 3 are being
considered as healthy enterprises.
By analysing the liquidity position of Sainsbury, it can be evaluated that it's liquidity
position increased from 2015-16 to 2017-18. Company’s efficiency declined at an higher rate in
2018-19. Further, its liquidity ratio kept lie between 0.5 to 0.60. Thus, it can be said that it has
been failed to maintain healthy liquidity position.
In addition, with analysis of Tesco' liquidity position, it can be said that there is a
frequent change in the amount of cash and cash equivalents maintained by the firm in order to
maintain repay its creditors.
Thus, it can be said that financial statements of both the companies are not showing their
healthy financial positions.
Investment ratios
Dividends per share
Year Tesco Sainsbury
2015-16 - .12
2016-17 - .12
2017-18 .03 .1
2018-19 .11 .1
3

Earnings per share
Year Tesco Sainsbury
2015-16 0.05 .23
2016-17 (0.01) .17
2017-18 .44 .13
2018-19 .41 .08
4
Year Tesco Sainsbury
2015-16 0.05 .23
2016-17 (0.01) .17
2017-18 .44 .13
2018-19 .41 .08
4
⊘ This is a preview!⊘
Do you want full access?
Subscribe today to unlock all pages.

Trusted by 1+ million students worldwide

Interpretation
Investment ratios consists all those ratios derived from the financial statements that
provides information to the shareholders regarding the risk involved in the investment made by
them into the firm. Along with this, these ratios are also used by the companies in order to help
the investors in their decision making regarding the company. Earning per share and dividend
per share are two major ratios used to provide sufficient information to the shareholders.
Company with higher value of investment ratios and increasing trends in these ratios are
considered as profitable companies as per the views of investors.
The investment ratios of Sainsbury shows stability in payment of dividend. On the other
hand, Earning per share of the company is declining over the year. Talking about, investment
ratios of Tesco plc, it can be said that till the year 2016-17 company was not paying dividend to
its shareholders. After it, company's dividend paying capacity shows increasing trend. Further,
earning per share of Tesco reduced in the year 2016-17 to -0.01 which improved in the year
2017-18 to 0.44. Further, the EPS reduced in the year 2018-19 as well to 0.41.
Thus, it can be said that both company's position is not profitable from the point of view
of an investor, as investment ratios of both the companies are showing declining trend.
Efficiency ratio analysis
5
Paraphrase This Document
Need a fresh take? Get an instant paraphrase of this document with our AI Paraphraser

Interpretation
Efficiency ratios of a company are being calculated by the financial managers in order to
determine the efficiency of the company in generating income from its various resources held by
it during the period (Kacker and et.al., 2019). Inventory turnover ratios, total assets turnover
ratios are covered under Efficiency ratios of financial analysis. As per the guidelines mentioned
in the financial and accounting standards, 50% efficiency ratio of the company should be
considered as an optimal percentage regarding efficiency of the firm. In addition, inventory
turnover ratio of a company should lie between 4 to 6. In addition, in case of of assets turnover
ratio, higher value of ratios of the company shows higher efficiency of the company in
generating revenue from the fixed assets held by it during the year.
6

With analysis of efficiency ratios of Sainsbury, it can be seen that inventory turnover
ratio of the company is having declining position over the year. Whereas, it is showing
increasing trend in case of Tesco Plc. Further, assets turnover ratios of Sainsbury is also having
declining trend. On the other hand, in the Tesco, the ratio is increasing with the passage of year.
Thus, it can be said that efficiency of financial managers of Sainsbury is declining over
the year. Whereas, Tesco's managers are improving their efficiency of earning maximum profits
from different resources held by it. Thus, it can be evaluated that Tesco is more efficient
company as compare to Sainsbury in context to earning revenues from the assets held by it.
Solvency ratios
Interpretation
The Debt equity ratios shows the leverage position of the company. It shows the capacity
of an organisation in repayment of its debts. The ideal debt equity ratio varies from business to
business due to their different requirement of maintaining debts within the business. Talking
about large public companies like Sainsbury and Tesco, the ideal ratio for solvency or debt
equity ratio is considered as 2 or more.
7
⊘ This is a preview!⊘
Do you want full access?
Subscribe today to unlock all pages.

Trusted by 1+ million students worldwide

In the Sainsbury, company's capabilities of repaying its debts are declining over the year.
On the other hand, Tesco's debt equity ratio is also having declining trend as per the financial
statements of last four years. Thus, it can be stated that both companies are not capable to repay
their debts. It increases the risk for creditors of companies. Thus, this ratio may influence the
decision of creditors in negative way.
Profitability Ratios
8
Paraphrase This Document
Need a fresh take? Get an instant paraphrase of this document with our AI Paraphraser

Interpretation
As the name describes, profitability ratios are those that shows profit generation capacity
of the company. Gross profit ratio and net profit ratios are two major ratios used for this purpose.
Gross profit ratio helps the financial managers in determination of profit generation capacity of
the company from its general business operations. On the other hand, net profit ratios shows
capability of a company in deriving profits from its overall operations including operating and
non operating business activities. Higher value of these ratios shows higher capabilities of the
company. Thus, a profitable company always have increasing trend in its profitability ratios.
The profitability positioning of the company can be computed on the basis of income
statements of the business. The computation of profitability ratios of the Sainsbury shows that
company's ability to generate profits from its normal course of business is increasing over the
year. Although, in case of earning profit from overall operations including non operating
incomes is showing declining trend in Sainsbury over the year. On the other hand, taking about
Tesco, it can be stated that the gross profit ratio of Sainsbury reduced in the year 2016-17 as
compare to 2015-16. Although it contains increasing trend after 2016-17 till the last year. Same ,
evaluation of net profit ratio of Tesco shows that its condition of generating profits from various
operating and non operating activities is showing increasing trend.
9

Although, for the comparison purpose it can be stated that profitability position of
Sainsbury is stable. On the other hand, profitability of the Tesco is increasing at higher rate over
the year. Thus, it can be said that Tesco is more potential company than Sainsbury.
Horizontal financial analysis
The horizontal financial statements are those that shows improvement or decline in the
financial performance of the company over the year (Horizontal Analysis of Financial
Statements, 2019). It is the tool of financial management that is used by the financial managers in
order to analyse the trend within the business.
Horizontal income statement of Sainsbury
Interpretation
With analysis of Horizontal income statement of Sainsbury, it can be stated that in the
year 2016 company's revenue generation capacity was changed by 11.6% which was declined in
the year 2017 by 8.5% and kept declining. With further analysis, it can be seen that other factors
10
⊘ This is a preview!⊘
Do you want full access?
Subscribe today to unlock all pages.

Trusted by 1+ million students worldwide
1 out of 32
Related Documents

Your All-in-One AI-Powered Toolkit for Academic Success.
 +13062052269
info@desklib.com
Available 24*7 on WhatsApp / Email
Unlock your academic potential
Copyright © 2020–2025 A2Z Services. All Rights Reserved. Developed and managed by ZUCOL.