Financial Analysis: Gearing, Liquidity, and Solvency of Sainsbury Plc
VerifiedAdded on 2023/06/12
|24
|5413
|63
Report
AI Summary
This report provides a comprehensive evaluation of Sainsbury Plc's financial strategy, focusing on its gearing, liquidity, and solvency positions. It begins by assessing the company's financing strategy, highlighting its reliance on debt and the implications for its gearing ratio. The analysis covers long-term versus short-term debt, trade payables, and the balance between debt and equity. The report also examines other funding sources such as retained earnings, working capital management, sale of fixed assets, and preferred stock issuance. Furthermore, the report evaluates Sainsbury Plc's liquidity and solvency, using ratios like current ratio, quick ratio, cash ratio, and interest coverage ratio to determine its ability to meet short-term and long-term obligations. Finally, recommendations are provided to enhance Sainsbury Plc's financial stability and performance. Desklib offers a wide array of similar solved assignments and study resources for students.
Running head: FINANCIAL STRATEGY
Financial Strategy
Name of the Student:
Name of the University:
Author’s Note:
Course ID:
Financial Strategy
Name of the Student:
Name of the University:
Author’s Note:
Course ID:
Paraphrase This Document
Need a fresh take? Get an instant paraphrase of this document with our AI Paraphraser
1FINANCIAL STRATEGY
Executive Summary:
The current report would aim to evaluate the financial issues and position of an
organisation, which is listed on the London Stock Exchange. Thus, Sainsbury Plc is selected as
the organisation, which is the second biggest supermarket chain in UK having 16.9% of the
market share. It could be observed that the organisation uses debt for financing majority of its
assets. It has been assessed that the leverage position of Sainsbury Plc is high, since majority of
assets are funded through debt, as the ratio has been above 0.5 over the years except in 2014,
when it was 0.49. This signifies that Sainsbury Plc have greater risk in leverage terms. Hence,
various recommendations are provided to Sainsbury Plc for improving its financial standing in
the UK supermarket.
2FINANCIAL STRATEGY
Table of Contents
Introduction:....................................................................................................................................3
Question 1:.......................................................................................................................................3
a. Evaluation of the financing strategy of Sainsbury Plc with particular reference to its gearing:
.....................................................................................................................................................3
b. Evaluation of the liquidity and solvency position of Sainsbury Plc:.....................................12
Conclusion:....................................................................................................................................19
References:....................................................................................................................................21
⊘ This is a preview!⊘
Do you want full access?
Subscribe today to unlock all pages.
Trusted by 1+ million students worldwide
3FINANCIAL STRATEGY
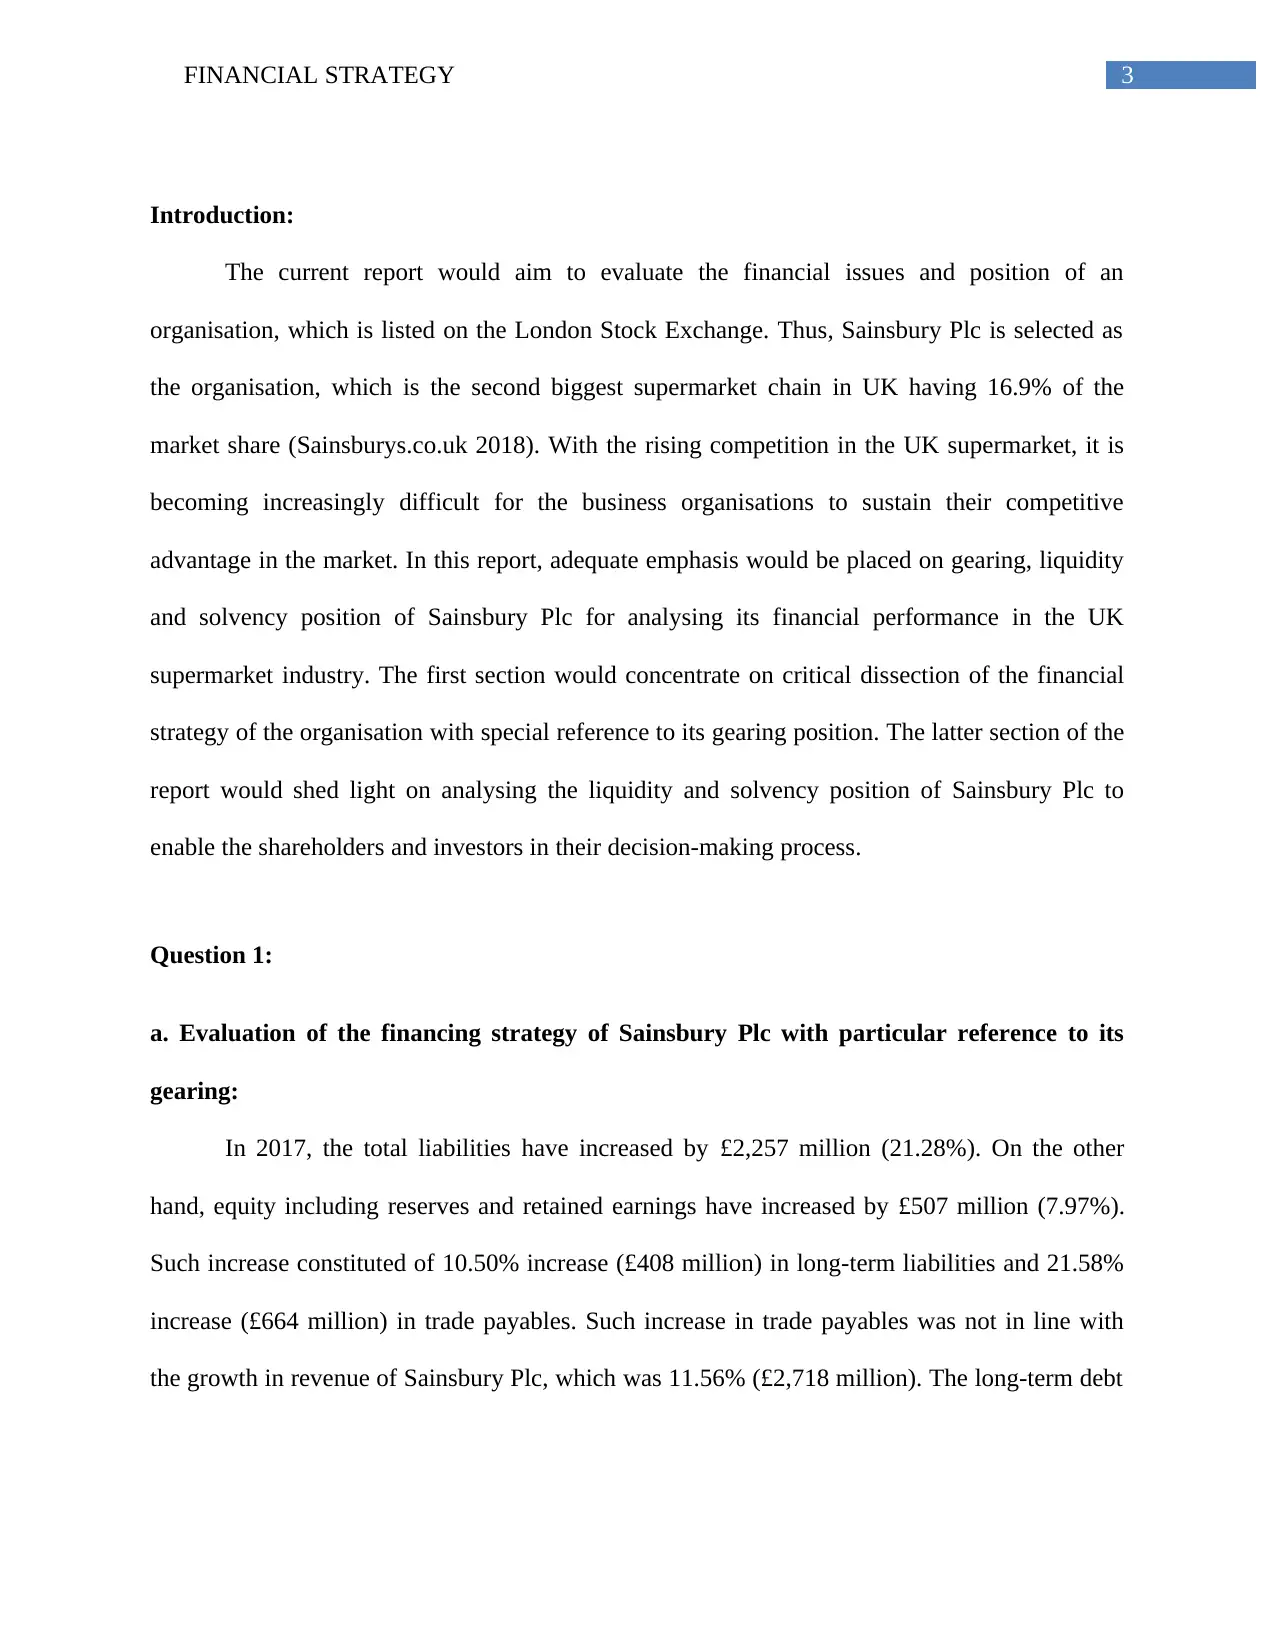
Introduction:
The current report would aim to evaluate the financial issues and position of an
organisation, which is listed on the London Stock Exchange. Thus, Sainsbury Plc is selected as
the organisation, which is the second biggest supermarket chain in UK having 16.9% of the
market share (Sainsburys.co.uk 2018). With the rising competition in the UK supermarket, it is
becoming increasingly difficult for the business organisations to sustain their competitive
advantage in the market. In this report, adequate emphasis would be placed on gearing, liquidity
and solvency position of Sainsbury Plc for analysing its financial performance in the UK
supermarket industry. The first section would concentrate on critical dissection of the financial
strategy of the organisation with special reference to its gearing position. The latter section of the
report would shed light on analysing the liquidity and solvency position of Sainsbury Plc to
enable the shareholders and investors in their decision-making process.
Question 1:
a. Evaluation of the financing strategy of Sainsbury Plc with particular reference to its
gearing:
In 2017, the total liabilities have increased by £2,257 million (21.28%). On the other
hand, equity including reserves and retained earnings have increased by £507 million (7.97%).
Such increase constituted of 10.50% increase (£408 million) in long-term liabilities and 21.58%
increase (£664 million) in trade payables. Such increase in trade payables was not in line with
the growth in revenue of Sainsbury Plc, which was 11.56% (£2,718 million). The long-term debt
Paraphrase This Document
Need a fresh take? Get an instant paraphrase of this document with our AI Paraphraser
4FINANCIAL STRATEGY
of the organisation has been 33.36% of the total liabilities in 2017, which was 36.61% in 2016
(Sainsburys.co.uk 2018).
Even though the debt burden has been minimised in 2017, Sainsbury Plc has been reliant
more on raising funds through debt rather than equity financing. As a result, it has increased
gearing of the organisation from 37.90% in 2016 to 38.45% in 2017. Such increase in debt has
been fuelled through increase in revenue generating assets and investments in property, plant and
equipment (Barr 2018). This is the primary reason that the long-term borrowings of Sainsbury
Plc have declined by 6.89% in 2017 (£151 million). This implies that the rising levels of the debt
of the organisation are used for funding investment in cash as well as “other interest-bearing
securities”.
There are various sources of finance from which Sainsbury Plc obtains funding for
carrying out its overall business operations and they are demonstrated briefly as follows:
Long-term debt versus short-term debt:
The role of the long-term debt is highly significant in the context of the financial strategy
of Sainsbury Plc. In 2013, the long-term debt of the organisation was 55.25% of the overall debt
(Adewuyi 2016). However, in 2017, this proportion has fallen to 33.36% of the total debt amount
of the organisation. It has been identified that Sainsbury Plc has made investments in property,
plant and equipment along with revenue generating assets in 2013. However, these investments
have provided returns to the organisation, which are used for repaying long-term debts as well as
in improving existing business operations (Almamy, Aston and Ngwa 2016).
5FINANCIAL STRATEGY
2013 2014 2015 2016 2017
-
1,000
2,000
3,000
4,000
5,000
6,000
7,000
8,000
9,000
10,000
Long-term debt versus short-term debt
Current liabilities
Non-current liabilities
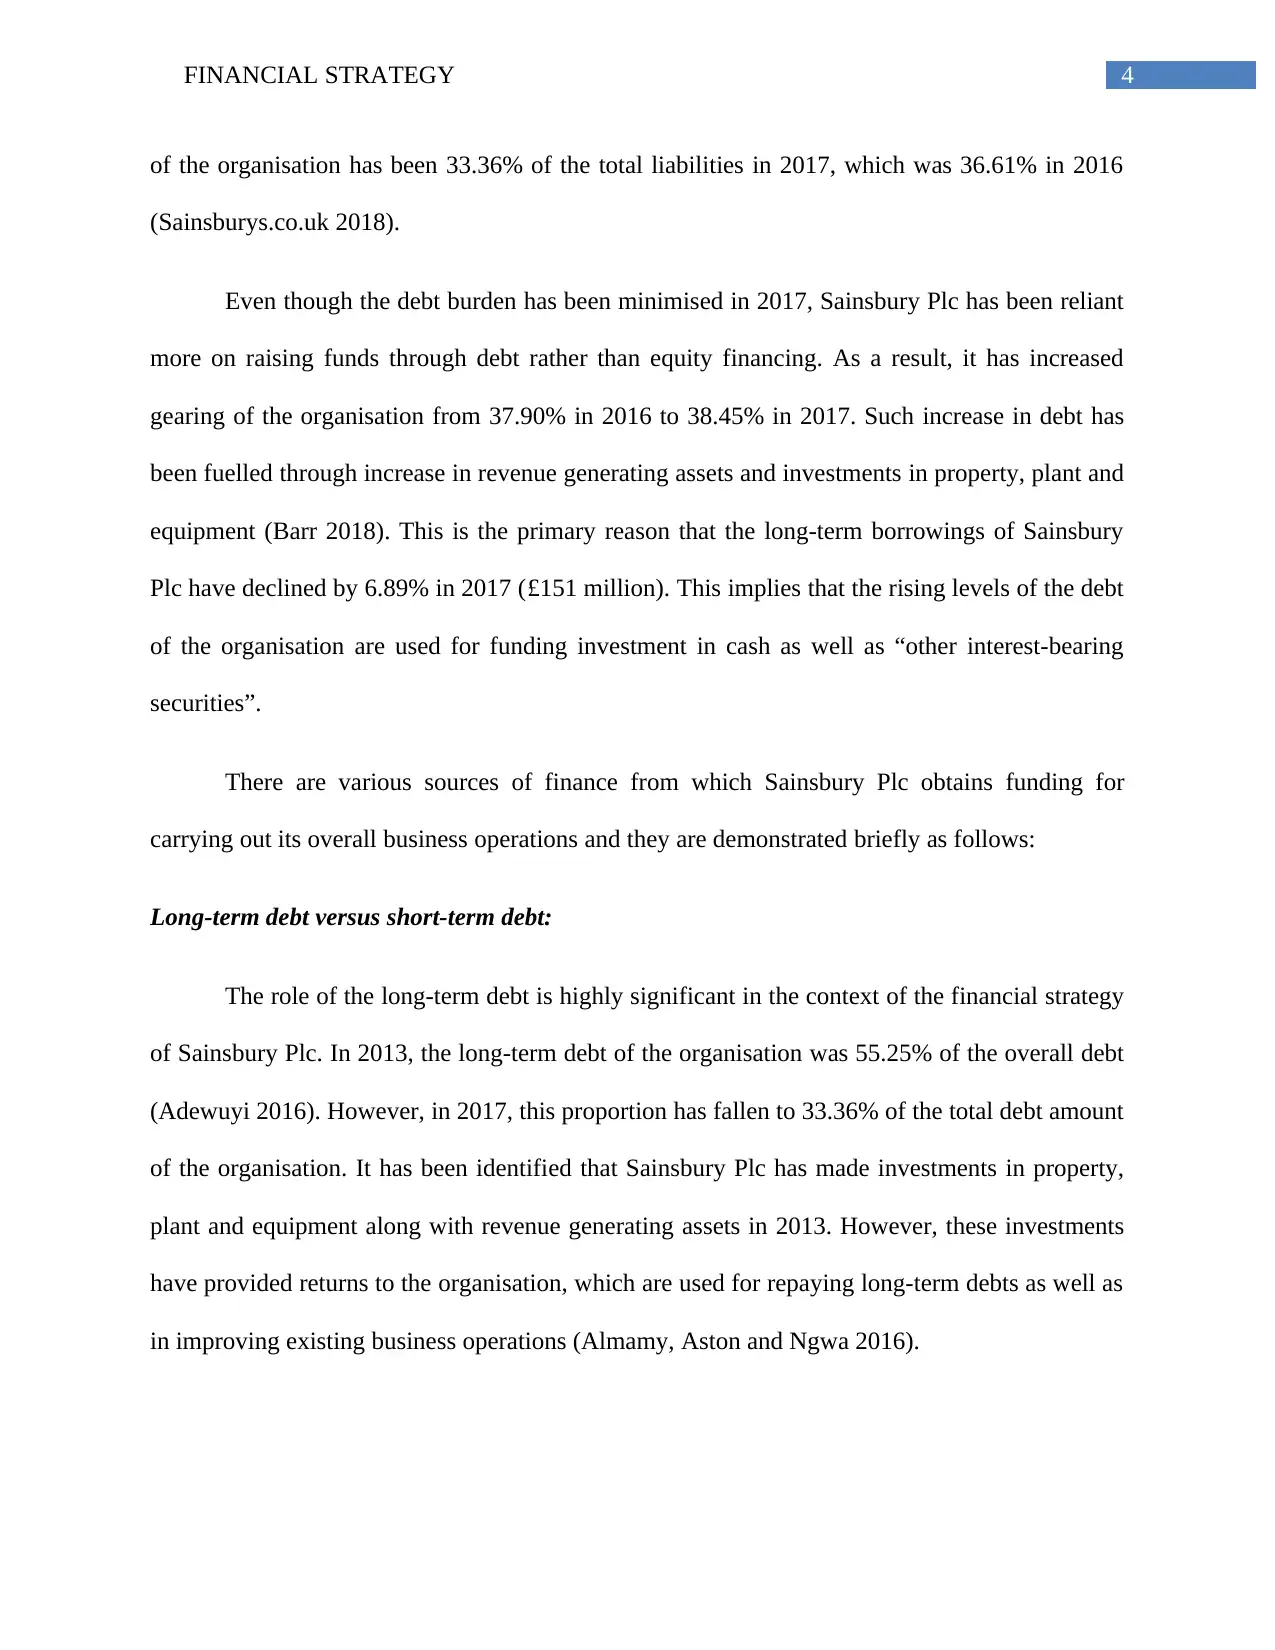
Figure 1: Long-term debt and short-term debt of Sainsbury Plc for the years 2013-2017
(Source: Sainsburys.co.uk 2018)
It is evident from the above figure that the long-term financial strategy of Sainsbury Plc
has provided the organisation with additional time and flexibility in repaying its debt. As a result,
the overall financial risk of the organisation is minimised (Buckland and Davis 2016). In
addition, this long-term policy has contributed in promoting the long-term stability of Sainsbury
Plc along with reducing the cost of capital of the organisation.
In addition, the declining use of long-term debt has contributed to the growth of
Sainsbury Plc in online sales and in-stores. Furthermore, the multi-channel sales growth has
enabled Sainsbury Plc in expanding its revenue streams along with assuring long-term
sustainability through minimisation of the business risk. This paves the path for investment in
emerging markets like China, while lower interest rates are locked in over the long-term (Casu
and Gall 2016).
2013 2014 2015 2016 2017
-
1,000
2,000
3,000
4,000
5,000
6,000
7,000
8,000
9,000
10,000
Long-term debt versus short-term debt
Current liabilities
Non-current liabilities
Figure 1: Long-term debt and short-term debt of Sainsbury Plc for the years 2013-2017
(Source: Sainsburys.co.uk 2018)
It is evident from the above figure that the long-term financial strategy of Sainsbury Plc
has provided the organisation with additional time and flexibility in repaying its debt. As a result,
the overall financial risk of the organisation is minimised (Buckland and Davis 2016). In
addition, this long-term policy has contributed in promoting the long-term stability of Sainsbury
Plc along with reducing the cost of capital of the organisation.
In addition, the declining use of long-term debt has contributed to the growth of
Sainsbury Plc in online sales and in-stores. Furthermore, the multi-channel sales growth has
enabled Sainsbury Plc in expanding its revenue streams along with assuring long-term
sustainability through minimisation of the business risk. This paves the path for investment in
emerging markets like China, while lower interest rates are locked in over the long-term (Casu
and Gall 2016).
⊘ This is a preview!⊘
Do you want full access?
Subscribe today to unlock all pages.
Trusted by 1+ million students worldwide
6FINANCIAL STRATEGY
Trade payables:
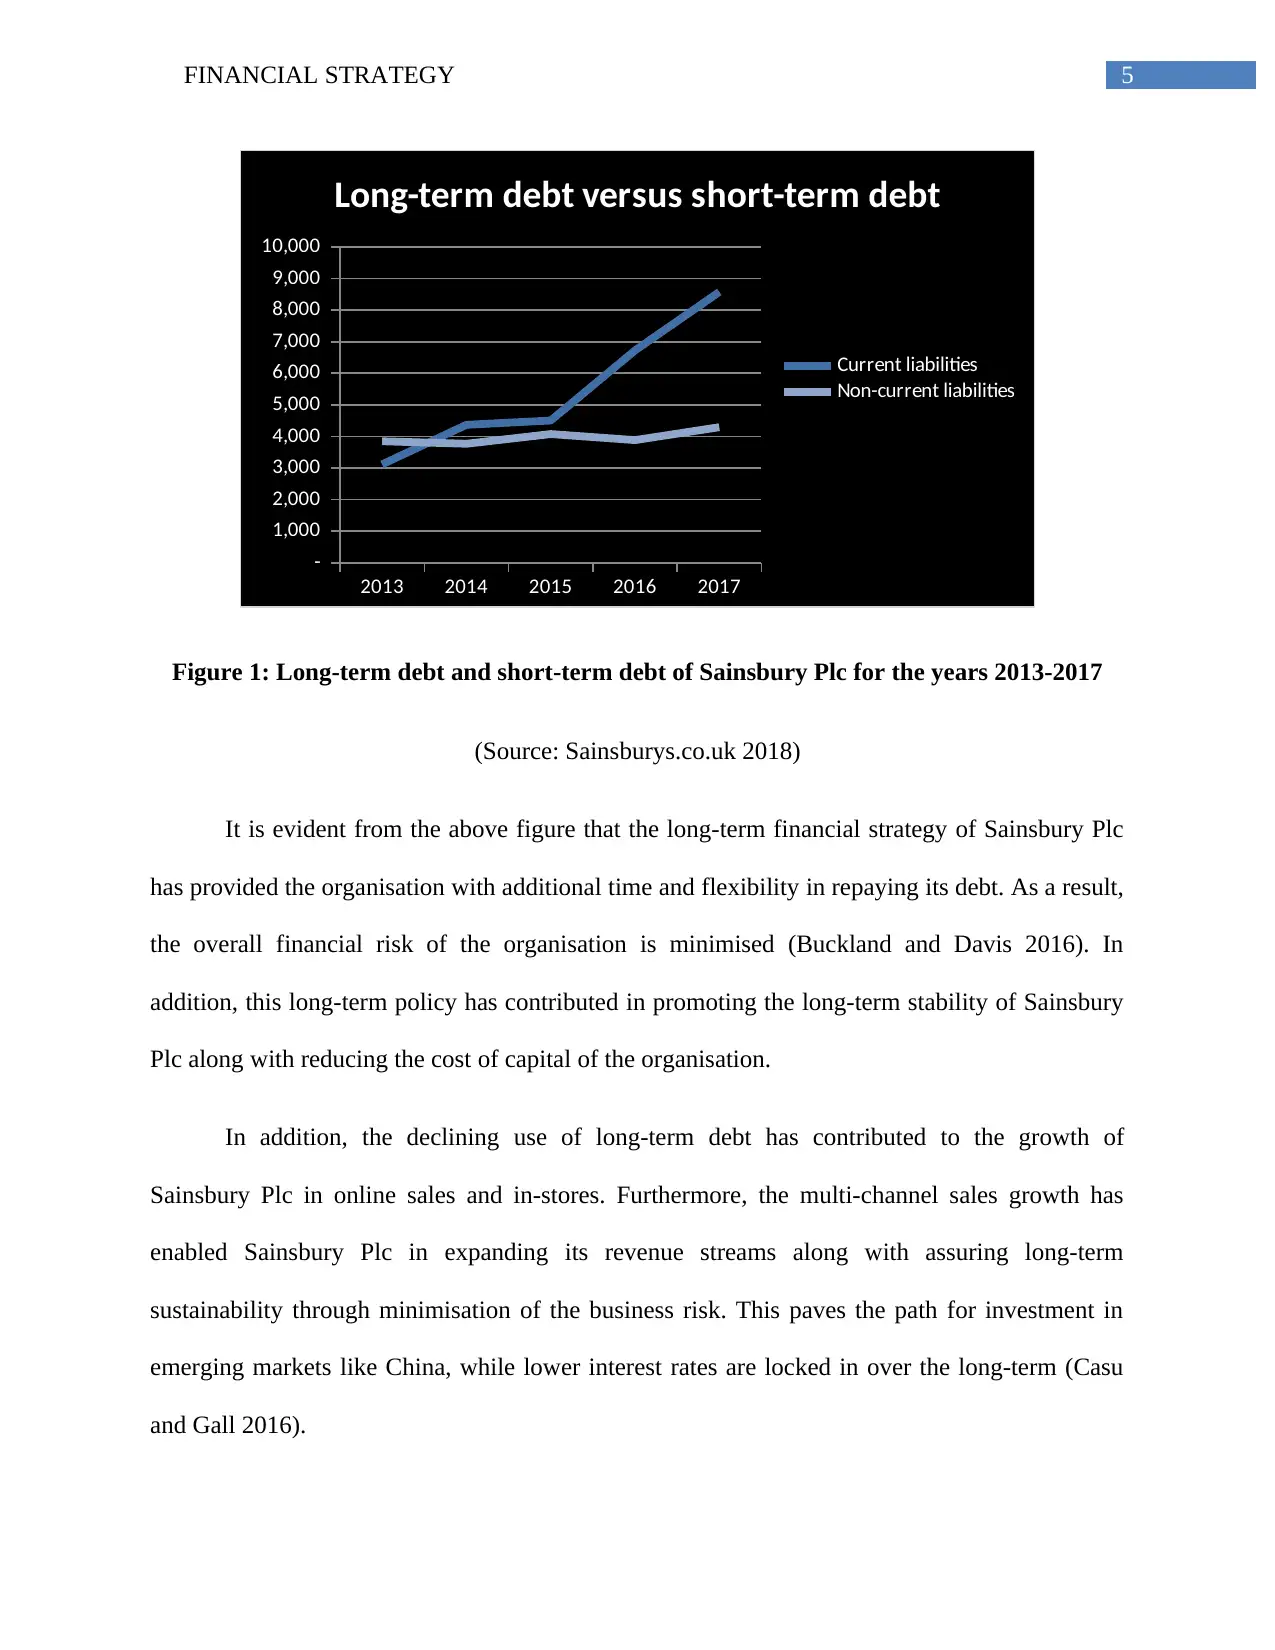
Figure 2: Growth in revenue and trade payables and trade payables as percent of revenue
of Sainsbury Plc for the years 2013-2017
(Source: Sainsburys.co.uk 2018)
As could be observed from the above figures, the growth in trade payables is more in
contrast to the overall revenue growth of Sainsbury Plc. However, in 2016, the organisation has
managed to pay a portion of its trade payables, as their growth has been more than that of
revenue in 2015. From that time, trade payables of the organisation have varied between 12.50%
and 14%. Such percentage is lower in contrast to Tesco Plc, the fierce competitor of the
organisation, since its trade payables have been 19% of revenue; however, it is greater than
Morrison’s Plc with 11.5% (Rahman 2015).
Trade payables:
Figure 2: Growth in revenue and trade payables and trade payables as percent of revenue
of Sainsbury Plc for the years 2013-2017
(Source: Sainsburys.co.uk 2018)
As could be observed from the above figures, the growth in trade payables is more in
contrast to the overall revenue growth of Sainsbury Plc. However, in 2016, the organisation has
managed to pay a portion of its trade payables, as their growth has been more than that of
revenue in 2015. From that time, trade payables of the organisation have varied between 12.50%
and 14%. Such percentage is lower in contrast to Tesco Plc, the fierce competitor of the
organisation, since its trade payables have been 19% of revenue; however, it is greater than
Morrison’s Plc with 11.5% (Rahman 2015).
Paraphrase This Document
Need a fresh take? Get an instant paraphrase of this document with our AI Paraphraser
7FINANCIAL STRATEGY
2013 2014 2015 2016 2017
40.00
42.00
44.00
46.00
48.00
50.00
52.00
45.29
43.83
45.72
49.97 50.60
Payables (in days)
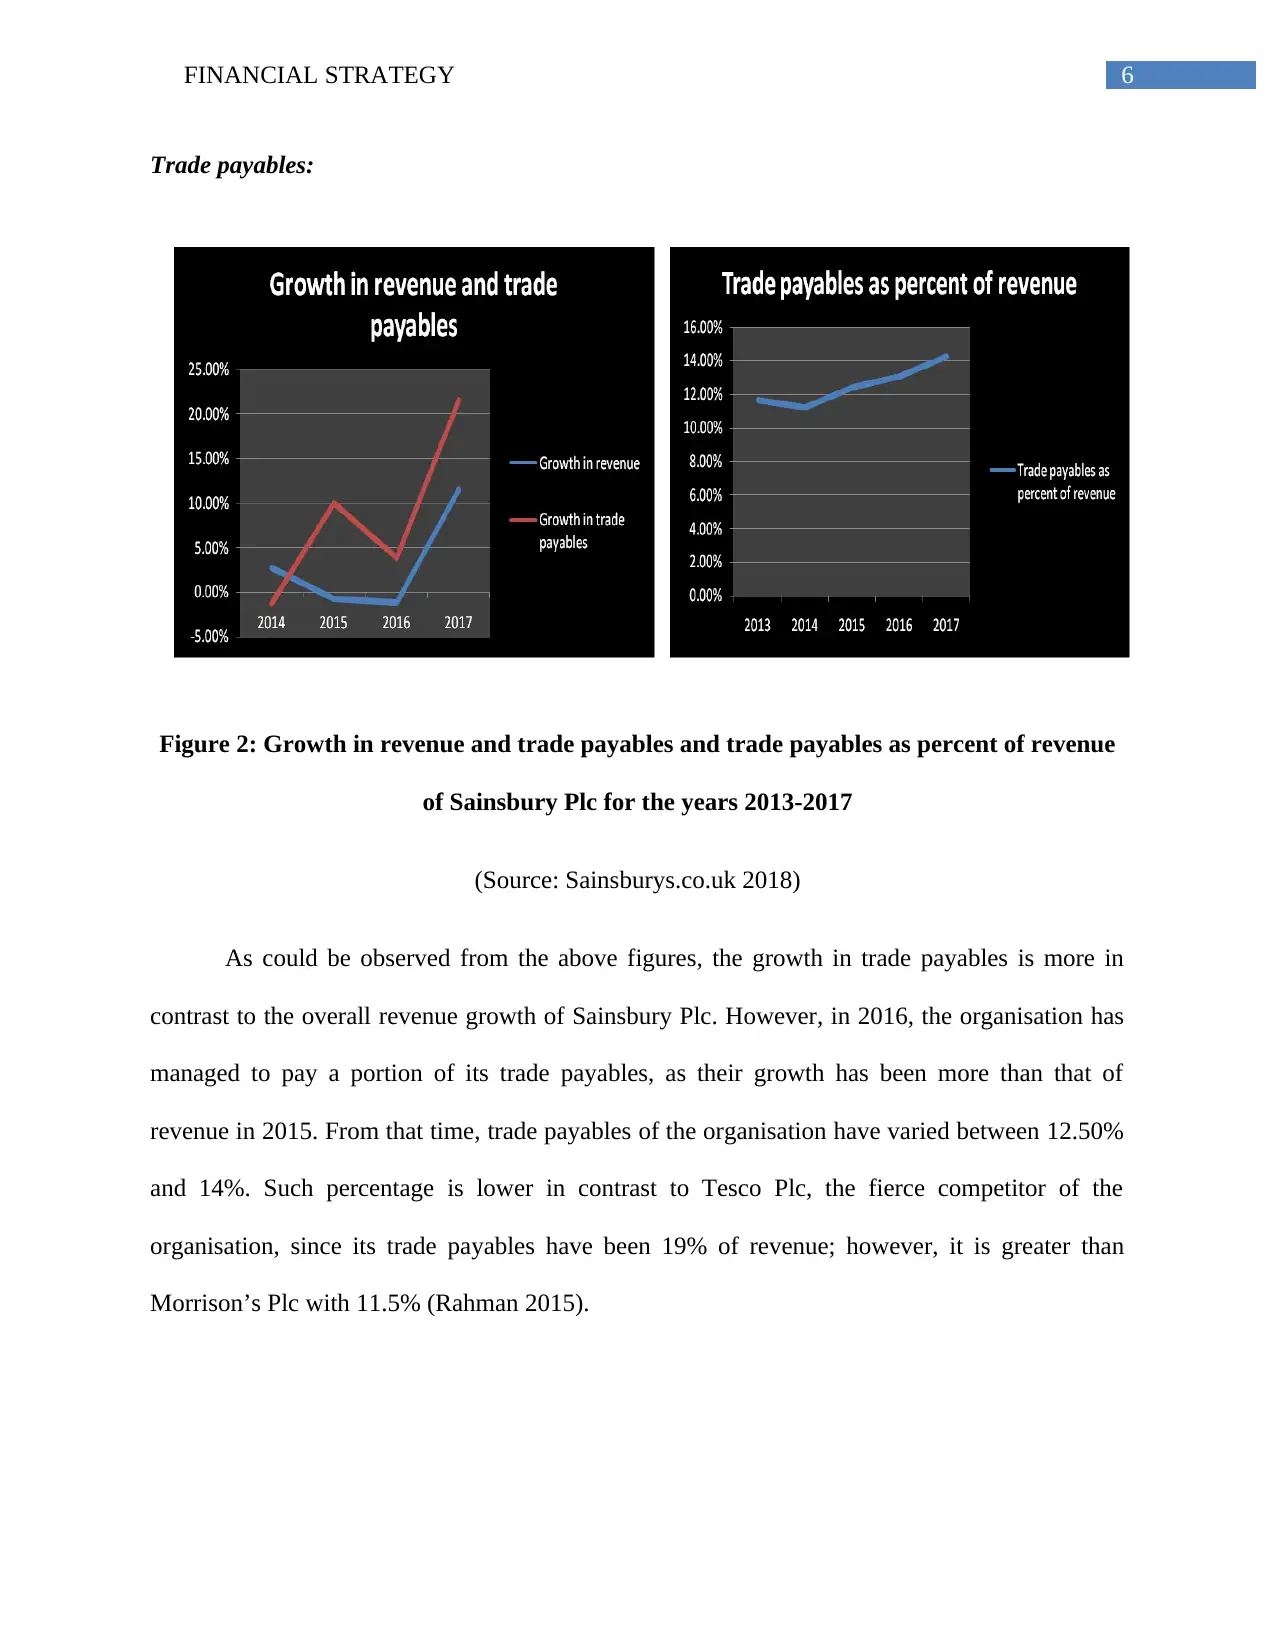
Figure 3: Payables (in days) of Sainsbury Plc over the years 2013-2017
(Source: Sainsburys.co.uk 2018)
In 2017, the trade payables in days have been 50.6 days in 2017, which have increased
from 49.97 days in 2016. Such increase would have negative impact on the financial flexibility
of Sainsbury Plc, since the staggers of market growth and trading conditions remain tough. In
case, this policy, if maintained, would have negative consequences on the long-term growth and
flexibility of the organisation (Damodaran 2016). Hence, it is crucial for Sainsbury Plc to ensure
that the trade payables do not increase over the long-term, since it would lead to increase in
overall financial risk of the organisation.
Debt versus equity:
In this section, the use of debt in proportion to equity as a source of funding has been
explained. This section would take into consideration the overall debt of Sainsbury that includes
deductions like cash and other interest bearing assets (Eccles, Krzus and Ribot 2015).
2013 2014 2015 2016 2017
40.00
42.00
44.00
46.00
48.00
50.00
52.00
45.29
43.83
45.72
49.97 50.60
Payables (in days)
Figure 3: Payables (in days) of Sainsbury Plc over the years 2013-2017
(Source: Sainsburys.co.uk 2018)
In 2017, the trade payables in days have been 50.6 days in 2017, which have increased
from 49.97 days in 2016. Such increase would have negative impact on the financial flexibility
of Sainsbury Plc, since the staggers of market growth and trading conditions remain tough. In
case, this policy, if maintained, would have negative consequences on the long-term growth and
flexibility of the organisation (Damodaran 2016). Hence, it is crucial for Sainsbury Plc to ensure
that the trade payables do not increase over the long-term, since it would lead to increase in
overall financial risk of the organisation.
Debt versus equity:
In this section, the use of debt in proportion to equity as a source of funding has been
explained. This section would take into consideration the overall debt of Sainsbury that includes
deductions like cash and other interest bearing assets (Eccles, Krzus and Ribot 2015).
8FINANCIAL STRATEGY
2013 2014 2015 2016 2017
-
2,000
4,000
6,000
8,000
10,000
12,000
14,000
6,961
8,139 8,580
10,608
12,865
5,734 6,005 5,539 6,365 6,872
Debt versus Equity
Total debt
Total equity
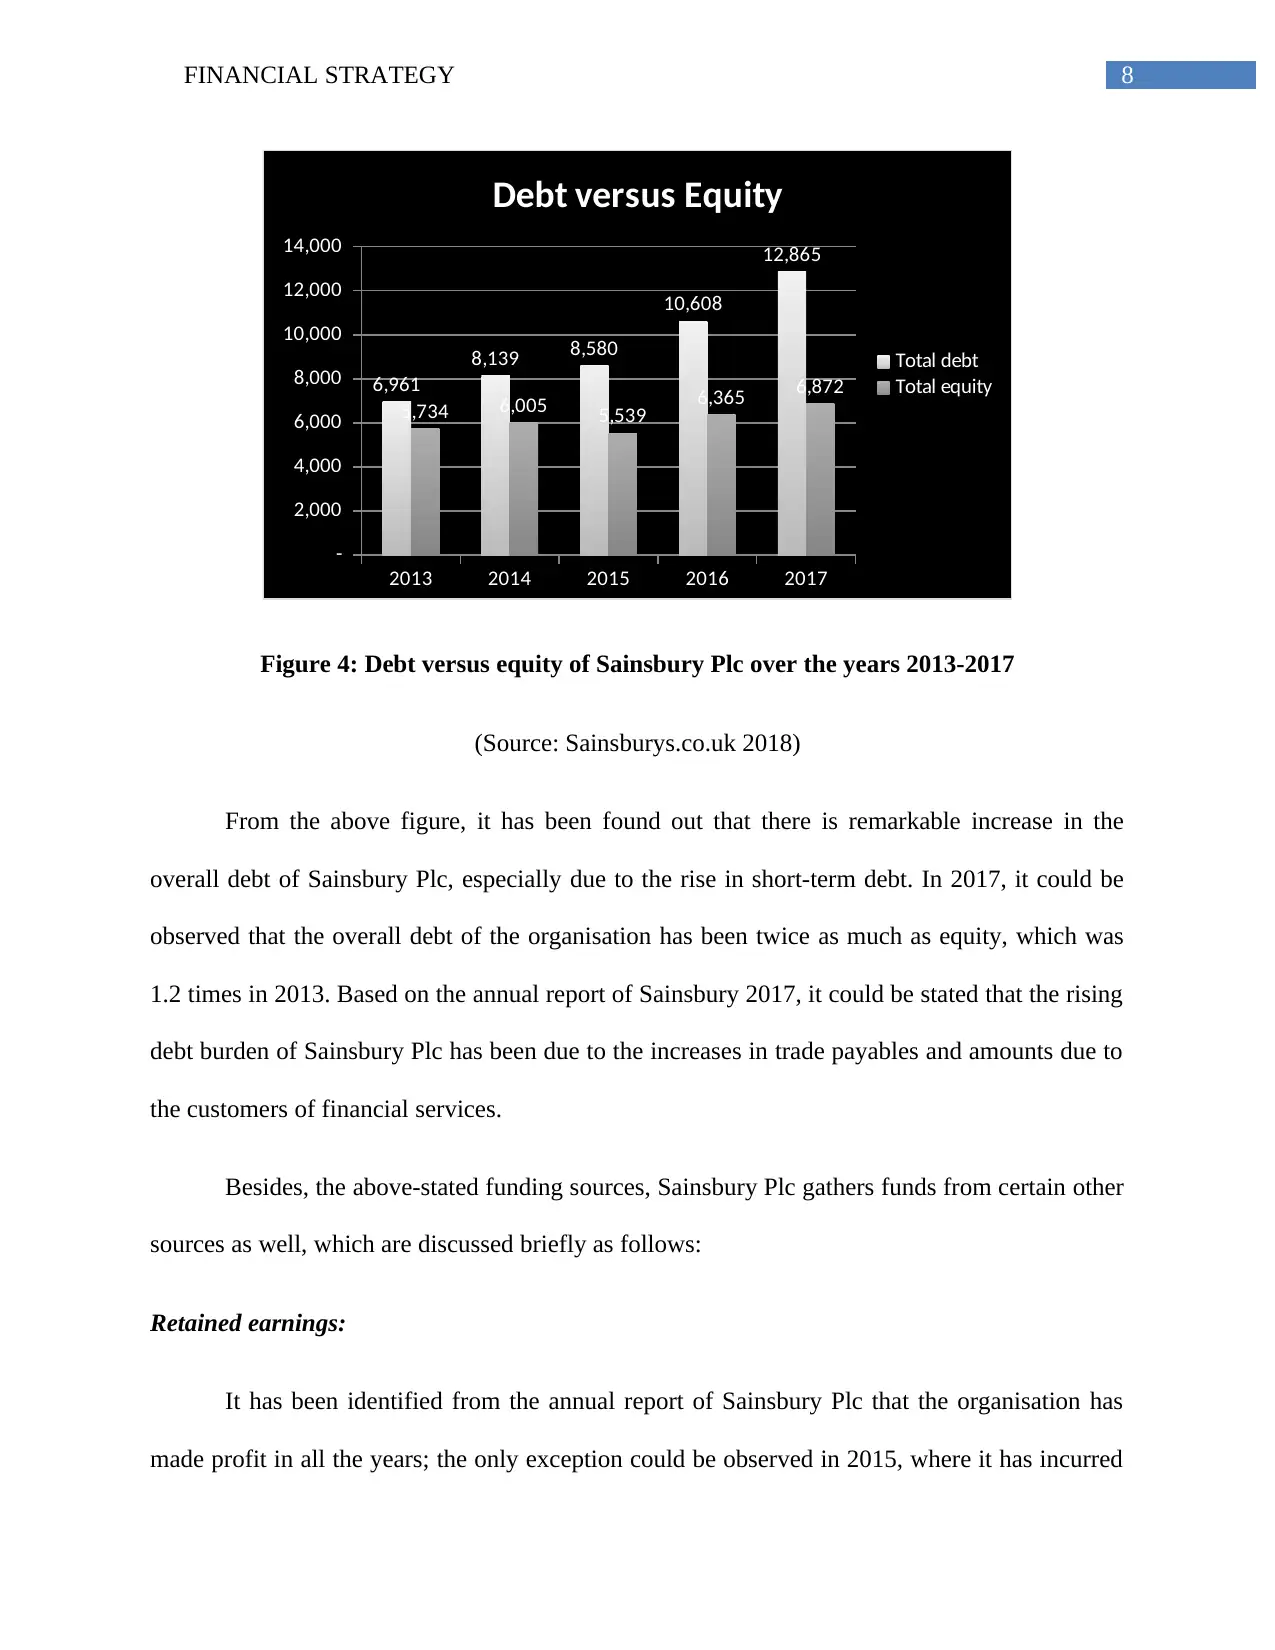
Figure 4: Debt versus equity of Sainsbury Plc over the years 2013-2017
(Source: Sainsburys.co.uk 2018)
From the above figure, it has been found out that there is remarkable increase in the
overall debt of Sainsbury Plc, especially due to the rise in short-term debt. In 2017, it could be
observed that the overall debt of the organisation has been twice as much as equity, which was
1.2 times in 2013. Based on the annual report of Sainsbury 2017, it could be stated that the rising
debt burden of Sainsbury Plc has been due to the increases in trade payables and amounts due to
the customers of financial services.
Besides, the above-stated funding sources, Sainsbury Plc gathers funds from certain other
sources as well, which are discussed briefly as follows:
Retained earnings:
It has been identified from the annual report of Sainsbury Plc that the organisation has
made profit in all the years; the only exception could be observed in 2015, where it has incurred
2013 2014 2015 2016 2017
-
2,000
4,000
6,000
8,000
10,000
12,000
14,000
6,961
8,139 8,580
10,608
12,865
5,734 6,005 5,539 6,365 6,872
Debt versus Equity
Total debt
Total equity
Figure 4: Debt versus equity of Sainsbury Plc over the years 2013-2017
(Source: Sainsburys.co.uk 2018)
From the above figure, it has been found out that there is remarkable increase in the
overall debt of Sainsbury Plc, especially due to the rise in short-term debt. In 2017, it could be
observed that the overall debt of the organisation has been twice as much as equity, which was
1.2 times in 2013. Based on the annual report of Sainsbury 2017, it could be stated that the rising
debt burden of Sainsbury Plc has been due to the increases in trade payables and amounts due to
the customers of financial services.
Besides, the above-stated funding sources, Sainsbury Plc gathers funds from certain other
sources as well, which are discussed briefly as follows:
Retained earnings:
It has been identified from the annual report of Sainsbury Plc that the organisation has
made profit in all the years; the only exception could be observed in 2015, where it has incurred
⊘ This is a preview!⊘
Do you want full access?
Subscribe today to unlock all pages.
Trusted by 1+ million students worldwide
9FINANCIAL STRATEGY
net loss. Hence, it could be stated that the organisation has maintained profitability over the
years, which are used as a source of funding for improving the existing business operations
(Haleem and Jehangir 2017). This denotes that the organisation has adequate amount of cash
base available. However, as argued by Maynard (2017), this might not be feasible, since
Sainsbury pays a major portion of its earnings in the form of dividends and the remaining money
is saved for future investments.
Working capital:
In order to accumulate money for investment, Sainsbury Plc often minimises its level of
stock or improves its future control. In addition, it has developed policies so that it could collect
the debtors’ amount within limited timeframe and payments are made to the creditors lately. This
policy has helped the organisation in saving additional cash that are used for funding new assets
or business operations (Metzger 2014).
Sale of fixed assets:
This would rely on the selling price of the assets and the organisation might be able to
sell the surplus or the special leasing company might sell the existing assets (Scott 2015). With
the help of the amount collected, Sainsbury Plc sometimes funds its new operations for including
additional product lines in in-stores.
Preferred stock:
In the words of Finkler et al. (2016), the preferred stock comprises of both shares of
common equity and debt. These shares are termed as preferred, since their priority is more
compared to the shares of common equity in relation to dividend payment and capital during
Paraphrase This Document
Need a fresh take? Get an instant paraphrase of this document with our AI Paraphraser
10FINANCIAL STRATEGY
business liquidation. Sainsbury Plc sometimes issues a special type of preferred shares, which
are termed as cumulative preferred shares and the dividends are collected until the payment is
not made. This type of payment could be delayed, which provides an opportunity to Sainsbury
Plc to raise funds from the market for funding its new projects or improving the existing ones.
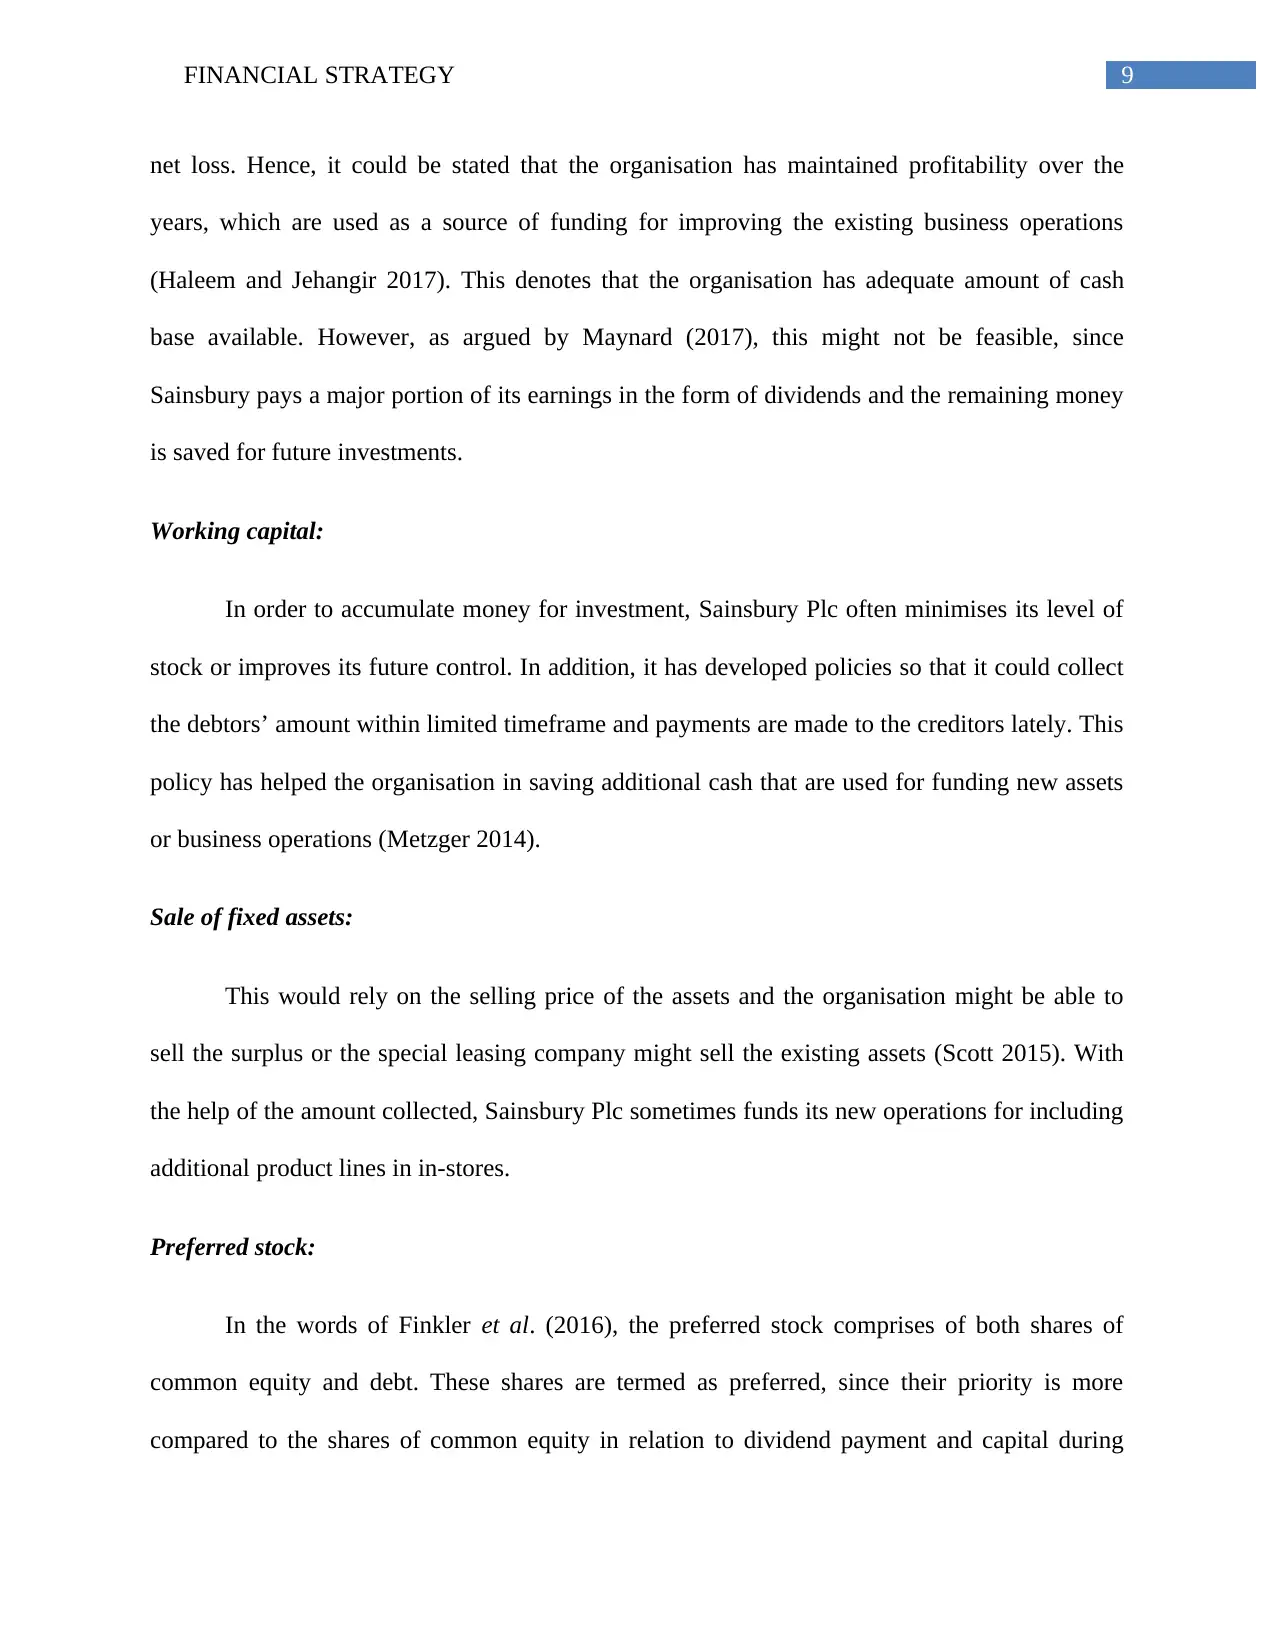
Implications on the gearing position of Sainsbury Plc:
Particulars 2013 2014 2015 2016 2017
Non-current liabilities 3,846
3,77
0
4,07
5
3,88
4
4,29
2
Total equity 5,734
6,00
5
5,53
9
6,36
5
6,87
2
Gearing ratio 40.15% 38.57% 42.39% 37.90% 38.45%
Table 1: Gearing ratio of Sainsbury Plc for the years 2013-2017
(Source: Sainsburys.co.uk 2018)
business liquidation. Sainsbury Plc sometimes issues a special type of preferred shares, which
are termed as cumulative preferred shares and the dividends are collected until the payment is
not made. This type of payment could be delayed, which provides an opportunity to Sainsbury
Plc to raise funds from the market for funding its new projects or improving the existing ones.
Implications on the gearing position of Sainsbury Plc:
Particulars 2013 2014 2015 2016 2017
Non-current liabilities 3,846
3,77
0
4,07
5
3,88
4
4,29
2
Total equity 5,734
6,00
5
5,53
9
6,36
5
6,87
2
Gearing ratio 40.15% 38.57% 42.39% 37.90% 38.45%
Table 1: Gearing ratio of Sainsbury Plc for the years 2013-2017
(Source: Sainsburys.co.uk 2018)
11FINANCIAL STRATEGY
2013 2014 2015 2016 2017
35.00%
36.00%
37.00%
38.00%
39.00%
40.00%
41.00%
42.00%
43.00%
40.15%
38.57%
42.39%
37.90%
38.45%
Gearing ratio
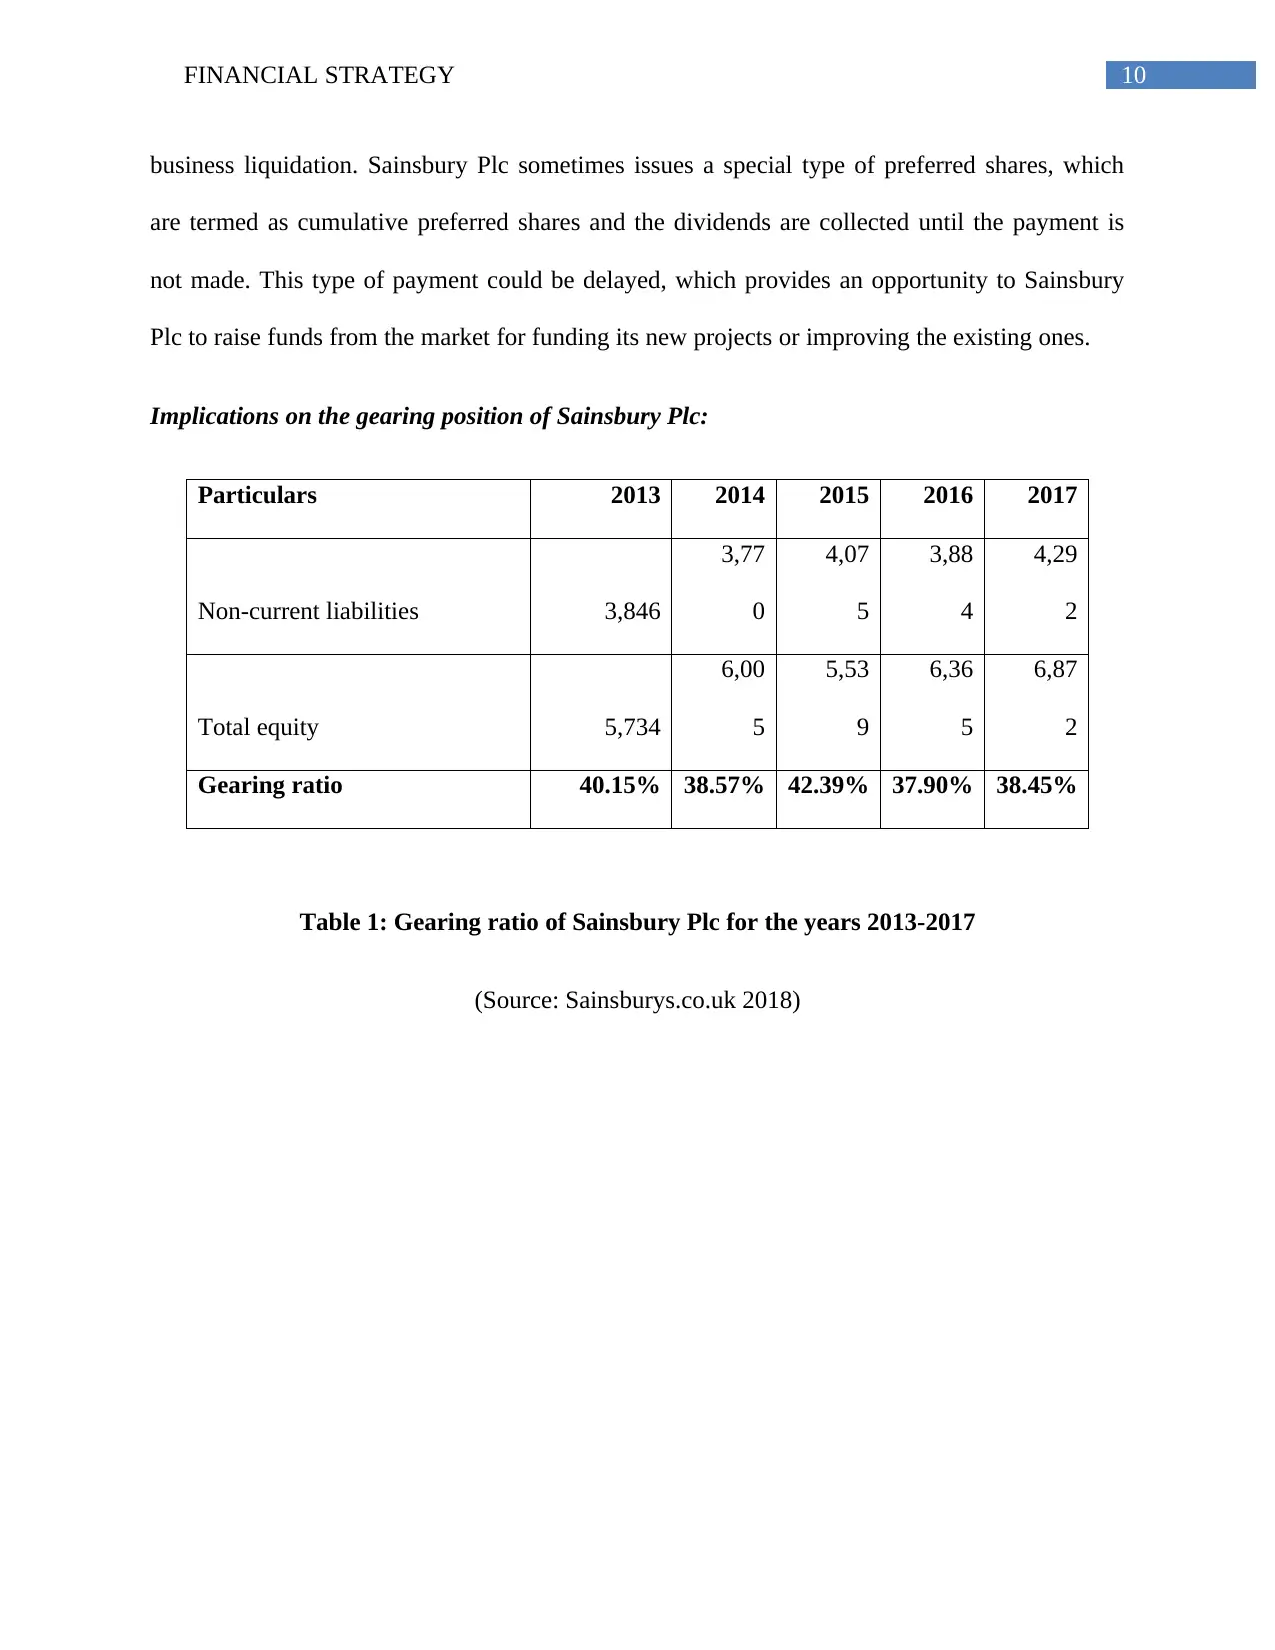
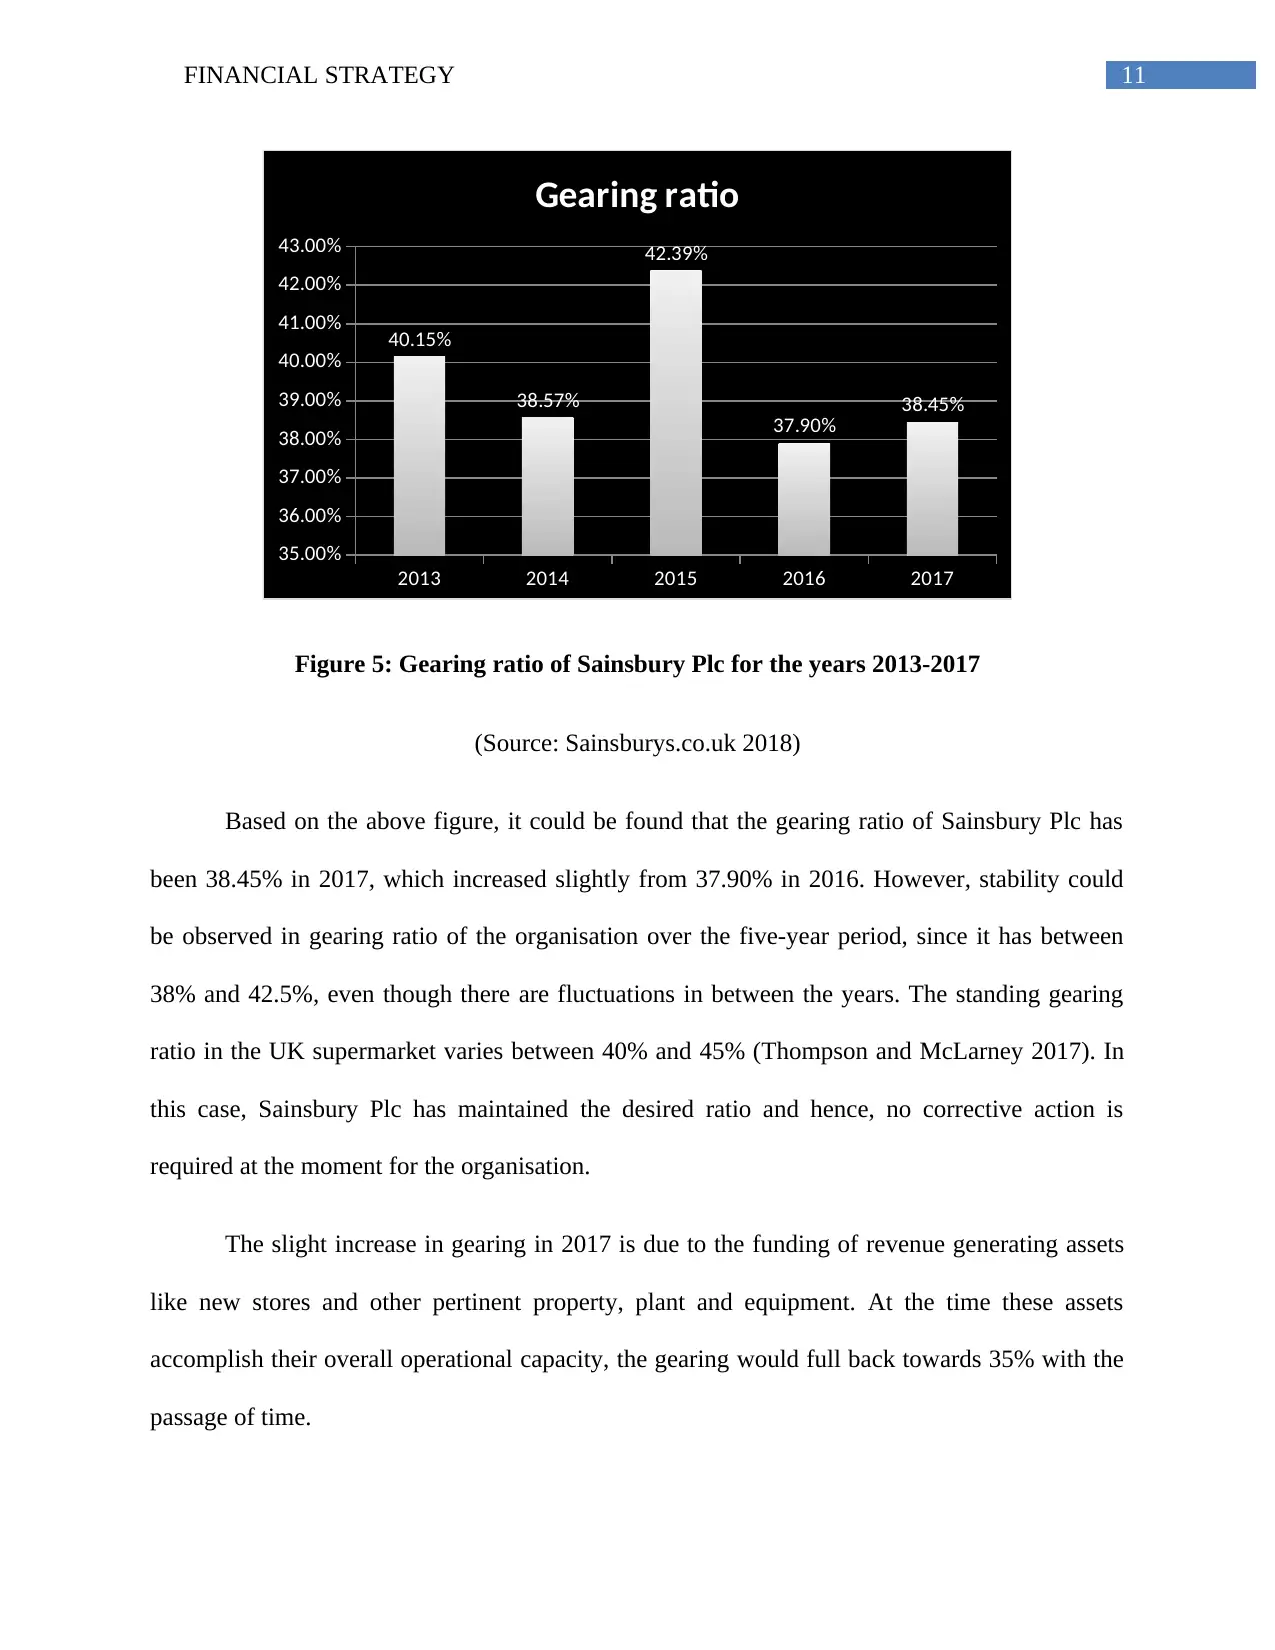
Figure 5: Gearing ratio of Sainsbury Plc for the years 2013-2017
(Source: Sainsburys.co.uk 2018)
Based on the above figure, it could be found that the gearing ratio of Sainsbury Plc has
been 38.45% in 2017, which increased slightly from 37.90% in 2016. However, stability could
be observed in gearing ratio of the organisation over the five-year period, since it has between
38% and 42.5%, even though there are fluctuations in between the years. The standing gearing
ratio in the UK supermarket varies between 40% and 45% (Thompson and McLarney 2017). In
this case, Sainsbury Plc has maintained the desired ratio and hence, no corrective action is
required at the moment for the organisation.
The slight increase in gearing in 2017 is due to the funding of revenue generating assets
like new stores and other pertinent property, plant and equipment. At the time these assets
accomplish their overall operational capacity, the gearing would full back towards 35% with the
passage of time.
2013 2014 2015 2016 2017
35.00%
36.00%
37.00%
38.00%
39.00%
40.00%
41.00%
42.00%
43.00%
40.15%
38.57%
42.39%
37.90%
38.45%
Gearing ratio
Figure 5: Gearing ratio of Sainsbury Plc for the years 2013-2017
(Source: Sainsburys.co.uk 2018)
Based on the above figure, it could be found that the gearing ratio of Sainsbury Plc has
been 38.45% in 2017, which increased slightly from 37.90% in 2016. However, stability could
be observed in gearing ratio of the organisation over the five-year period, since it has between
38% and 42.5%, even though there are fluctuations in between the years. The standing gearing
ratio in the UK supermarket varies between 40% and 45% (Thompson and McLarney 2017). In
this case, Sainsbury Plc has maintained the desired ratio and hence, no corrective action is
required at the moment for the organisation.
The slight increase in gearing in 2017 is due to the funding of revenue generating assets
like new stores and other pertinent property, plant and equipment. At the time these assets
accomplish their overall operational capacity, the gearing would full back towards 35% with the
passage of time.
⊘ This is a preview!⊘
Do you want full access?
Subscribe today to unlock all pages.
Trusted by 1+ million students worldwide
1 out of 24
Related Documents


Your All-in-One AI-Powered Toolkit for Academic Success.
+13062052269
info@desklib.com
Available 24*7 on WhatsApp / Email
![[object Object]](/_next/static/media/star-bottom.7253800d.svg)
Unlock your academic potential
Copyright © 2020–2026 A2Z Services. All Rights Reserved. Developed and managed by ZUCOL.