Financial Analysis of Sainsbury and Tesco: Performance Evaluation
VerifiedAdded on  2021/02/19
|27
|5865
|58
Report
AI Summary
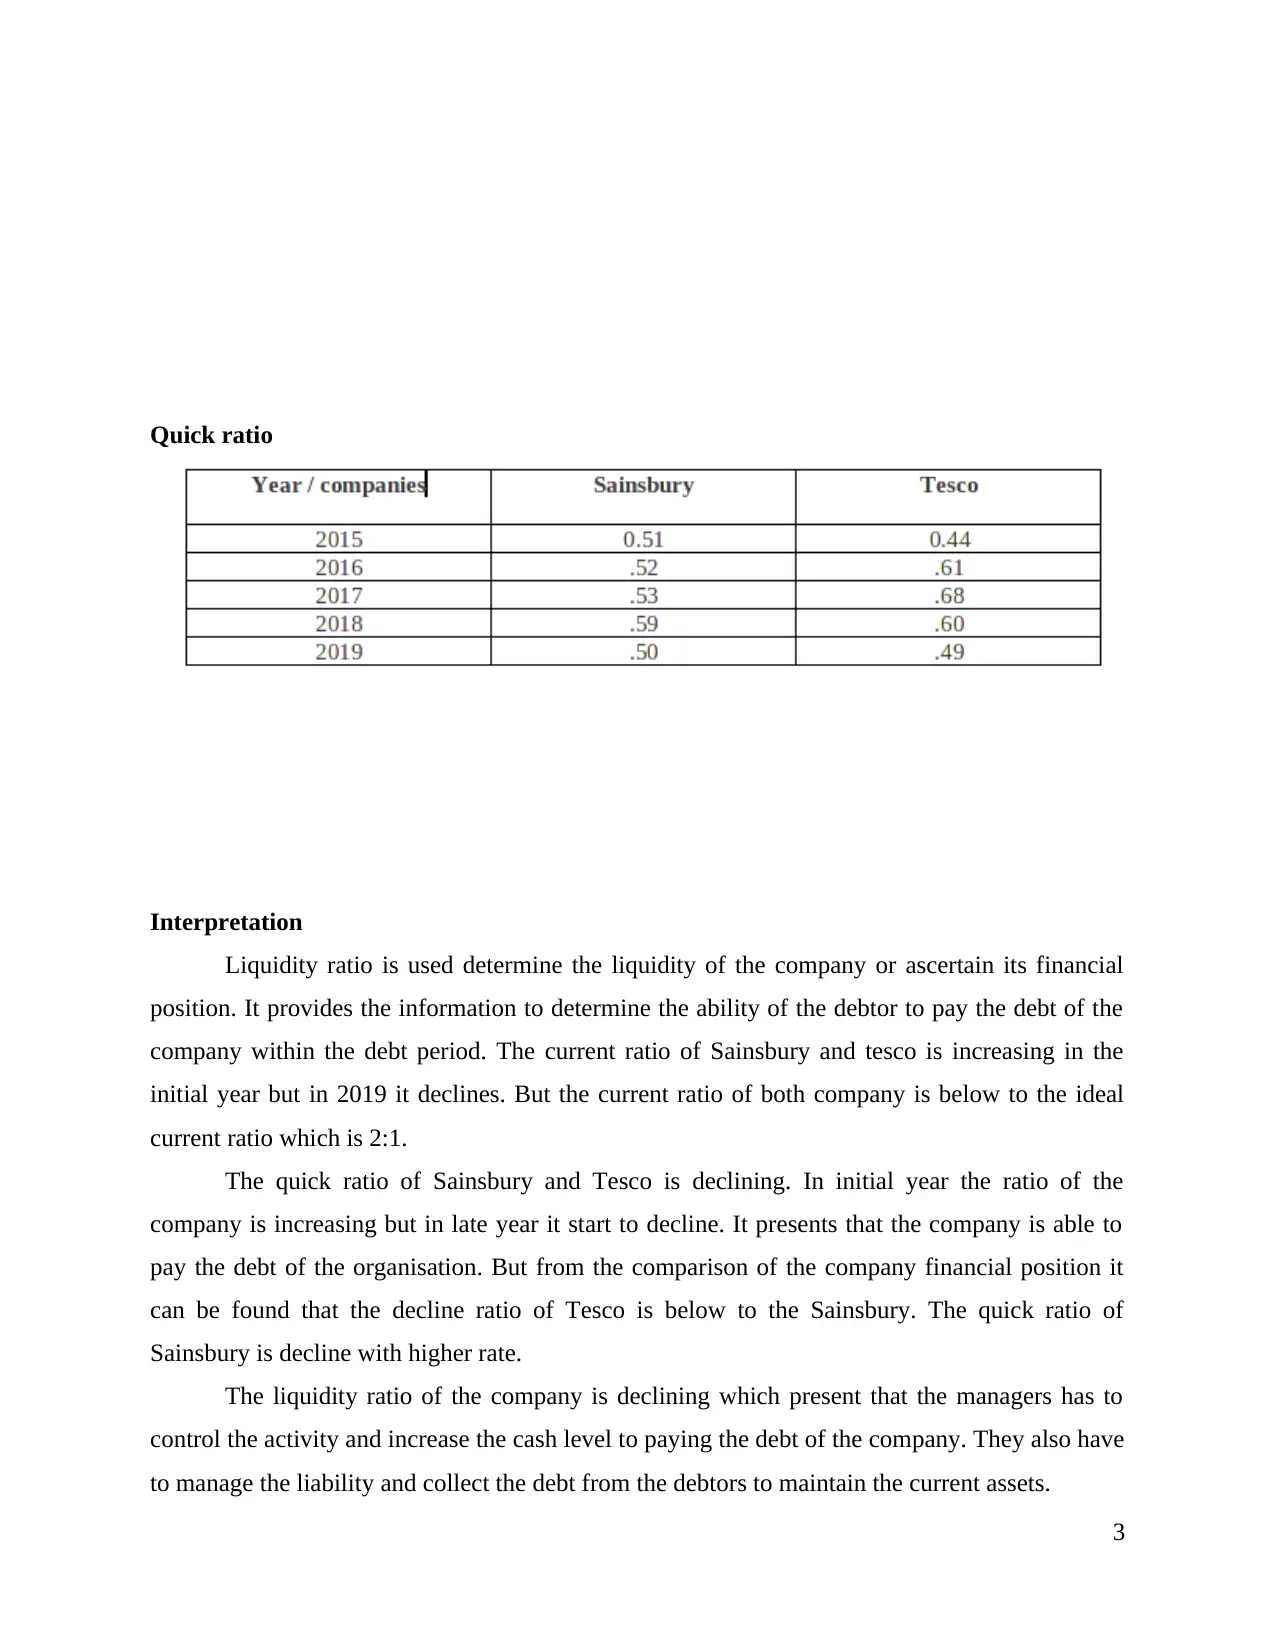
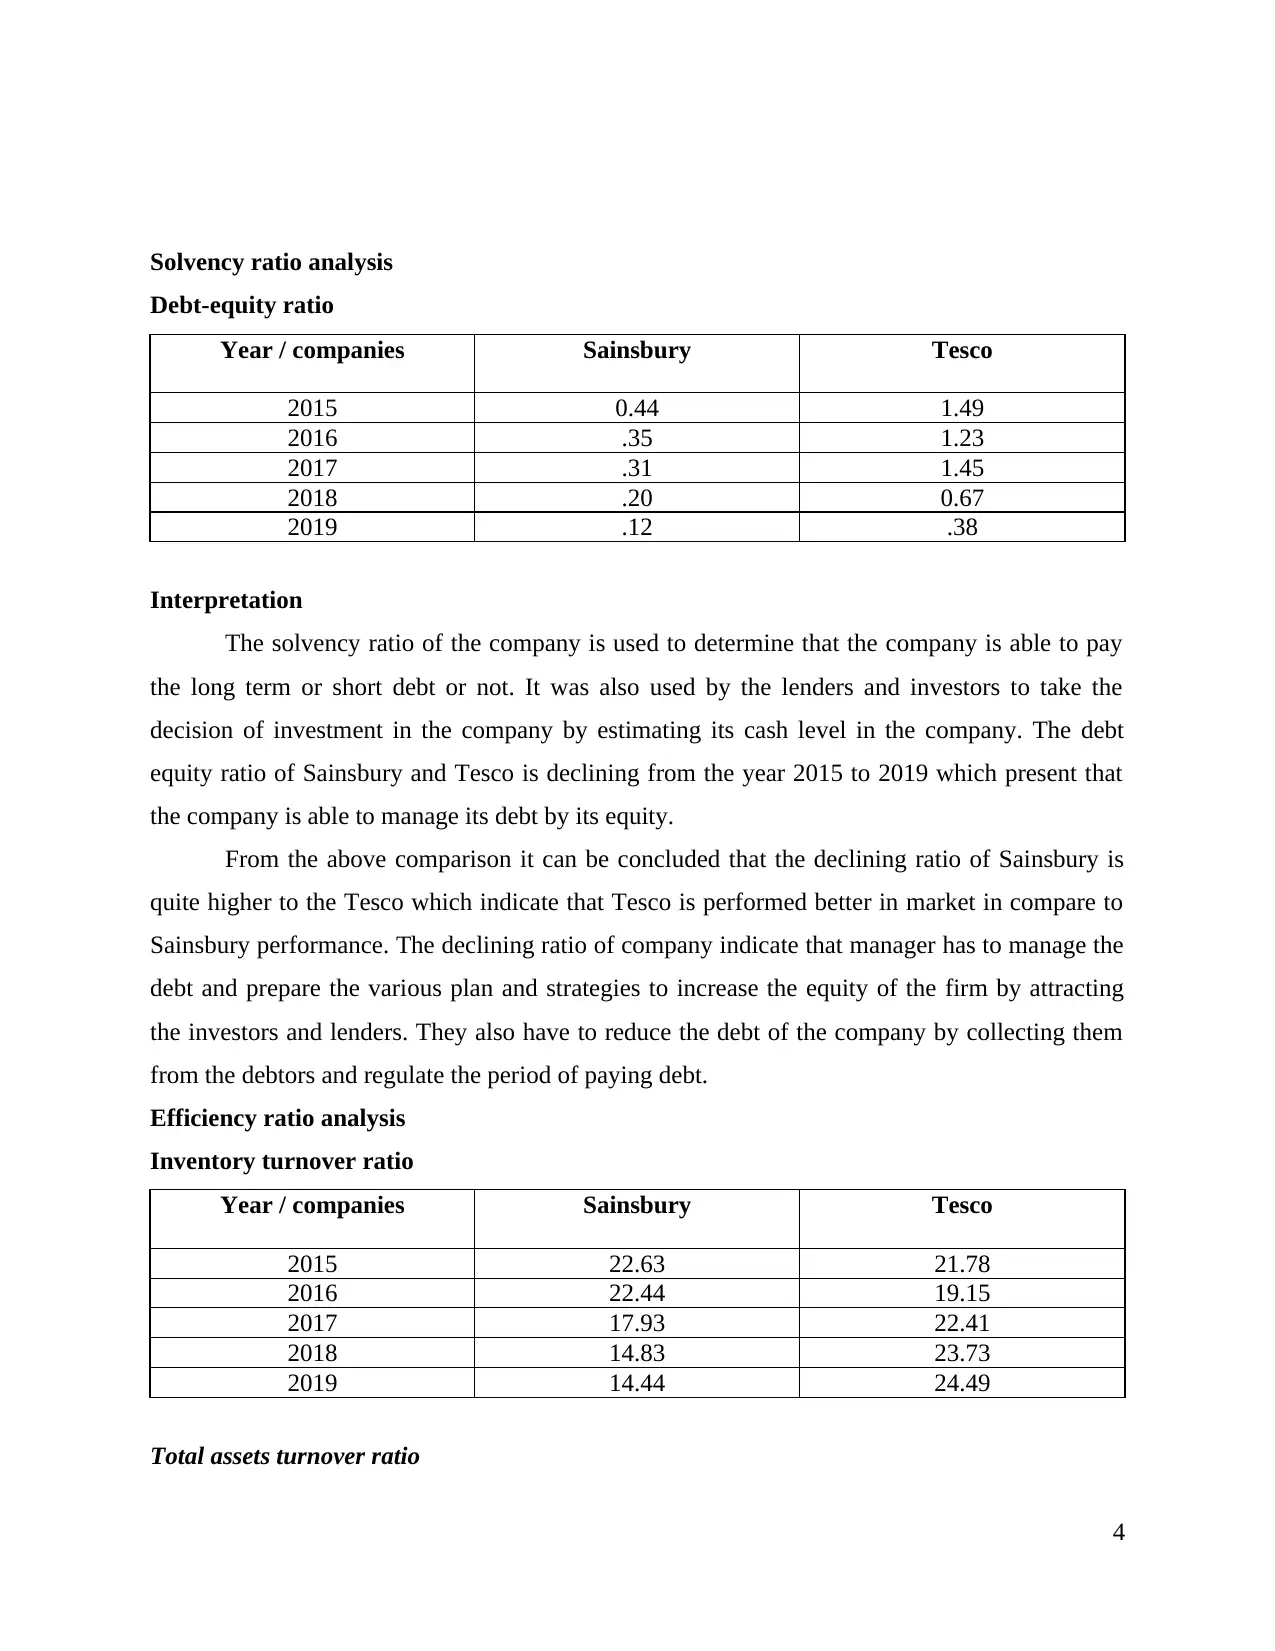
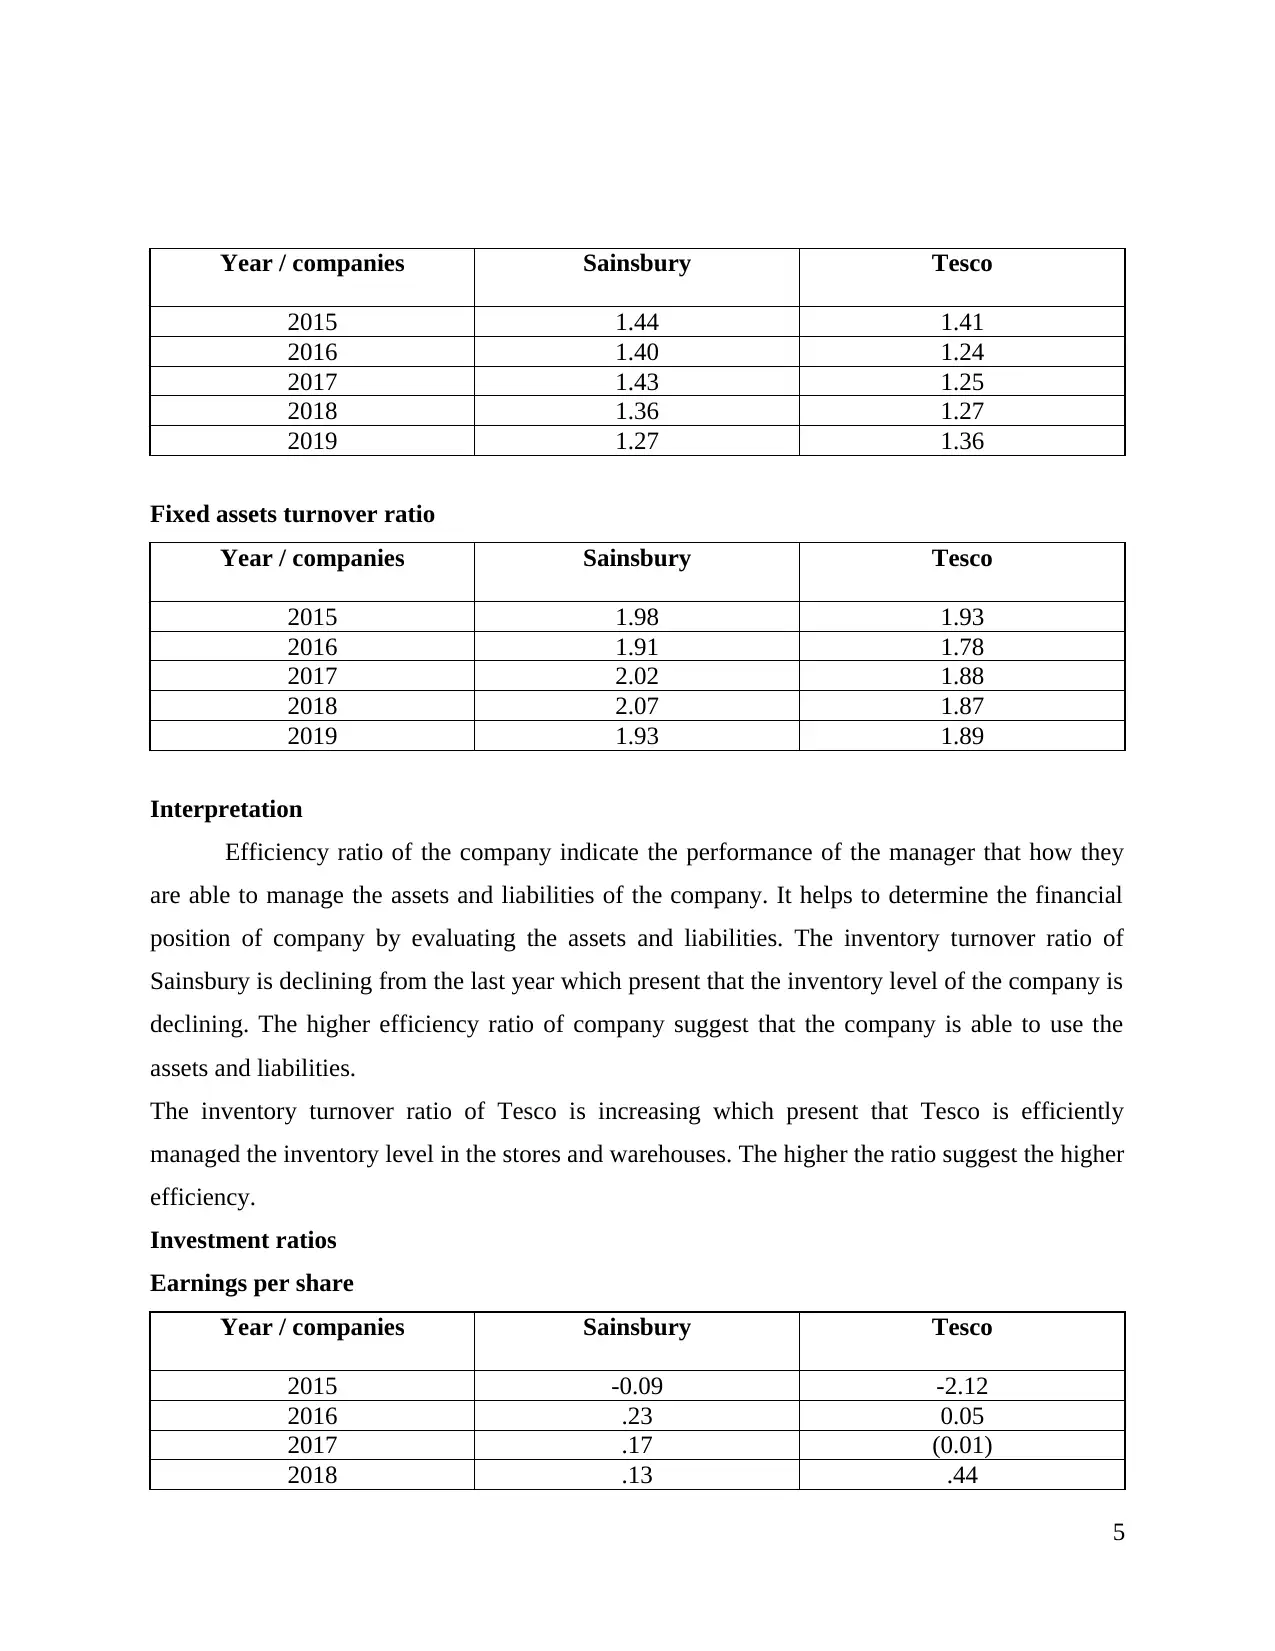
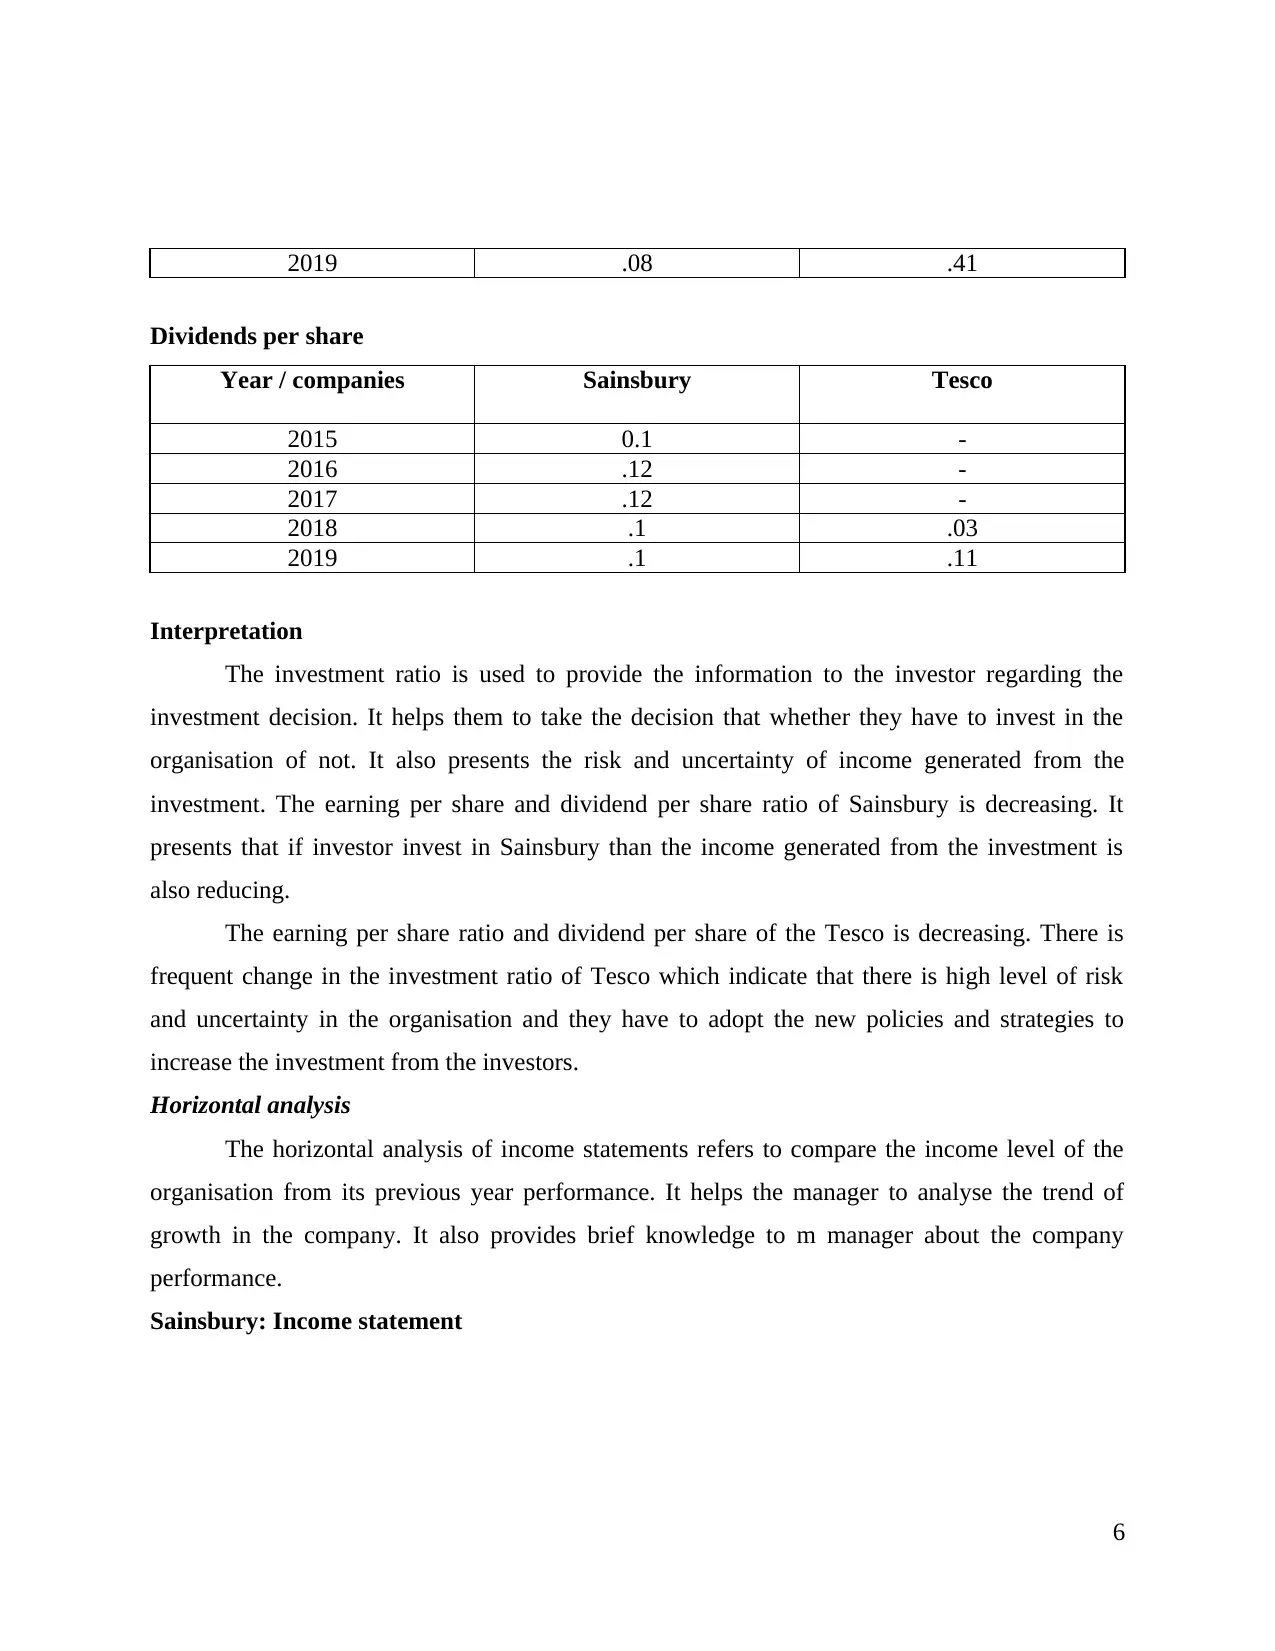
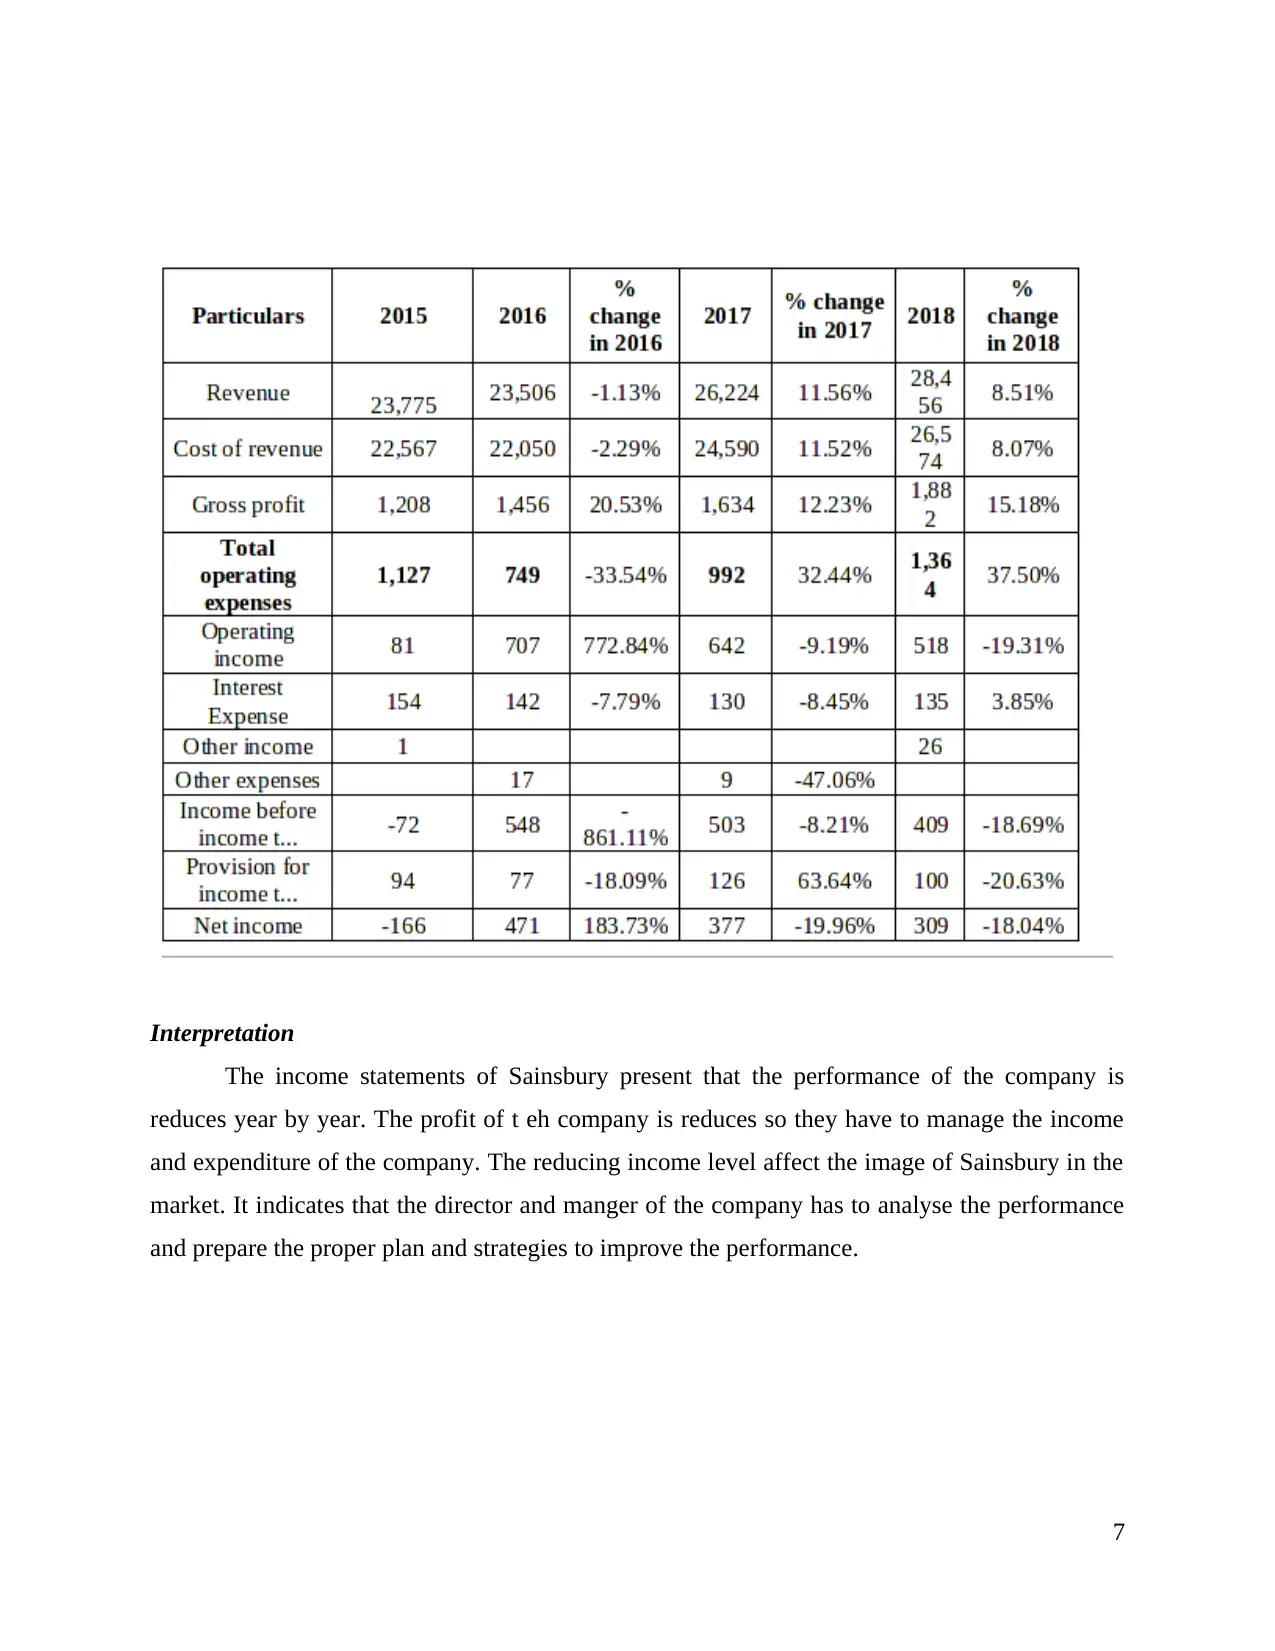
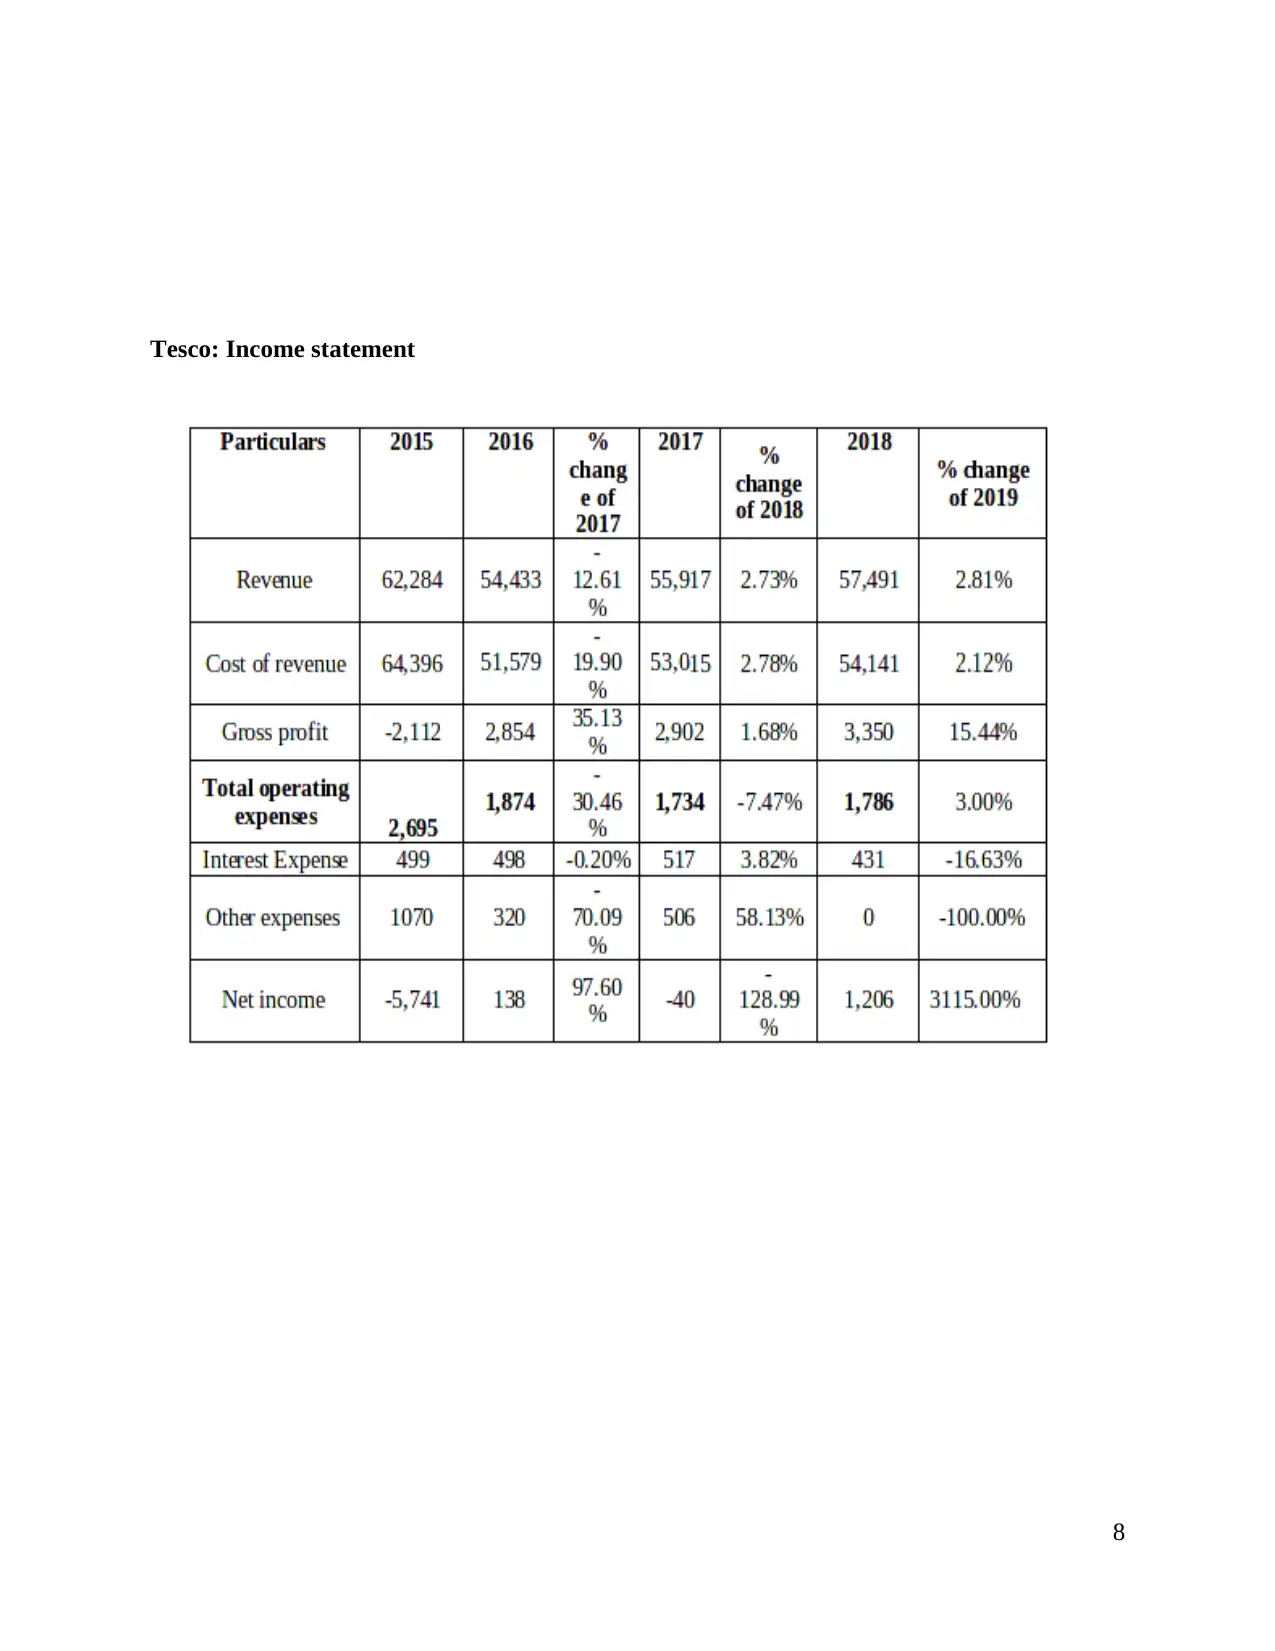
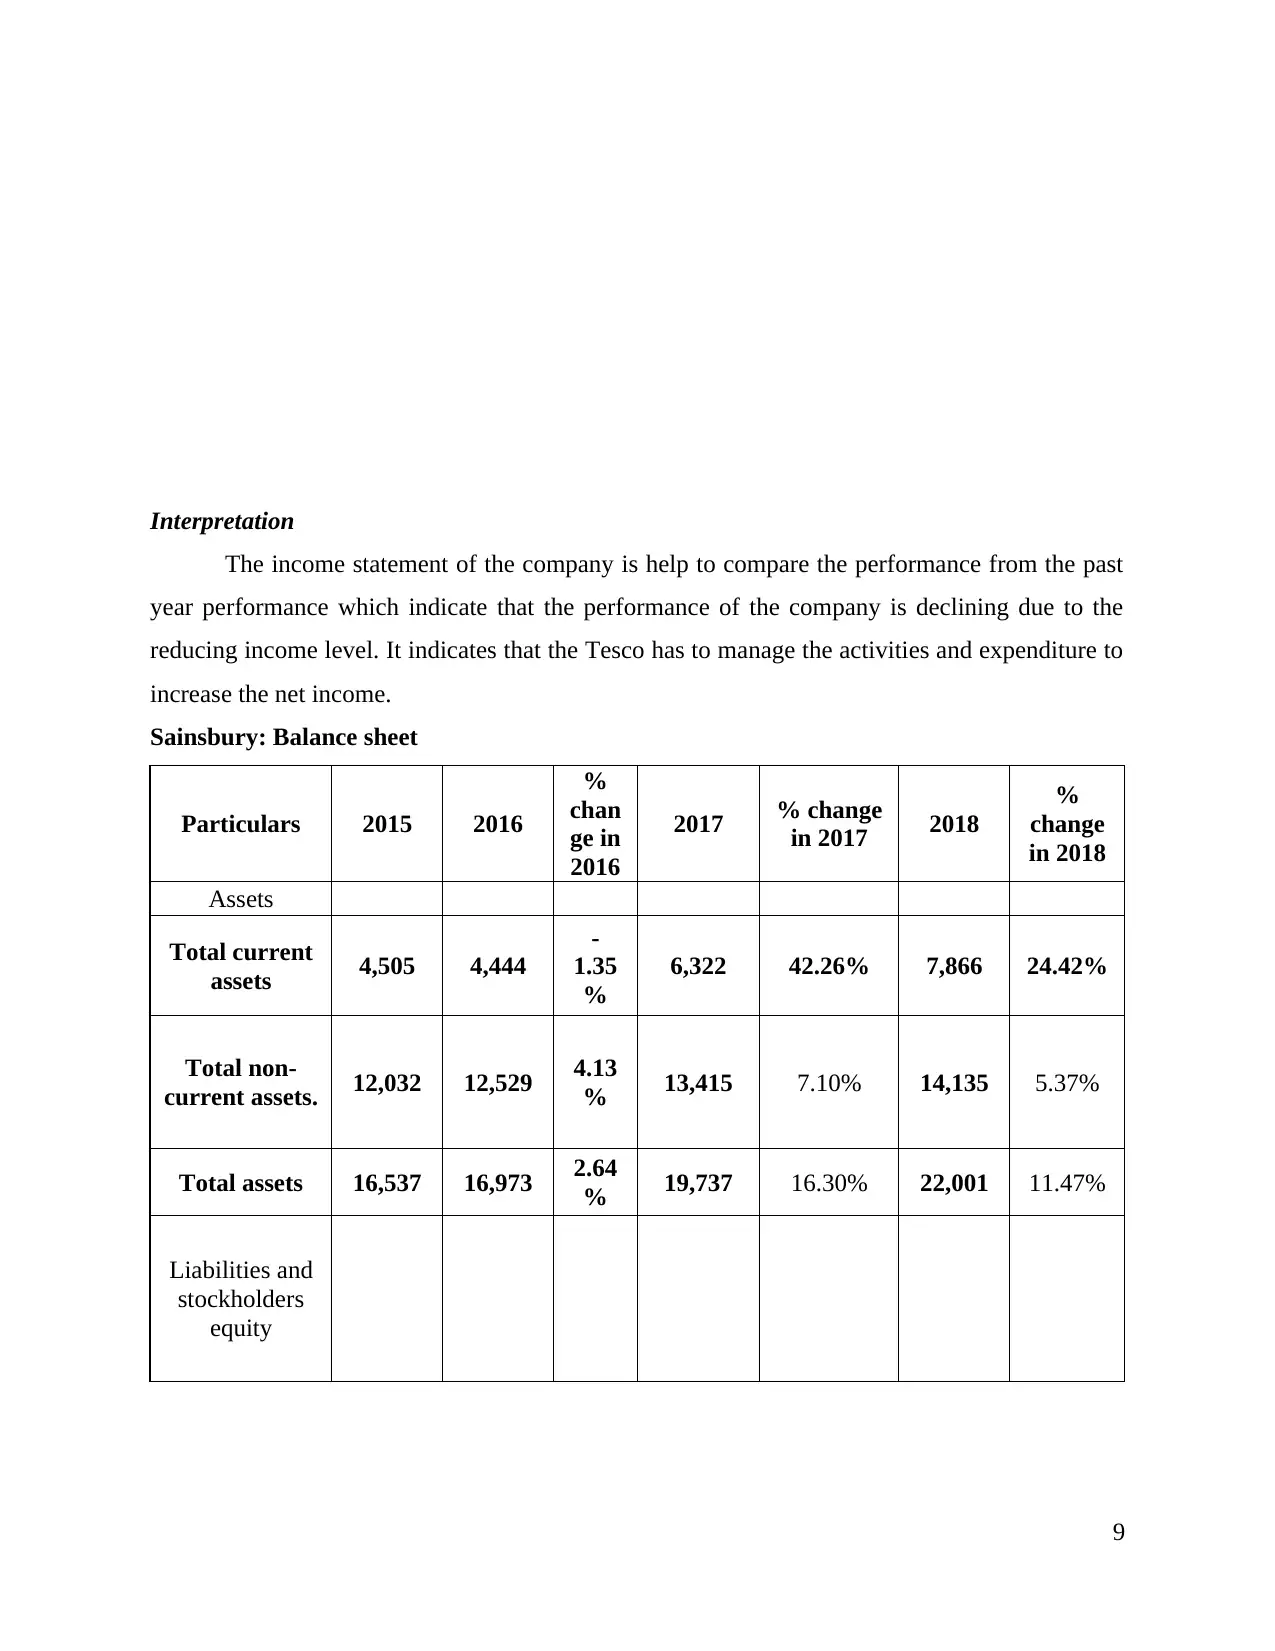
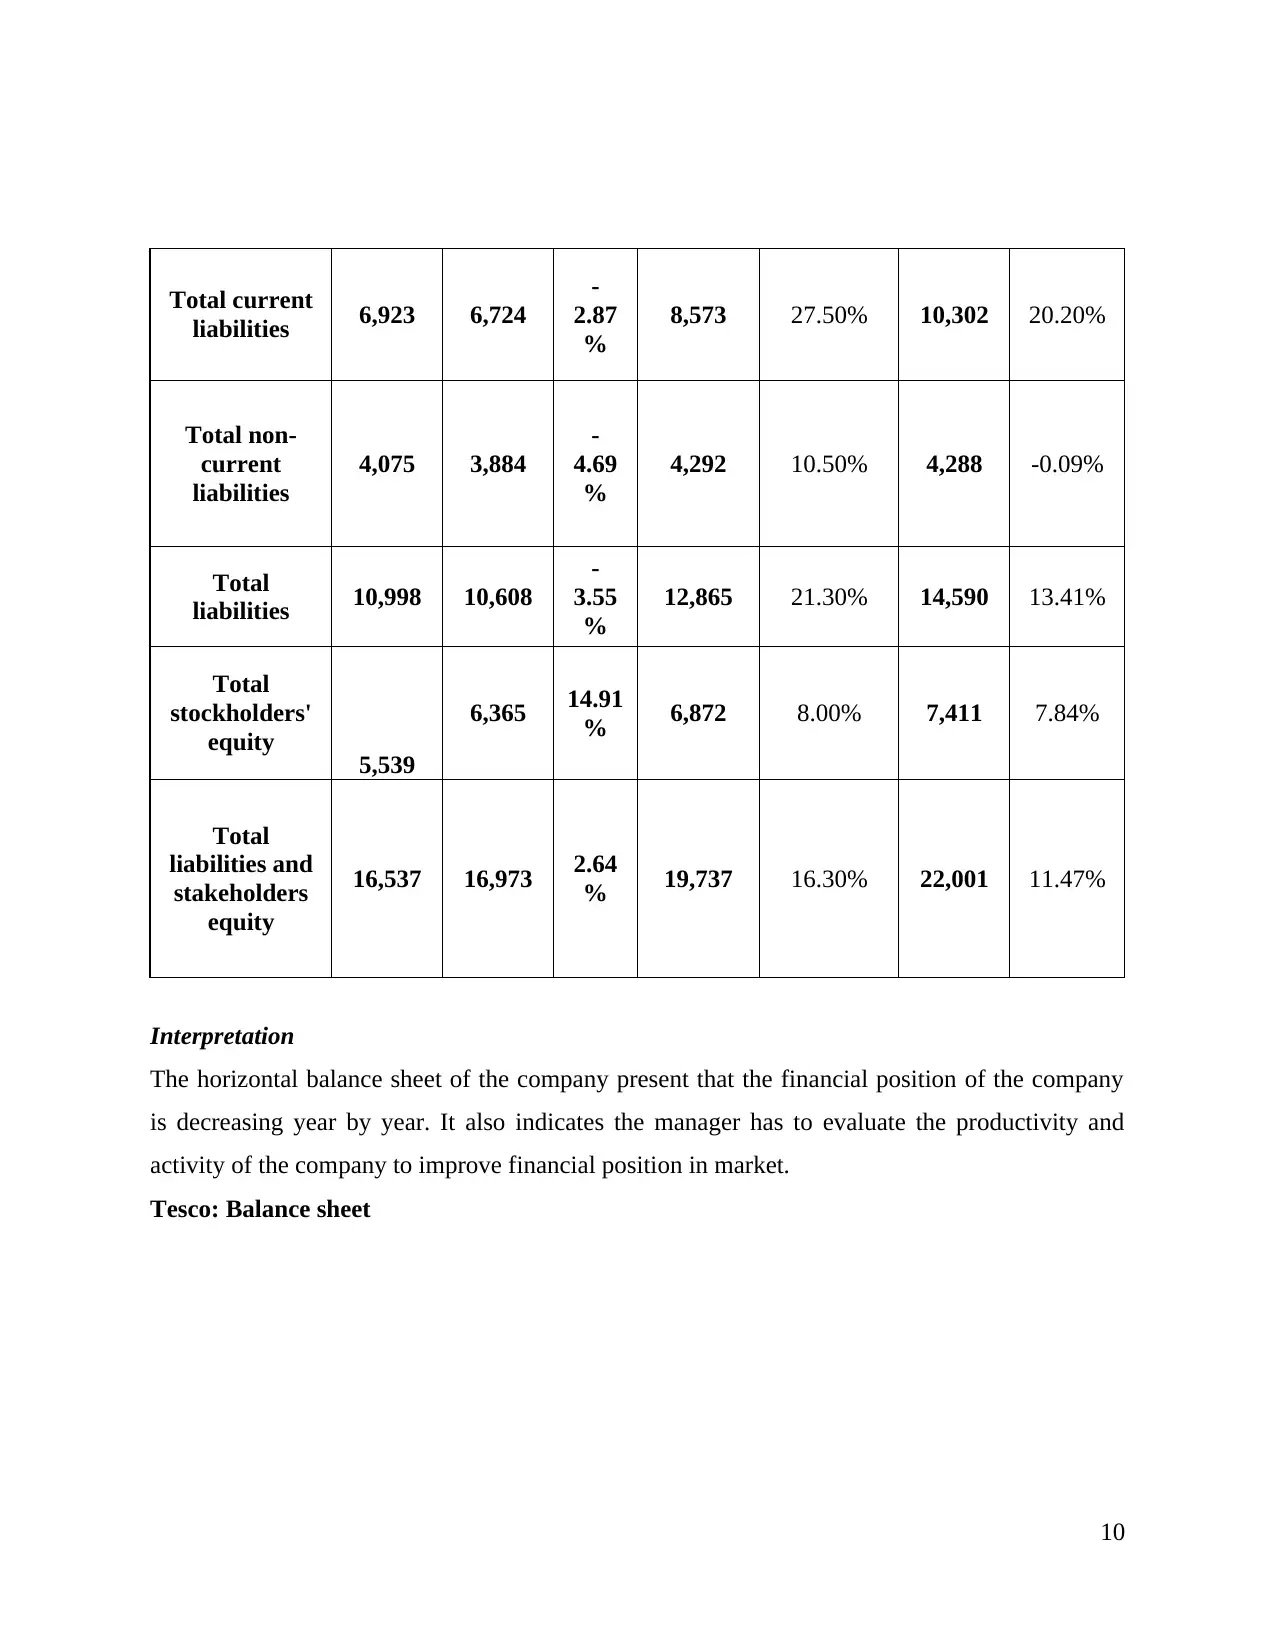
This report presents a financial analysis of Sainsbury and Tesco, two leading UK retail companies. It examines their financial performance through various ratios, including profitability, liquidity, solvency, efficiency, and investment ratios, based on data from 2015 to 2019. The analysis covers the financial statements, with a focus on income statements, balance sheets, and cash flow. The report also emphasizes the importance of working capital management. The analysis provides insights into the trends and performance of both companies, comparing their strengths and weaknesses in the market, offering a comprehensive overview of their financial health and operational efficiency.

Financial Analysis Management
& Enterprise
& Enterprise
Paraphrase This Document
Need a fresh take? Get an instant paraphrase of this document with our AI Paraphraser

TABLE OF CONTENTS
INTRODUCTION...........................................................................................................................1
MAIN BODY...................................................................................................................................1
1. Financial statement of Sainsbury and Tesco...........................................................................1
2. Importance of analysing working capital in the organisation ..............................................15
3. Evaluation of cash flow of last 2 year of the company.........................................................17
CONCLUSION..............................................................................................................................17
REFERENCES..............................................................................................................................19
APPENDIX....................................................................................................................................20

INTRODUCTION
Financial analysis is the process of analysing and evaluating the budget, project cost and
other expenses of transaction related to the finance to find the productivity and sustainability of
the company in given period. It can be done by visualising the financial report such as income
statement, cash flow and balance sheet. Sainsbury and Tesco are the two leading company of UK
in retail sector. The growth of the company is depended on its productivity and performance in
the market and how often people are loyal to the products and services. The aim of the study is to
present the financial performance of the Sainsbury and Tesco and analyse the result of the
company. It also focuses on the importance of working capital in the organisation. The report
highlights the cash flow statement of Sainsbury and Tesco of last two year.
MAIN BODY
1. Financial statement of Sainsbury and Tesco
Profitability ratio analysis
GP ratio
NP ratio
1
⊘ This is a preview!⊘
Do you want full access?
Subscribe today to unlock all pages.

Trusted by 1+ million students worldwide

Interpretation
Profitability ratio is used by the company to evaluate the generated profit in the
organisation in particular time period. The gross profit ratio present the generated profit from the
operating activities of company and net profit ratio help to estimate the profit generate from non
operating activities. The comparison of gross profit ratio of Sainsbury and Tesco present that
Sainsbury improves its performance and generate the higher profit in compare to Tesco but the
growth ratio of Tesco is Higher than the Sainsbury because in 2015 it bears the losses and in
2019 Tesco is able to compete with Sainsbury.
The comparison of net profit ratio of Tesco and Sainsbury present that in last 4 year
Tesco generate the higher profit. The net profit of Sainsbury is decline from the year 2016 to
2019 but the net profit of the tesco is increasing day by day which help them to maintain the
position in the market.
Liquidity ratio analysis
Current ratio
2
Paraphrase This Document
Need a fresh take? Get an instant paraphrase of this document with our AI Paraphraser

Quick ratio
Interpretation
Liquidity ratio is used determine the liquidity of the company or ascertain its financial
position. It provides the information to determine the ability of the debtor to pay the debt of the
company within the debt period. The current ratio of Sainsbury and tesco is increasing in the
initial year but in 2019 it declines. But the current ratio of both company is below to the ideal
current ratio which is 2:1.
The quick ratio of Sainsbury and Tesco is declining. In initial year the ratio of the
company is increasing but in late year it start to decline. It presents that the company is able to
pay the debt of the organisation. But from the comparison of the company financial position it
can be found that the decline ratio of Tesco is below to the Sainsbury. The quick ratio of
Sainsbury is decline with higher rate.
The liquidity ratio of the company is declining which present that the managers has to
control the activity and increase the cash level to paying the debt of the company. They also have
to manage the liability and collect the debt from the debtors to maintain the current assets.
3

Solvency ratio analysis
Debt-equity ratio
Year / companies Sainsbury Tesco
2015 0.44 1.49
2016 .35 1.23
2017 .31 1.45
2018 .20 0.67
2019 .12 .38
Interpretation
The solvency ratio of the company is used to determine that the company is able to pay
the long term or short debt or not. It was also used by the lenders and investors to take the
decision of investment in the company by estimating its cash level in the company. The debt
equity ratio of Sainsbury and Tesco is declining from the year 2015 to 2019 which present that
the company is able to manage its debt by its equity.
From the above comparison it can be concluded that the declining ratio of Sainsbury is
quite higher to the Tesco which indicate that Tesco is performed better in market in compare to
Sainsbury performance. The declining ratio of company indicate that manager has to manage the
debt and prepare the various plan and strategies to increase the equity of the firm by attracting
the investors and lenders. They also have to reduce the debt of the company by collecting them
from the debtors and regulate the period of paying debt.
Efficiency ratio analysis
Inventory turnover ratio
Year / companies Sainsbury Tesco
2015 22.63 21.78
2016 22.44 19.15
2017 17.93 22.41
2018 14.83 23.73
2019 14.44 24.49
Total assets turnover ratio
4
⊘ This is a preview!⊘
Do you want full access?
Subscribe today to unlock all pages.

Trusted by 1+ million students worldwide

Year / companies Sainsbury Tesco
2015 1.44 1.41
2016 1.40 1.24
2017 1.43 1.25
2018 1.36 1.27
2019 1.27 1.36
Fixed assets turnover ratio
Year / companies Sainsbury Tesco
2015 1.98 1.93
2016 1.91 1.78
2017 2.02 1.88
2018 2.07 1.87
2019 1.93 1.89
Interpretation
Efficiency ratio of the company indicate the performance of the manager that how they
are able to manage the assets and liabilities of the company. It helps to determine the financial
position of company by evaluating the assets and liabilities. The inventory turnover ratio of
Sainsbury is declining from the last year which present that the inventory level of the company is
declining. The higher efficiency ratio of company suggest that the company is able to use the
assets and liabilities.
The inventory turnover ratio of Tesco is increasing which present that Tesco is efficiently
managed the inventory level in the stores and warehouses. The higher the ratio suggest the higher
efficiency.
Investment ratios
Earnings per share
Year / companies Sainsbury Tesco
2015 -0.09 -2.12
2016 .23 0.05
2017 .17 (0.01)
2018 .13 .44
5
Paraphrase This Document
Need a fresh take? Get an instant paraphrase of this document with our AI Paraphraser

2019 .08 .41
Dividends per share
Year / companies Sainsbury Tesco
2015 0.1 -
2016 .12 -
2017 .12 -
2018 .1 .03
2019 .1 .11
Interpretation
The investment ratio is used to provide the information to the investor regarding the
investment decision. It helps them to take the decision that whether they have to invest in the
organisation of not. It also presents the risk and uncertainty of income generated from the
investment. The earning per share and dividend per share ratio of Sainsbury is decreasing. It
presents that if investor invest in Sainsbury than the income generated from the investment is
also reducing.
The earning per share ratio and dividend per share of the Tesco is decreasing. There is
frequent change in the investment ratio of Tesco which indicate that there is high level of risk
and uncertainty in the organisation and they have to adopt the new policies and strategies to
increase the investment from the investors.
Horizontal analysis
The horizontal analysis of income statements refers to compare the income level of the
organisation from its previous year performance. It helps the manager to analyse the trend of
growth in the company. It also provides brief knowledge to m manager about the company
performance.
Sainsbury: Income statement
6

Interpretation
The income statements of Sainsbury present that the performance of the company is
reduces year by year. The profit of t eh company is reduces so they have to manage the income
and expenditure of the company. The reducing income level affect the image of Sainsbury in the
market. It indicates that the director and manger of the company has to analyse the performance
and prepare the proper plan and strategies to improve the performance.
7
⊘ This is a preview!⊘
Do you want full access?
Subscribe today to unlock all pages.

Trusted by 1+ million students worldwide

Tesco: Income statement
8
8
Paraphrase This Document
Need a fresh take? Get an instant paraphrase of this document with our AI Paraphraser

Interpretation
The income statement of the company is help to compare the performance from the past
year performance which indicate that the performance of the company is declining due to the
reducing income level. It indicates that the Tesco has to manage the activities and expenditure to
increase the net income.
Sainsbury: Balance sheet
Particulars 2015 2016
%
chan
ge in
2016
2017 % change
in 2017 2018
%
change
in 2018
Assets
Total current
assets 4,505 4,444
-
1.35
%
6,322 42.26% 7,866 24.42%
Total non-
current assets. 12,032 12,529 4.13
% 13,415 7.10% 14,135 5.37%
Total assets 16,537 16,973 2.64
% 19,737 16.30% 22,001 11.47%
Liabilities and
stockholders
equity
9

Total current
liabilities 6,923 6,724
-
2.87
%
8,573 27.50% 10,302 20.20%
Total non-
current
liabilities
4,075 3,884
-
4.69
%
4,292 10.50% 4,288 -0.09%
Total
liabilities 10,998 10,608
-
3.55
%
12,865 21.30% 14,590 13.41%
Total
stockholders'
equity 5,539
6,365 14.91
% 6,872 8.00% 7,411 7.84%
Total
liabilities and
stakeholders
equity
16,537 16,973 2.64
% 19,737 16.30% 22,001 11.47%
Interpretation
The horizontal balance sheet of the company present that the financial position of the company
is decreasing year by year. It also indicates the manager has to evaluate the productivity and
activity of the company to improve financial position in market.
Tesco: Balance sheet
10
⊘ This is a preview!⊘
Do you want full access?
Subscribe today to unlock all pages.

Trusted by 1+ million students worldwide
1 out of 27
Related Documents

Your All-in-One AI-Powered Toolkit for Academic Success.
 +13062052269
info@desklib.com
Available 24*7 on WhatsApp / Email
Unlock your academic potential
Copyright © 2020–2025 A2Z Services. All Rights Reserved. Developed and managed by ZUCOL.