Detailed Financial Analysis and Performance of Sainsbury's PLC (GM707)
VerifiedAdded on 2023/04/23
|22
|7929
|135
Report
AI Summary
This report presents a comprehensive financial analysis of Sainsbury's PLC, evaluating its performance through various financial ratios including Operating Profit Margin, Price to Equity Ratio, Gearing Ratio, Asset Turnover Ratio, Return on Capital Employed (ROCE), and Interest Cover Ratio for the years 2016 and 2017. The analysis delves into the implications of these ratios, discussing trends and potential underlying factors impacting Sainsbury's financial health. Furthermore, the report explores potential financing options to support future investments in areas like R&D, innovation, and technological upgrades. The report also examines the relevance of the budgeting process in the modern environment, discusses various performance management tools for large global companies, and evaluates capital investment appraisal techniques. The analysis includes a discussion of financial reporting standards (IFRS, GAAP) and their impact on assessing an organization's value.

Paraphrase This Document
Need a fresh take? Get an instant paraphrase of this document with our AI Paraphraser
Assessment Brief/Task
The detailed requirements for this task are as follows:
There are four equally weighted parts to this assignment
Part 1
You are to select a PLC that has a listing on any recognized stock exchange of your choice and agree this with
the module tutor.
You are required to produce a Financial Analysis of the company based upon the following ratios for the
company for the years 2017 and 2016
1. Operating Profit Margin Ratio
2. Price to Equity [P/e] Ratio
3. Gearing Ratio
4. Asset Turnover Ratio
5. Return on Capital Employed (ROCE).
6. Interest Cover Ratio
(you will need to show all relevant workings and supporting documentation). Your analysis will be based
upon the ratios calculated and utilizing any background industry/company information you think is relevant.
Now examine the typical sources of finance options available to justify a 20% Net Asset investment in
meeting future management priorities of the chosen PLC w.r.t addressing its competitive and leadership
edge of staying invested in either :- R&D or Innovation or Debt Issuance {repayments}/ Restructuring / Re-
engineering or Technological upgrades or Divestitures or M&A/ JV’s or any other suitable Asset Purchase
constituting Capex requirements by integrating the management discussion & analysis from the Ratios
evaluated
# R&D – Research & Development, M&A – Mergers & Acquisitions, JV’s – Joint Venture, Capex- Capital
Expenditure.
Part 2
You are to discuss the question whether the budgeting process is still fit for purpose in the modern
environment from a planning and control dimension? How can scalable technologies such as cloud
computing, big data and predictive analysis software prove ‘reliable’ in strengthening the planning,
budgeting and forecasting exercise to be fully automated in the next five years.
Part 3
Discuss the different types of performance management tools and techniques which can be deployed in
large global companies for evaluating its suitability across a range of business and economic environments.
Part 4
Imagine you are a CEO of a large global corporation and one of your Group Directors has approached with a
business plan requiring significant capital expenditure. What types of capital investment appraisal
techniques would you deploy to arrive at, while examining the fiscal viability of business proposal?
Assessment Criteria
The proportions of the assignment should be
1. How does understanding the concepts of financial reporting help in appreciating the of
accounting standards (IFRS , GAAP), when judging true value of organizations (25%).
2. Comparison of company performance with industry based upon ratios calculated (25%)
3. Analytical discussion of the relevance of the budgeting process to the current commercial and
industrial/technology environment (25%)
4. Evaluate the various performance management tools and investment appraisal techniques of its
suitability and relevance in the evolving business and economic environment.(25%)
Assessment limits: No more than: 6500 words, excluding appendices
Assessment (For further details see the Module Guide)
Assessment 1: Coursework (weightage 50%, not Exceeding 3000 Words)
Assessment 2: Coursework (weightage 50%, not Exceeding 3000Words)
Special Assessment Requirements
Both elements of assessment must be passed in order to pass the module
ASSIGNMENT INFORMATION
Full/ Part Assignment Full
Date Assignment Issued
Date Assignment Due
⊘ This is a preview!⊘
Do you want full access?
Subscribe today to unlock all pages.
Trusted by 1+ million students worldwide
Assignment IV by Col. Anil Ahluwalia
TO BE FILLED BY THE FACULTY
Faculty Name Mr Shahid A Wani
Contact No.
Email ID shahid@ebsedu.org
TO BE FILLED BY THE SUTDENT
Student Name
Student ID
Email ID
Turinitin ID 17975395
Turnitin Enrollment key GM707
Course
Date Submitted
TO BE FILLED BY THE ASSESSOR
Assessment types Marks Marks
Awarded
Understanding the concepts of financial reporting help 25
Comparison of company performance 25
Analytical discussion 25
Evaluate various performance management tools and investment
appraisal techniques
25
Overall Marks 100
Overall Grade
Faculty Name
Summative Feedback by Faculty for further improvement
Table of Contents
Introduction..........................................................................................................................
Paraphrase This Document
Need a fresh take? Get an instant paraphrase of this document with our AI Paraphraser

Assessment 1.......................................................................................................................
Answer to Part 1..............................................................................................................
Answer to Part 2..............................................................................................................
Answer to Part 3............................................................................................................
Answer to Part 4............................................................................................................
Assessment 2.....................................................................................................................
Answer to Part 1............................................................................................................
Answer to Part 2............................................................................................................
Answer to Part 3............................................................................................................
Answer to Part 4............................................................................................................
Conclusion.........................................................................................................................
References..........................................................................................................................
Part1
The scope of the study has provided the assessment of ratios for Sainsbury’s PLC during
2017 and 2016. Some of the main ratios considered for the report includes “Operating Profit
Margin Ratio, Price to Equity [P/e] Ratio, Gearing Ratio, Asset Turnover Ratio, Return on
Capital Employed (ROCE) and Interest Coverage Ratio”. This section of the report has also
discussed on the typical sources of finance options available to justify a 20% net asset
investment for meeting future management priorities. The next part of the study has focused
on the necessity of including budgeting process as per planning and control dimension. The
third segment of the study has highlighted on the inclusion of performance management tools
which are depicted to be deployed in large global companies and discern the suitability of the
range of business and economic environments. The next section of the study has focused on
the understanding the concepts listed under the financial reporting beneficial in appreciating
the various types of the accounting standards listed as per IFRS and GAAP. This will be done
for judging the true value of the selected organization. The second part of assessment 2 has
provided the comparison of the company performance as per the industry-based standards as
per the ratios computed for the company. The significant nature of the analytical decision has
been able to provide the relevance of the budgeting process as per the present commercial and
industrial technology environment. The final section of this section has been conducive in
addressing the various techniques used as per the performance management with application
of the relevant management tools relevant with the suitability of the evolving business and
economic environment (Renz 2016).
Assessment 1
Answer to Part 1
Ratio Analysis of Sainsbury for 2017 and 2016
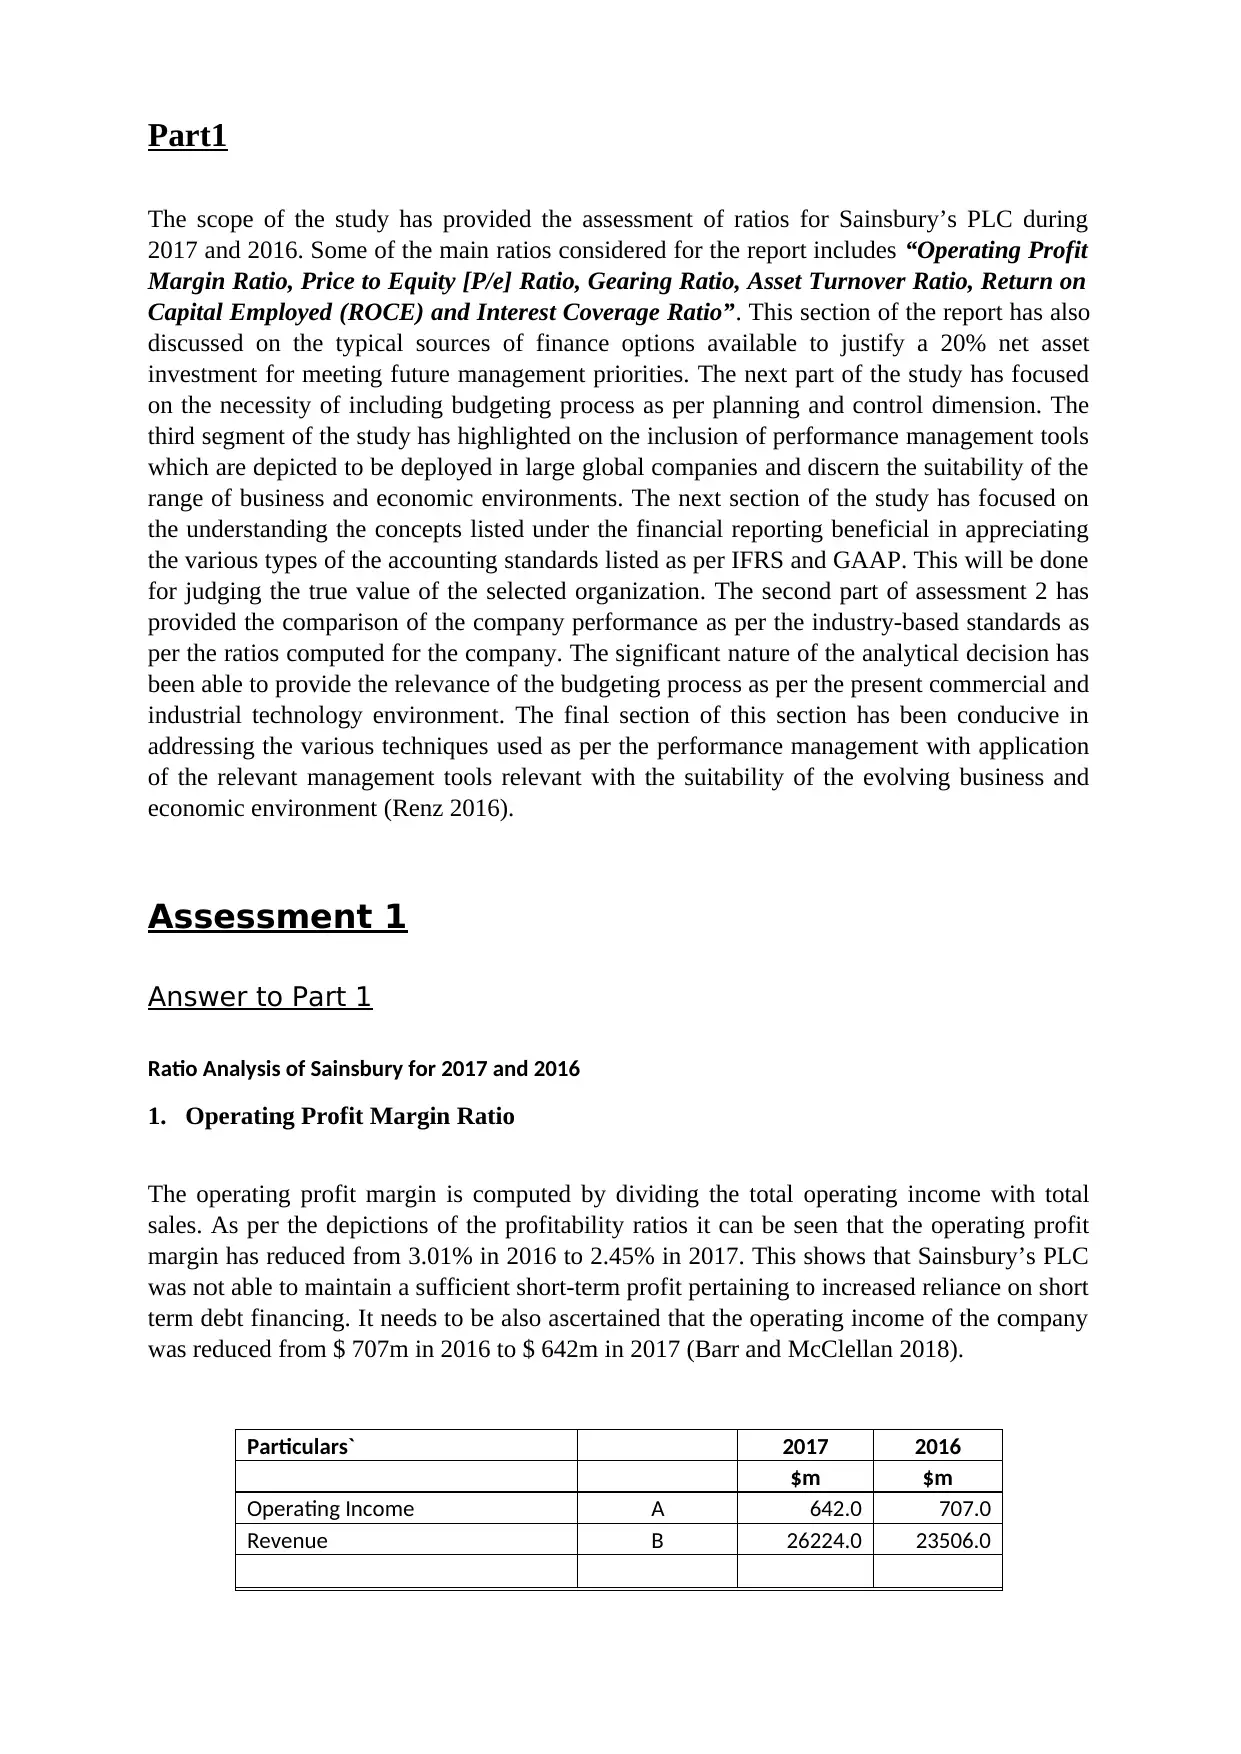
1. Operating Profit Margin Ratio
The operating profit margin is computed by dividing the total operating income with total
sales. As per the depictions of the profitability ratios it can be seen that the operating profit
margin has reduced from 3.01% in 2016 to 2.45% in 2017. This shows that Sainsbury’s PLC
was not able to maintain a sufficient short-term profit pertaining to increased reliance on short
term debt financing. It needs to be also ascertained that the operating income of the company
was reduced from $ 707m in 2016 to $ 642m in 2017 (Barr and McClellan 2018).
Particulars` 2017 2016
$m $m
Operating Income A 642.0 707.0
Revenue B 26224.0 23506.0
The scope of the study has provided the assessment of ratios for Sainsbury’s PLC during
2017 and 2016. Some of the main ratios considered for the report includes “Operating Profit
Margin Ratio, Price to Equity [P/e] Ratio, Gearing Ratio, Asset Turnover Ratio, Return on
Capital Employed (ROCE) and Interest Coverage Ratio”. This section of the report has also
discussed on the typical sources of finance options available to justify a 20% net asset
investment for meeting future management priorities. The next part of the study has focused
on the necessity of including budgeting process as per planning and control dimension. The
third segment of the study has highlighted on the inclusion of performance management tools
which are depicted to be deployed in large global companies and discern the suitability of the
range of business and economic environments. The next section of the study has focused on
the understanding the concepts listed under the financial reporting beneficial in appreciating
the various types of the accounting standards listed as per IFRS and GAAP. This will be done
for judging the true value of the selected organization. The second part of assessment 2 has
provided the comparison of the company performance as per the industry-based standards as
per the ratios computed for the company. The significant nature of the analytical decision has
been able to provide the relevance of the budgeting process as per the present commercial and
industrial technology environment. The final section of this section has been conducive in
addressing the various techniques used as per the performance management with application
of the relevant management tools relevant with the suitability of the evolving business and
economic environment (Renz 2016).
Assessment 1
Answer to Part 1
Ratio Analysis of Sainsbury for 2017 and 2016
1. Operating Profit Margin Ratio
The operating profit margin is computed by dividing the total operating income with total
sales. As per the depictions of the profitability ratios it can be seen that the operating profit
margin has reduced from 3.01% in 2016 to 2.45% in 2017. This shows that Sainsbury’s PLC
was not able to maintain a sufficient short-term profit pertaining to increased reliance on short
term debt financing. It needs to be also ascertained that the operating income of the company
was reduced from $ 707m in 2016 to $ 642m in 2017 (Barr and McClellan 2018).
Particulars` 2017 2016
$m $m
Operating Income A 642.0 707.0
Revenue B 26224.0 23506.0
⊘ This is a preview!⊘
Do you want full access?
Subscribe today to unlock all pages.
Trusted by 1+ million students worldwide
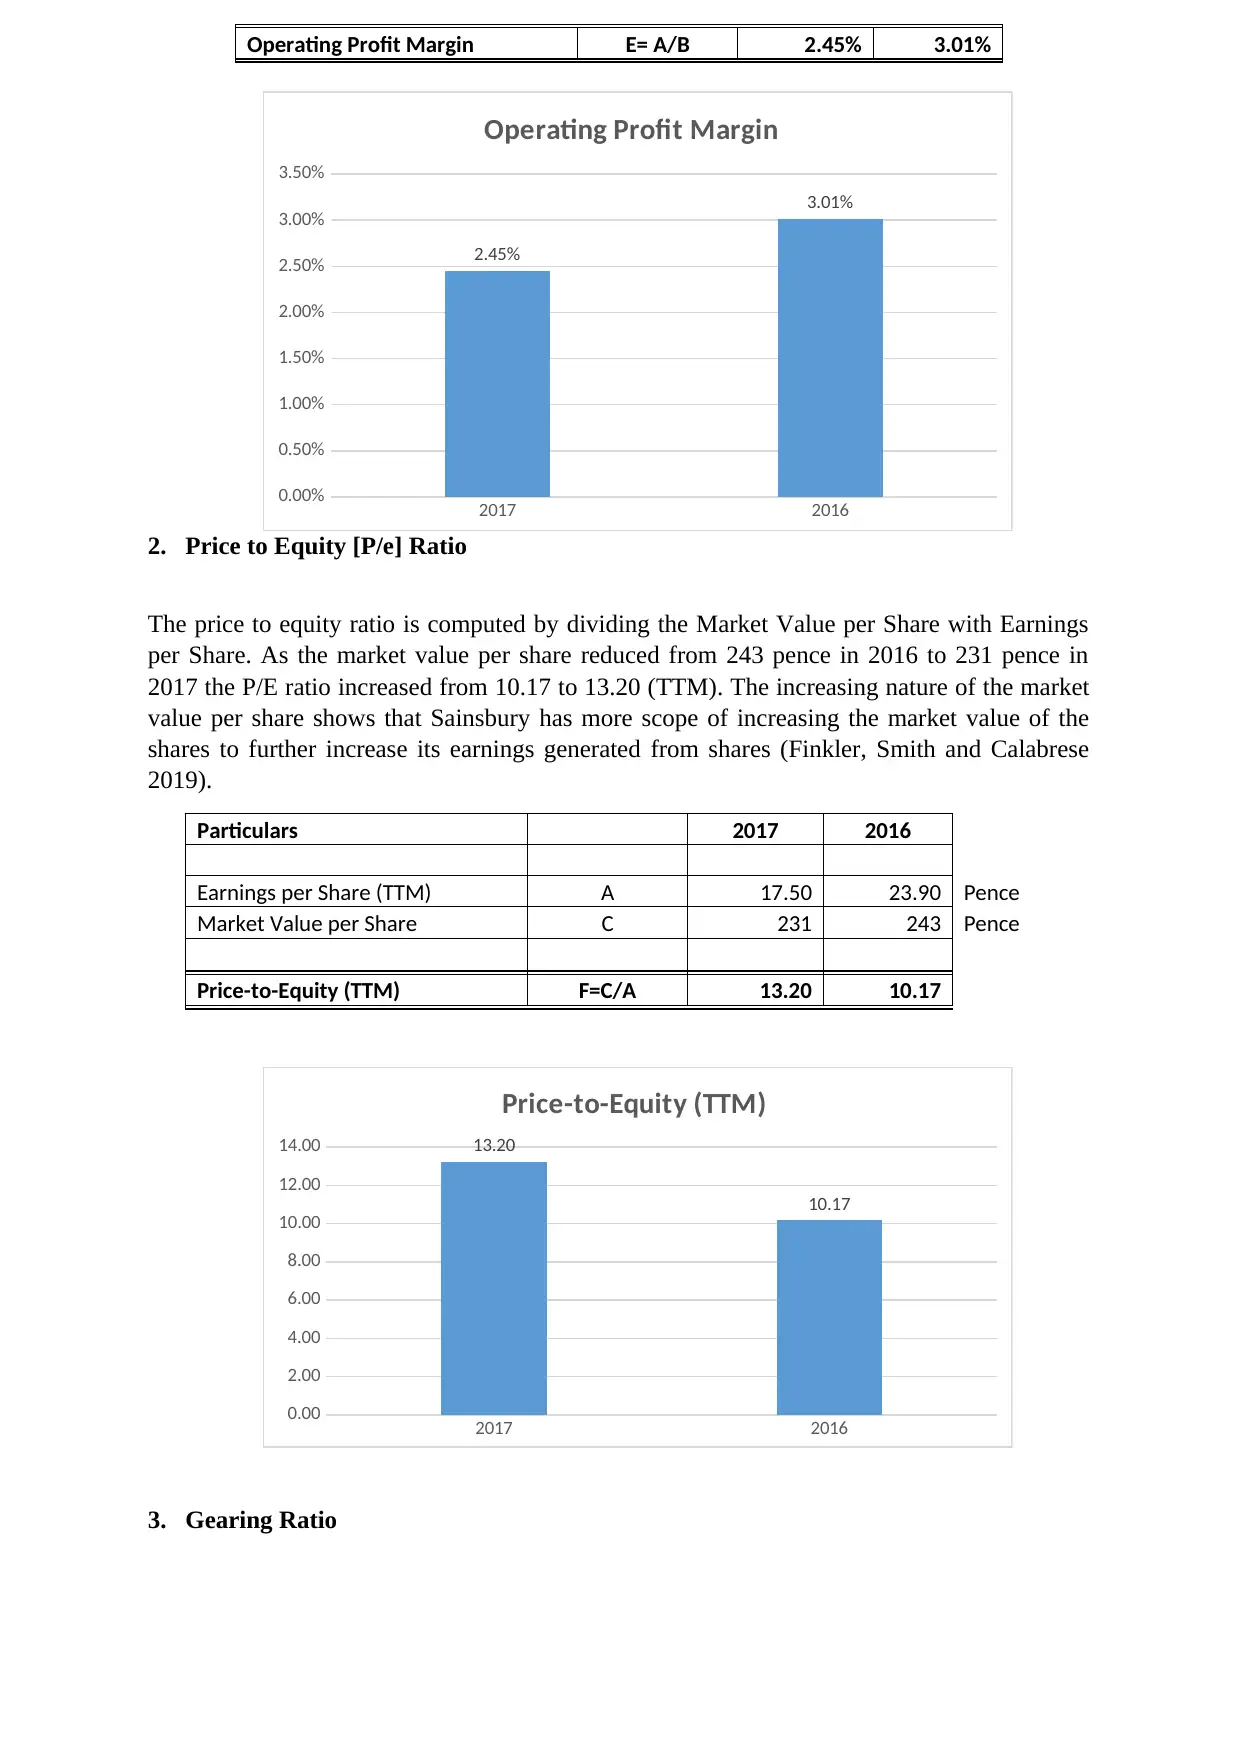
Operating Profit Margin E= A/B 2.45% 3.01%
2017 2016
0.00%
0.50%
1.00%
1.50%
2.00%
2.50%
3.00%
3.50%
2.45%
3.01%
Operating Profit Margin
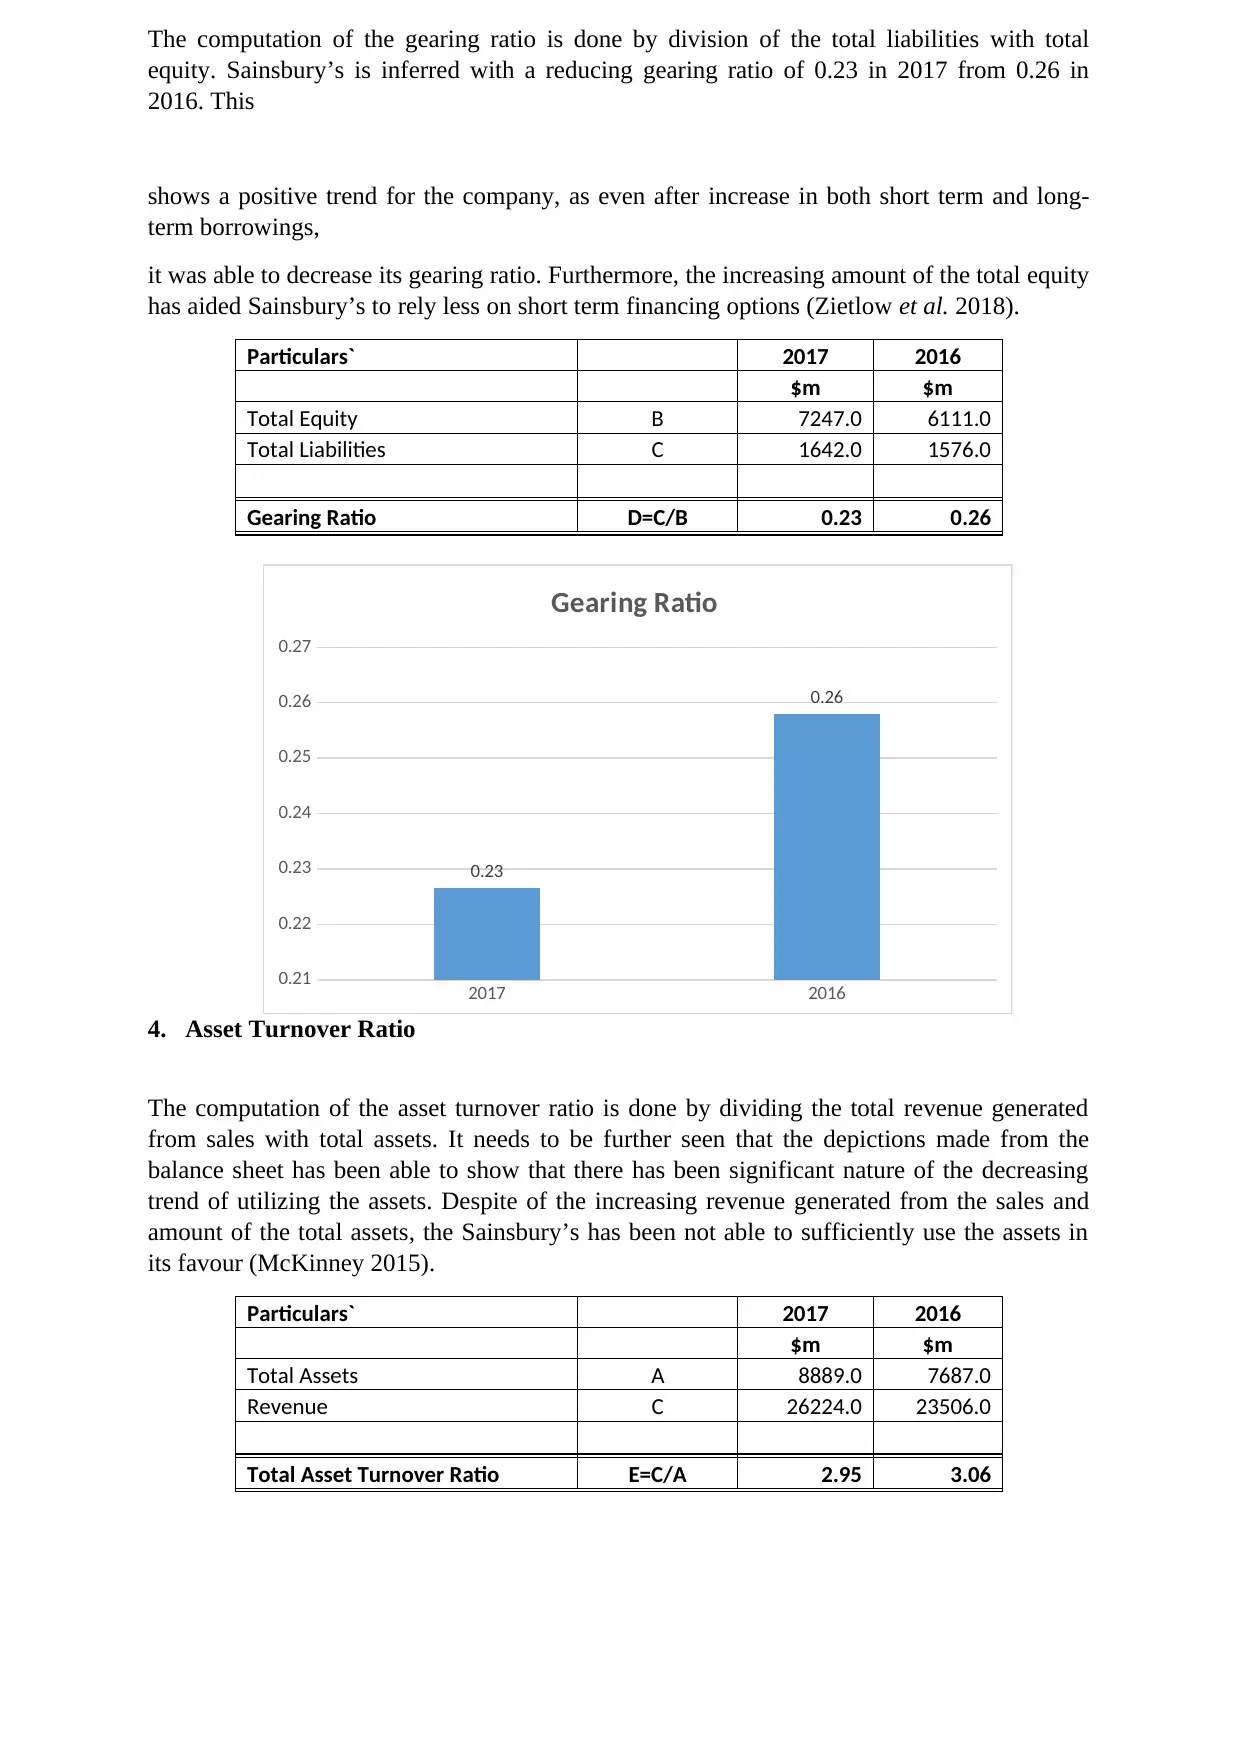
2. Price to Equity [P/e] Ratio
The price to equity ratio is computed by dividing the Market Value per Share with Earnings
per Share. As the market value per share reduced from 243 pence in 2016 to 231 pence in
2017 the P/E ratio increased from 10.17 to 13.20 (TTM). The increasing nature of the market
value per share shows that Sainsbury has more scope of increasing the market value of the
shares to further increase its earnings generated from shares (Finkler, Smith and Calabrese
2019).
Particulars 2017 2016
Earnings per Share (TTM) A 17.50 23.90 Pence
Market Value per Share C 231 243 Pence
Price-to-Equity (TTM) F=C/A 13.20 10.17
2017 2016
0.00
2.00
4.00
6.00
8.00
10.00
12.00
14.00 13.20
10.17
Price-to-Equity (TTM)
3. Gearing Ratio
2017 2016
0.00%
0.50%
1.00%
1.50%
2.00%
2.50%
3.00%
3.50%
2.45%
3.01%
Operating Profit Margin
2. Price to Equity [P/e] Ratio
The price to equity ratio is computed by dividing the Market Value per Share with Earnings
per Share. As the market value per share reduced from 243 pence in 2016 to 231 pence in
2017 the P/E ratio increased from 10.17 to 13.20 (TTM). The increasing nature of the market
value per share shows that Sainsbury has more scope of increasing the market value of the
shares to further increase its earnings generated from shares (Finkler, Smith and Calabrese
2019).
Particulars 2017 2016
Earnings per Share (TTM) A 17.50 23.90 Pence
Market Value per Share C 231 243 Pence
Price-to-Equity (TTM) F=C/A 13.20 10.17
2017 2016
0.00
2.00
4.00
6.00
8.00
10.00
12.00
14.00 13.20
10.17
Price-to-Equity (TTM)
3. Gearing Ratio
Paraphrase This Document
Need a fresh take? Get an instant paraphrase of this document with our AI Paraphraser
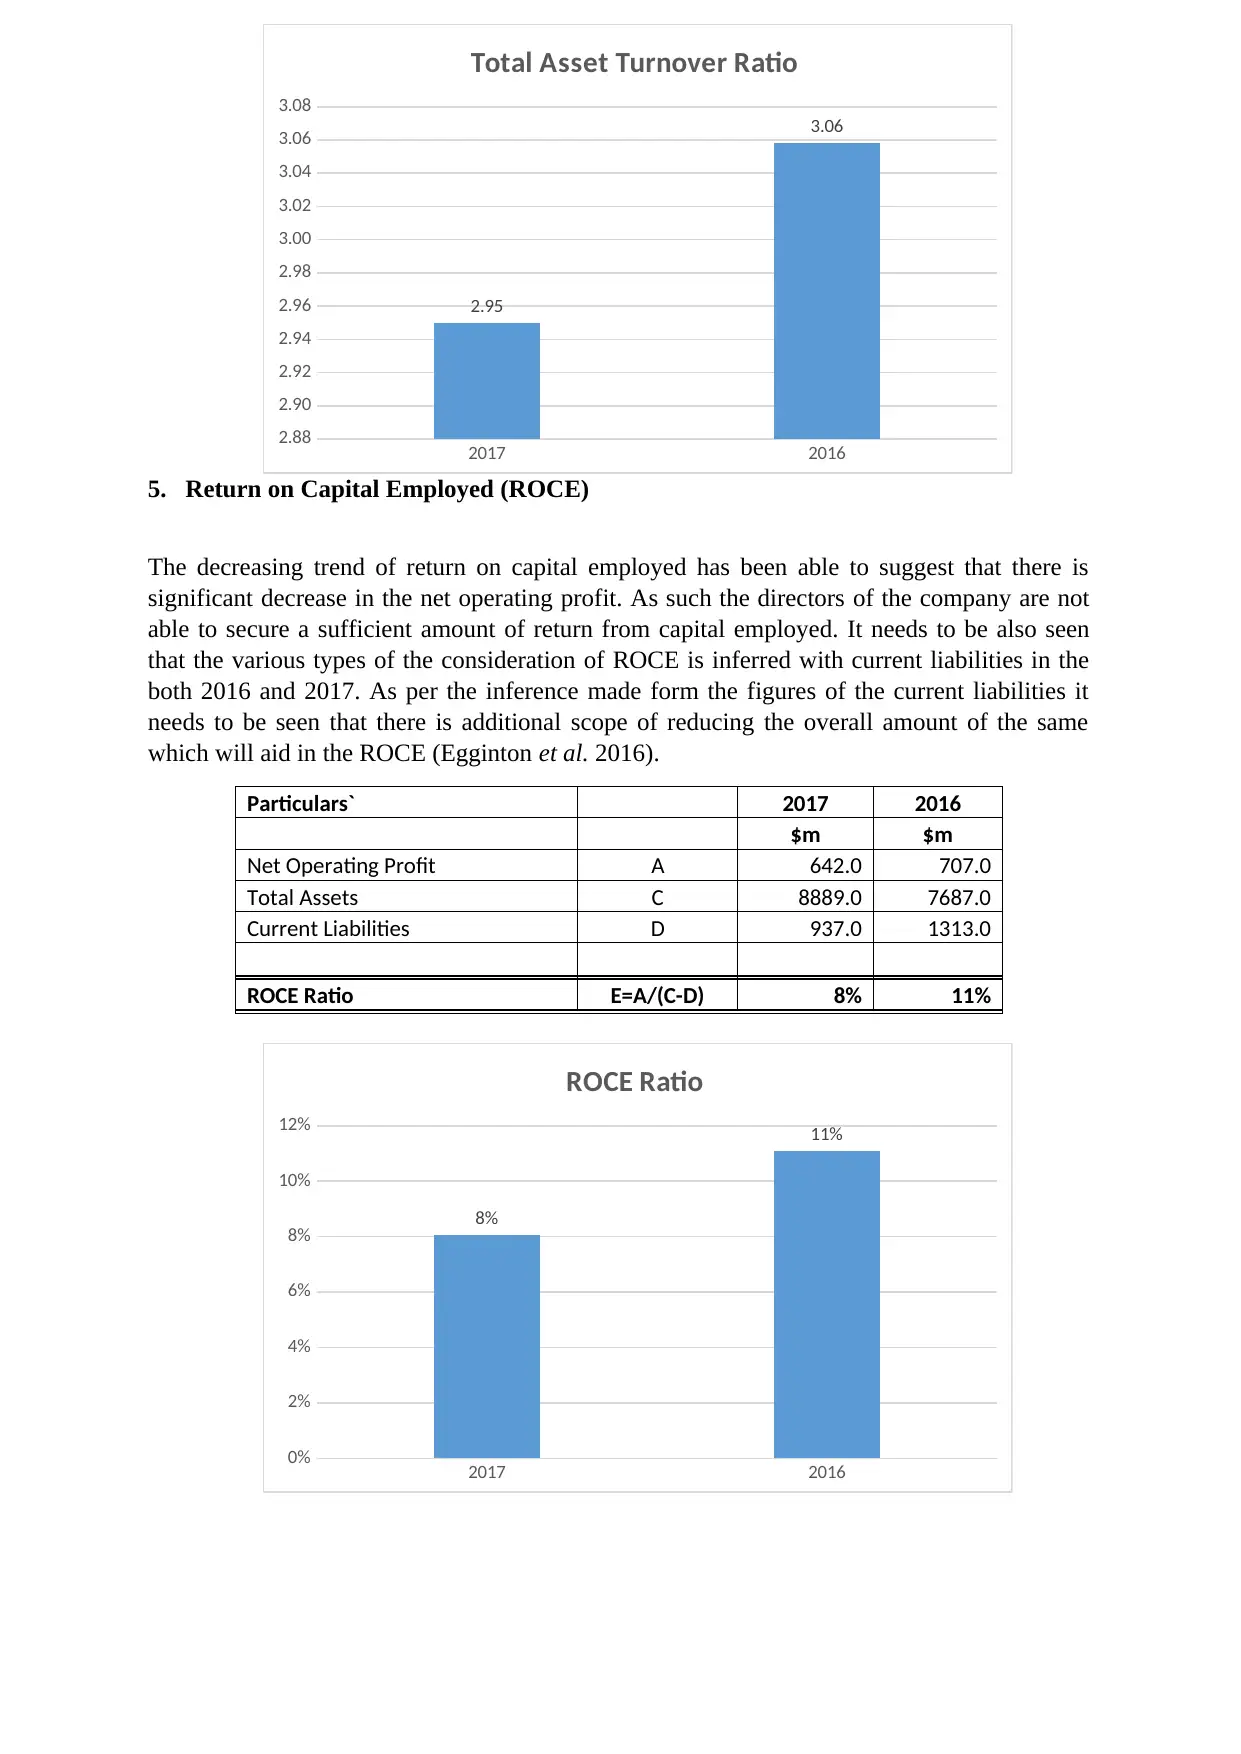
The computation of the gearing ratio is done by division of the total liabilities with total
equity. Sainsbury’s is inferred with a reducing gearing ratio of 0.23 in 2017 from 0.26 in
2016. This
shows a positive trend for the company, as even after increase in both short term and long-
term borrowings,
it was able to decrease its gearing ratio. Furthermore, the increasing amount of the total equity
has aided Sainsbury’s to rely less on short term financing options (Zietlow et al. 2018).
Particulars` 2017 2016
$m $m
Total Equity B 7247.0 6111.0
Total Liabilities C 1642.0 1576.0
Gearing Ratio D=C/B 0.23 0.26
2017 2016
0.21
0.22
0.23
0.24
0.25
0.26
0.27
0.23
0.26
Gearing Ratio
4. Asset Turnover Ratio
The computation of the asset turnover ratio is done by dividing the total revenue generated
from sales with total assets. It needs to be further seen that the depictions made from the
balance sheet has been able to show that there has been significant nature of the decreasing
trend of utilizing the assets. Despite of the increasing revenue generated from the sales and
amount of the total assets, the Sainsbury’s has been not able to sufficiently use the assets in
its favour (McKinney 2015).
Particulars` 2017 2016
$m $m
Total Assets A 8889.0 7687.0
Revenue C 26224.0 23506.0
Total Asset Turnover Ratio E=C/A 2.95 3.06
2017 2016
2.88
2.90
2.92
2.94
2.96
2.98
3.00
3.02
3.04
3.06
3.08
2.95
3.06
Total Asset Turnover Ratio
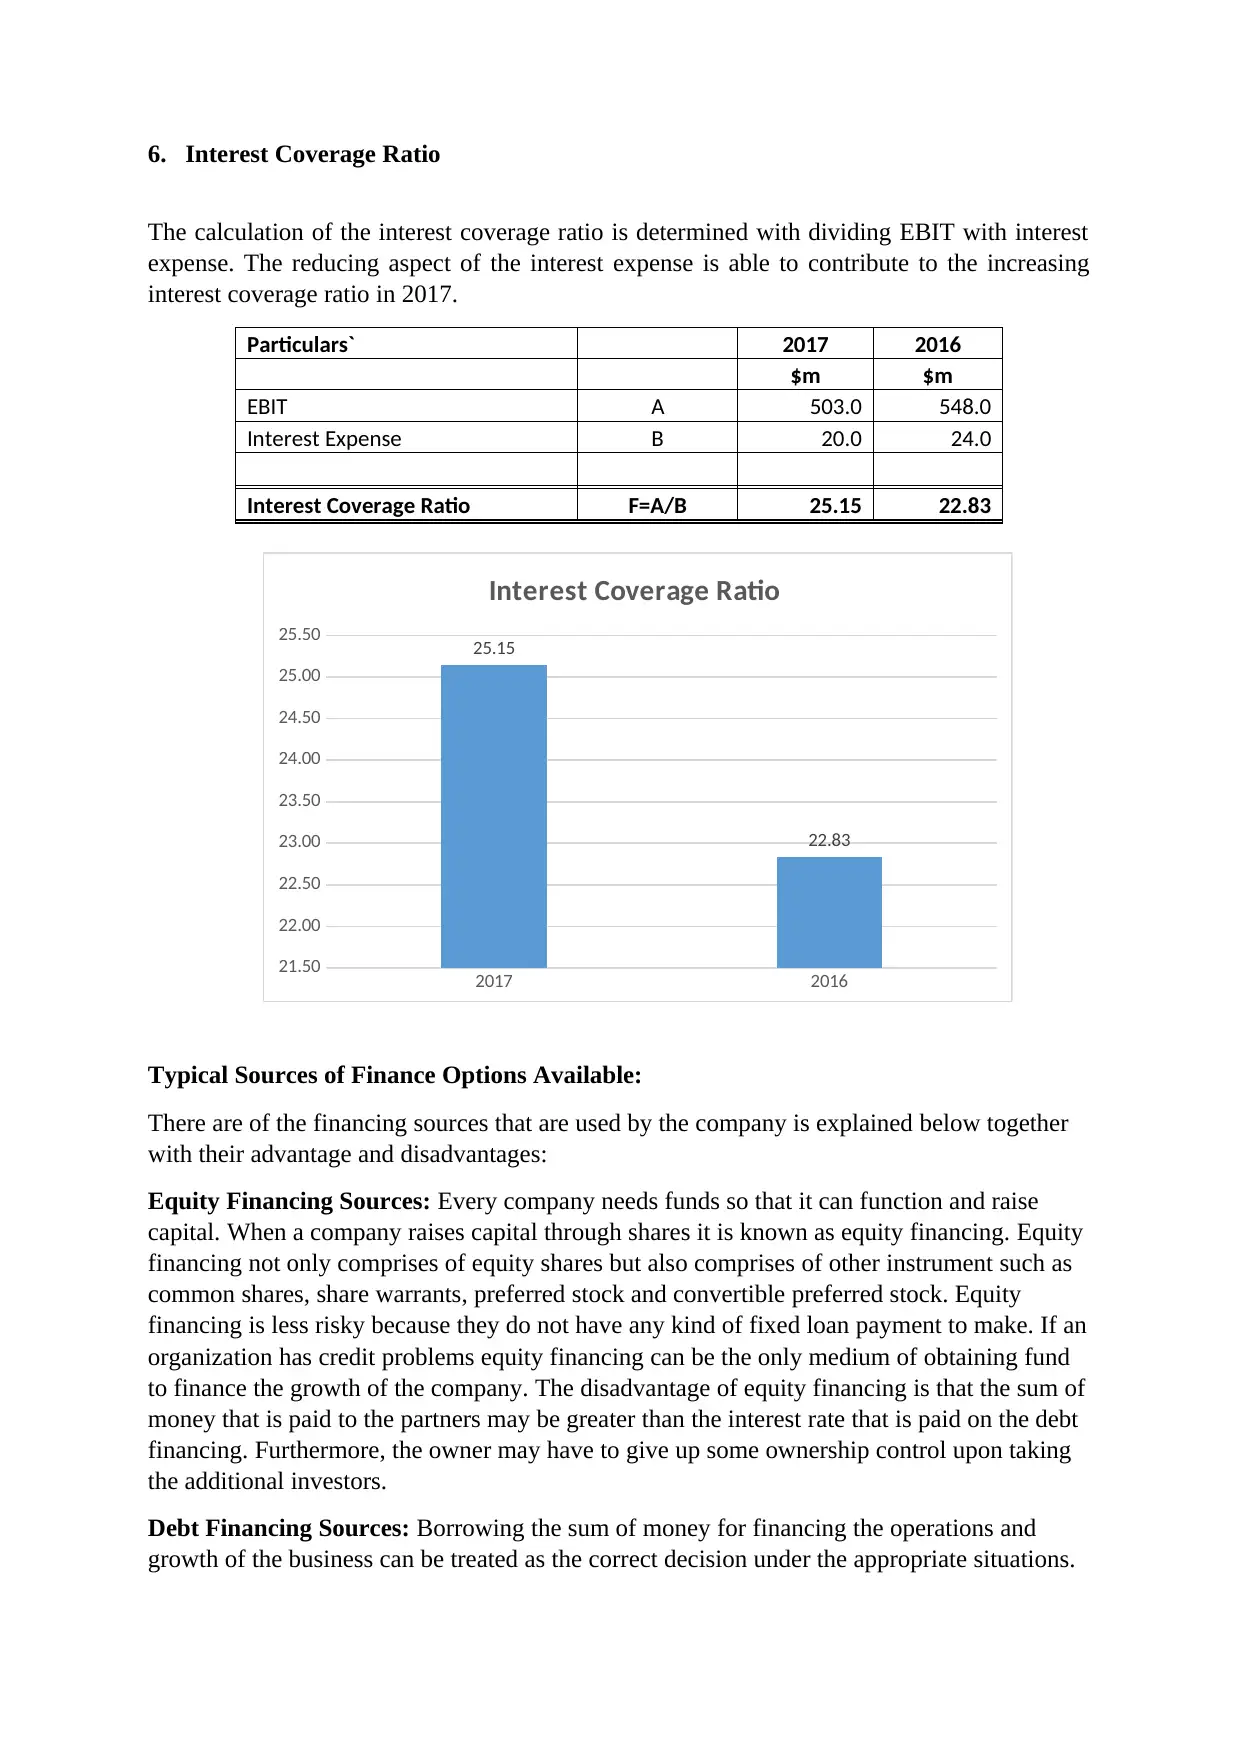
5. Return on Capital Employed (ROCE)
The decreasing trend of return on capital employed has been able to suggest that there is
significant decrease in the net operating profit. As such the directors of the company are not
able to secure a sufficient amount of return from capital employed. It needs to be also seen
that the various types of the consideration of ROCE is inferred with current liabilities in the
both 2016 and 2017. As per the inference made form the figures of the current liabilities it
needs to be seen that there is additional scope of reducing the overall amount of the same
which will aid in the ROCE (Egginton et al. 2016).
Particulars` 2017 2016
$m $m
Net Operating Profit A 642.0 707.0
Total Assets C 8889.0 7687.0
Current Liabilities D 937.0 1313.0
ROCE Ratio E=A/(C-D) 8% 11%
2017 2016
0%
2%
4%
6%
8%
10%
12%
8%
11%
ROCE Ratio
2.88
2.90
2.92
2.94
2.96
2.98
3.00
3.02
3.04
3.06
3.08
2.95
3.06
Total Asset Turnover Ratio
5. Return on Capital Employed (ROCE)
The decreasing trend of return on capital employed has been able to suggest that there is
significant decrease in the net operating profit. As such the directors of the company are not
able to secure a sufficient amount of return from capital employed. It needs to be also seen
that the various types of the consideration of ROCE is inferred with current liabilities in the
both 2016 and 2017. As per the inference made form the figures of the current liabilities it
needs to be seen that there is additional scope of reducing the overall amount of the same
which will aid in the ROCE (Egginton et al. 2016).
Particulars` 2017 2016
$m $m
Net Operating Profit A 642.0 707.0
Total Assets C 8889.0 7687.0
Current Liabilities D 937.0 1313.0
ROCE Ratio E=A/(C-D) 8% 11%
2017 2016
0%
2%
4%
6%
8%
10%
12%
8%
11%
ROCE Ratio
⊘ This is a preview!⊘
Do you want full access?
Subscribe today to unlock all pages.
Trusted by 1+ million students worldwide
6. Interest Coverage Ratio
The calculation of the interest coverage ratio is determined with dividing EBIT with interest
expense. The reducing aspect of the interest expense is able to contribute to the increasing
interest coverage ratio in 2017.
Particulars` 2017 2016
$m $m
EBIT A 503.0 548.0
Interest Expense B 20.0 24.0
Interest Coverage Ratio F=A/B 25.15 22.83
2017 2016
21.50
22.00
22.50
23.00
23.50
24.00
24.50
25.00
25.50 25.15
22.83
Interest Coverage Ratio
Typical Sources of Finance Options Available:
There are of the financing sources that are used by the company is explained below together
with their advantage and disadvantages:
Equity Financing Sources: Every company needs funds so that it can function and raise
capital. When a company raises capital through shares it is known as equity financing. Equity
financing not only comprises of equity shares but also comprises of other instrument such as
common shares, share warrants, preferred stock and convertible preferred stock. Equity
financing is less risky because they do not have any kind of fixed loan payment to make. If an
organization has credit problems equity financing can be the only medium of obtaining fund
to finance the growth of the company. The disadvantage of equity financing is that the sum of
money that is paid to the partners may be greater than the interest rate that is paid on the debt
financing. Furthermore, the owner may have to give up some ownership control upon taking
the additional investors.
Debt Financing Sources: Borrowing the sum of money for financing the operations and
growth of the business can be treated as the correct decision under the appropriate situations.
Paraphrase This Document
Need a fresh take? Get an instant paraphrase of this document with our AI Paraphraser
The sources of debt financing include the banks, credit unions, consumer finance company,
trade credit or the leasing companies. The advantage of debt financing is that loan interest is
deductible for tax. Principle and payment of interest are provided in advance therefore it
becomes easy to work in the cash flow of the company. However, the disadvantage is that
taking large amount of debt may make the business vulnerable and may have the problems of
meeting loan payments given the cash flow falls. Payment of principle and interest should be
paid on the specific dates without any failure. Business that have uncertain cash flow may
face the difficulties in making payment of loan.
Retained Earnings: Retained earnings refers to the part of profit that is not distributed
between the shareholders but the same is retained and used for the business purpose. This is a
vital source of finance because it uses the working capital. The retained earnings are the
cheaper source of finance and financial stability and the shareholders may get the sufficient
dividend even though the company does not earn sufficient profit. The disadvantage of
retained earnings is that improper usage of funds may result in careless spending of funds.
Conservative dividend policy may result in over-use of capitalization.
Justification a 20% Net Asset investment in meeting future management priorities
Some of the typical sources available to justify the net asset investment in meeting the future
management priorities can be understood with both short financing options and long-term
financing options. The short-term financing options to justify a 20% Net Asset investment
may be inferred with proceeding with an overdraft agreement. In addition to this, the
company also has the choice of proceeding with short term financing options such as
accounts receivable financing, customer advances and selling goods on instalment. The
available options for the long-term financing needs to be understood with taking long term
loan from the bank at best possible rate of interest. In addition to this, the long-term financing
options are contingent with looking for JV agreements through retained portion of profits
which may be used as the working capital by the company (Cashin et al. 2017).
In extreme situations Sainsbury’s PLC has the option of issuing equities and debentures. This
will be beneficial for the organization in consideration of investments in large-scale ventures.
This can be proceeded by issuing bonds and debentures to the general public and in some
cases when there is a requirement of huge quantum of funds (Braun and Raddatz 2016).
Answer to Part 2
Most leaders are of the opinion that budget process is identified with a considerable problem
of being fit for the modern environment from a planning and control dimension. The budget
in general is supposed to provide a detailed plan in a strategic planning period. Despite of
this, previous experience has shown instances where there has been little constitution made
towards viability of budgeting. The budgeting process is considered as a constraint to the
value adding activities. Some of the different forms of the negative effects generated by the
process of budget needs to be well-thought-out in terms of the fighting for unambitious
targets by the rational managers thereby leading to scope for personal gains. Secondly, as the
budget are always fluctuating, the company may face difficulties in determining its success in
a particular year of operations. Some of the different types of the other constraints of the
process of budgeting needs to be understood in terms of increased cost of implementation and
integration with number of other cost overheads. Even in case the goal of cost budget is met,
there is no assurance for the company in using optimal resources. Therefore, even if the
revenue budget is met, there is no proof of success and origin of the market share (Xing et al.
2017).
The use of the predictive modelling techniques such as cloud computing and big data will be
useful in understanding the usability of data mining in finance and discerning probability of
the forecasted outcomes for the company. The predictive modeling methodologies are seen
with using logistic regression, time series analysis and decision trees. The predictive
modelling in the next five years may be able to detect the money laundering practices and at
the same time incorporate a linear predictive model. The retail giants may be adopting neural
networks such as machine learning and deep learning and incorporate artificial intelligence to
track the changes in consumer demand which would have not been possible in traditional
budgeting (Ogiela 2015).
Answer to Part 3
In general, the performance management has been beneficial for the organisations in staying
ahead of the competition. The various types of the performance management tools and
techniques to improve the performance of the organization both at corporate and individual
level are listed as follows:
Key performance indicators (KPIs) and metrics- The KPIs are often inferred to be
commonly used as performance management tools. The primary values of the KPIs is
not in measurement per se but in enabling a rich data driven performance which may
be considered with better decision making (Le et al. 2018).
Performance Appraisals: In case these are appropriately used then performance
appraisals will be incredibly powerful and make possibility of alignment of the
strategic aims and goals of individuals. The employees should feel that the appraisal is
fair, regular and honest with a constructive two-way conversation (Ksendzova,
Donnelly and Howell 2017).
Providing a 360-degree feedback: This particular tool is conducive for addressing
the question of how the individuals are performing in the eyes of those who are having
a stake in the business. It is able to provide the individuals with the appropriate
assessment of their performance as per the views of customers, suppliers, supervisor
and manager. The results of such an analysis are significantly tallied with the various
types of the assertions which are depicted to be made by the manager. The
⊘ This is a preview!⊘
Do you want full access?
Subscribe today to unlock all pages.
Trusted by 1+ million students worldwide
1 out of 22


Your All-in-One AI-Powered Toolkit for Academic Success.
+13062052269
info@desklib.com
Available 24*7 on WhatsApp / Email
![[object Object]](/_next/static/media/star-bottom.7253800d.svg)
Unlock your academic potential
Copyright © 2020–2026 A2Z Services. All Rights Reserved. Developed and managed by ZUCOL.