Financial Performance and Position: Sainsbury's vs Tesco Analysis
VerifiedAdded on 2021/02/20
|31
|3707
|144
Report
AI Summary
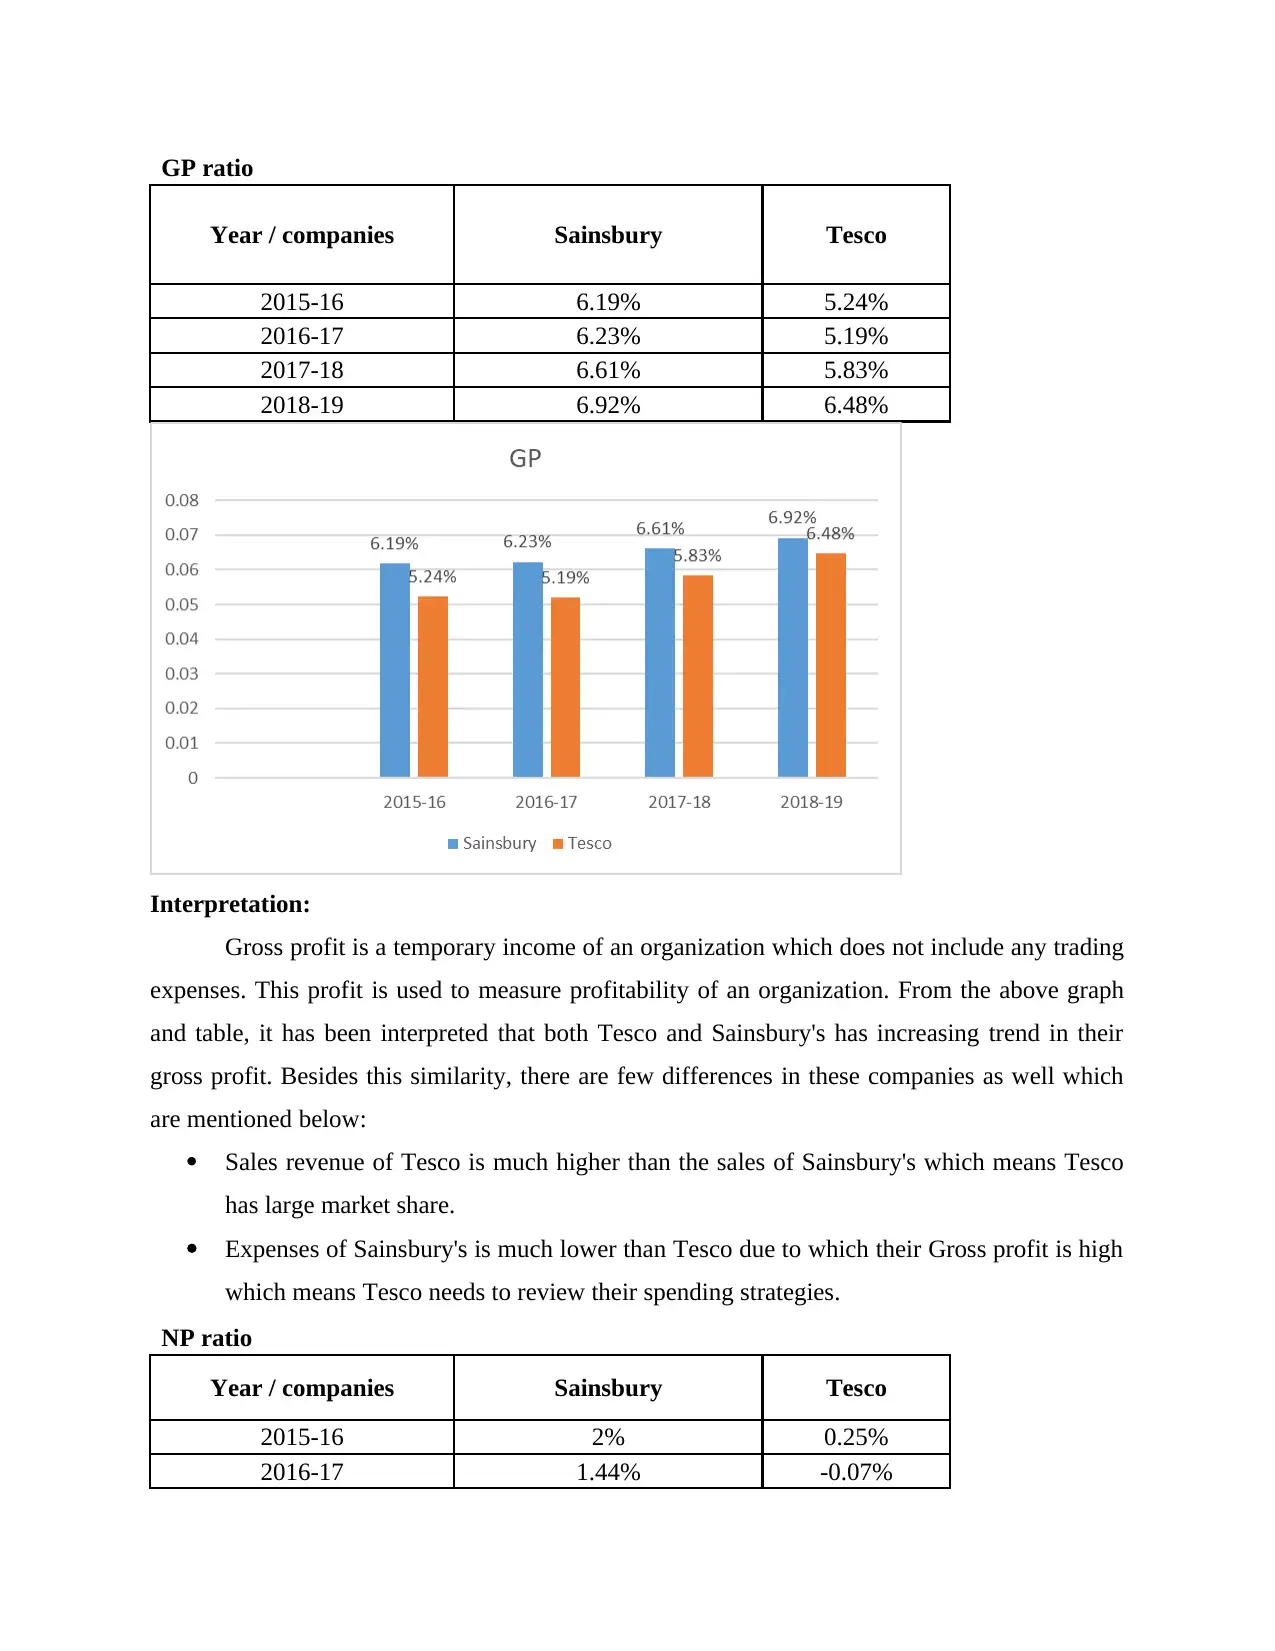
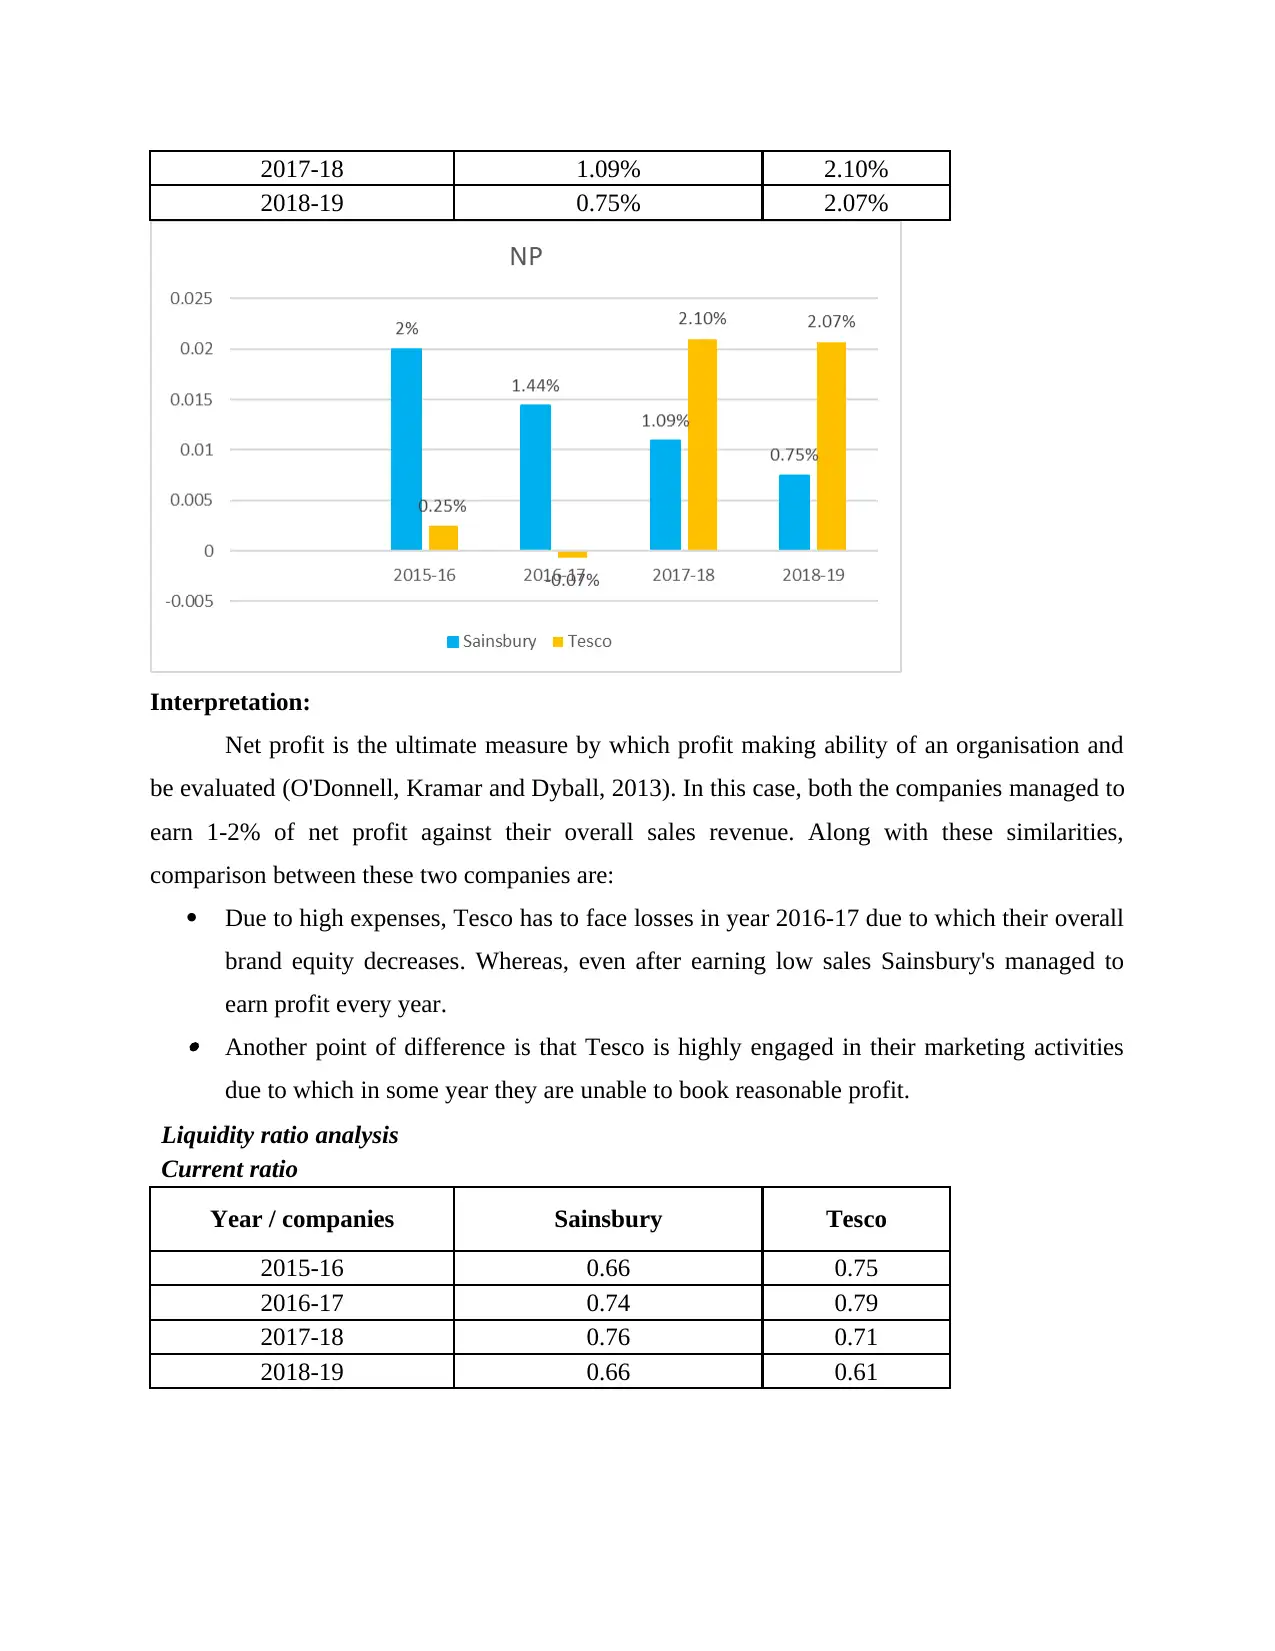
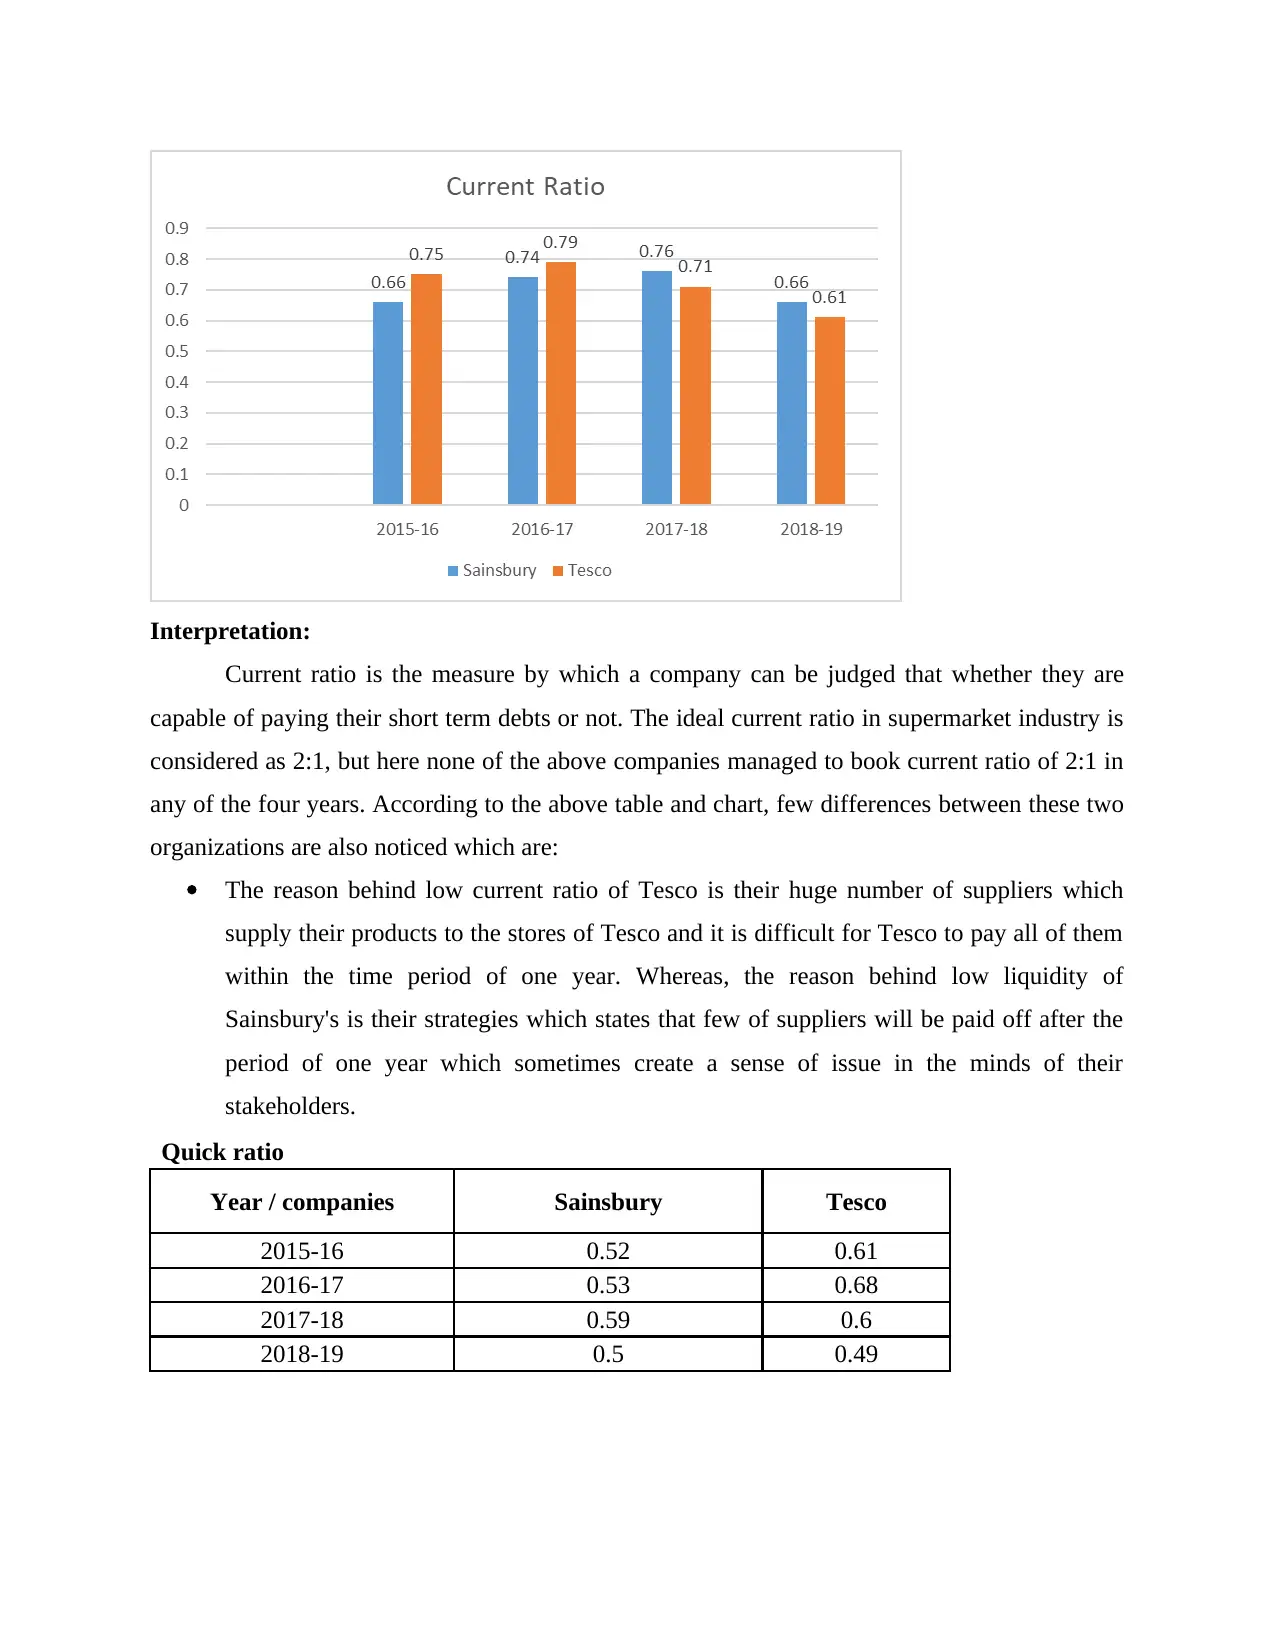
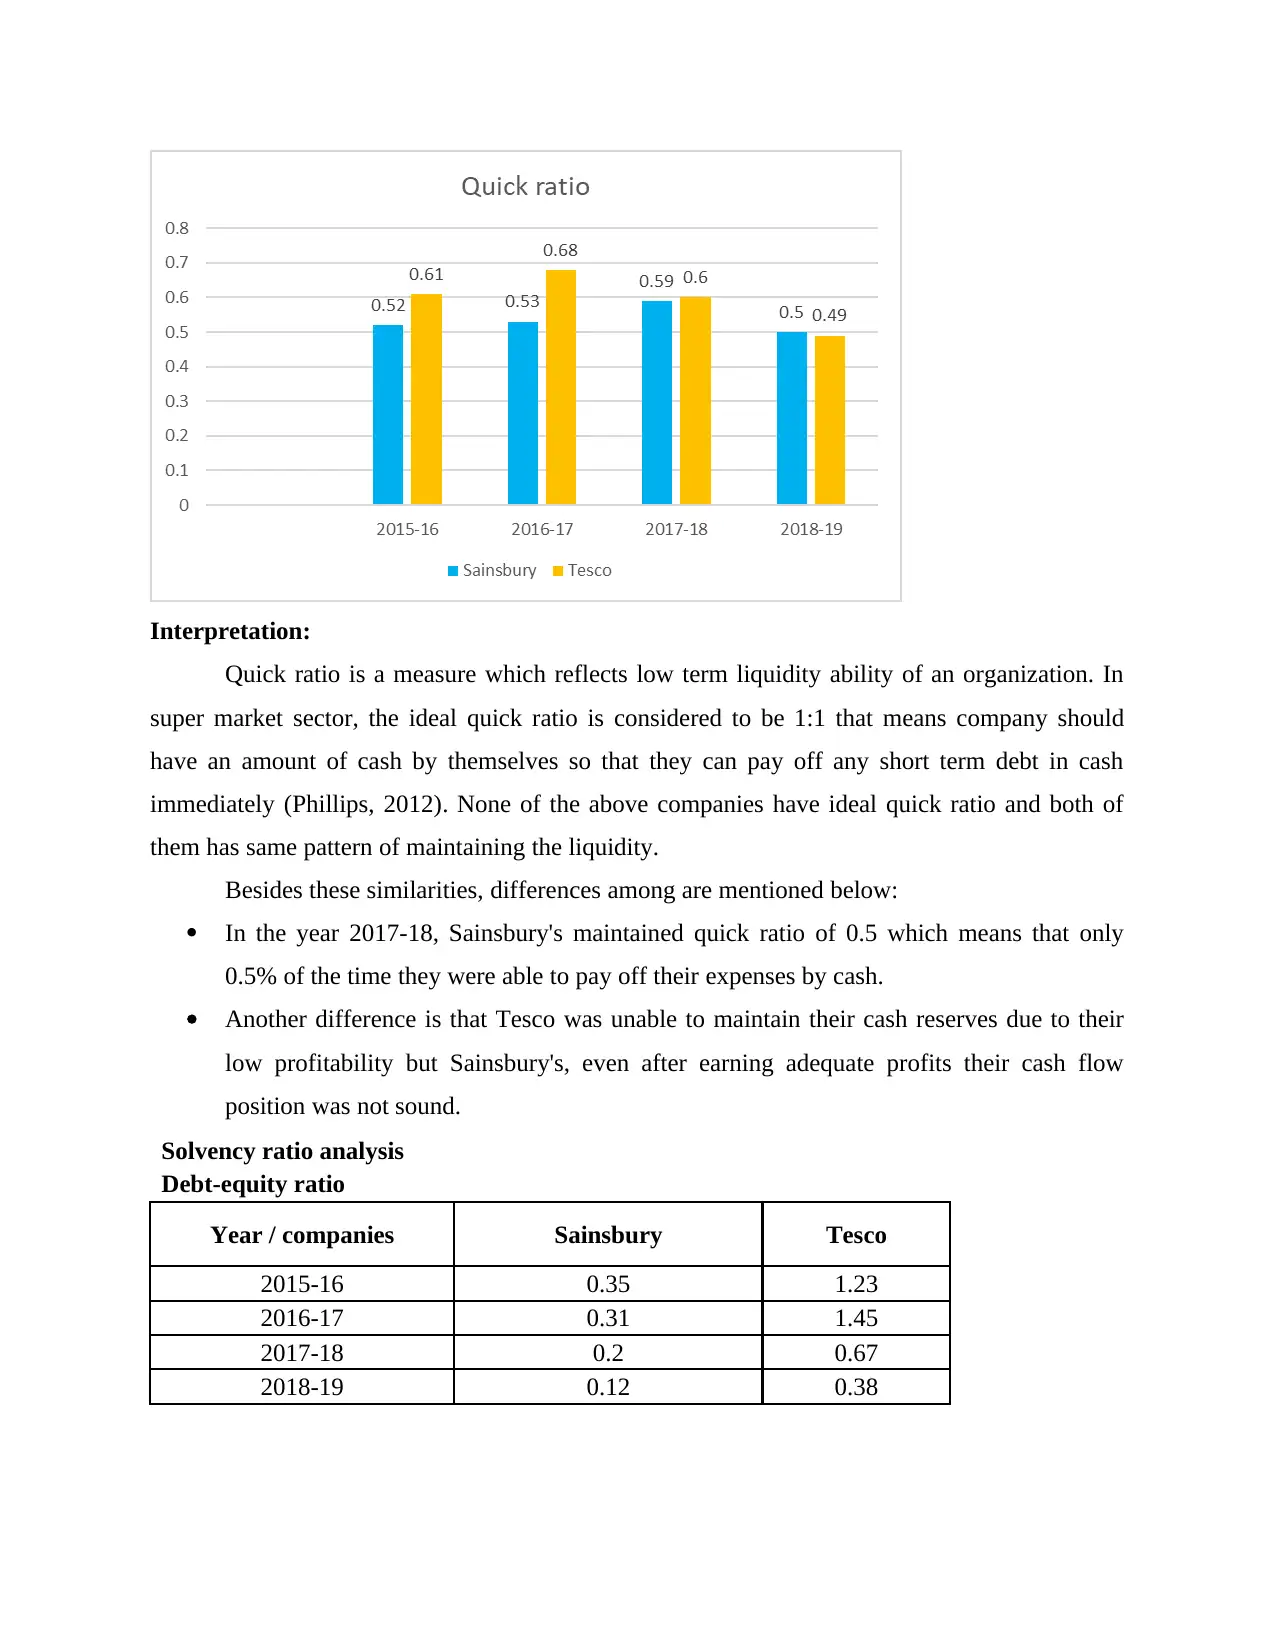
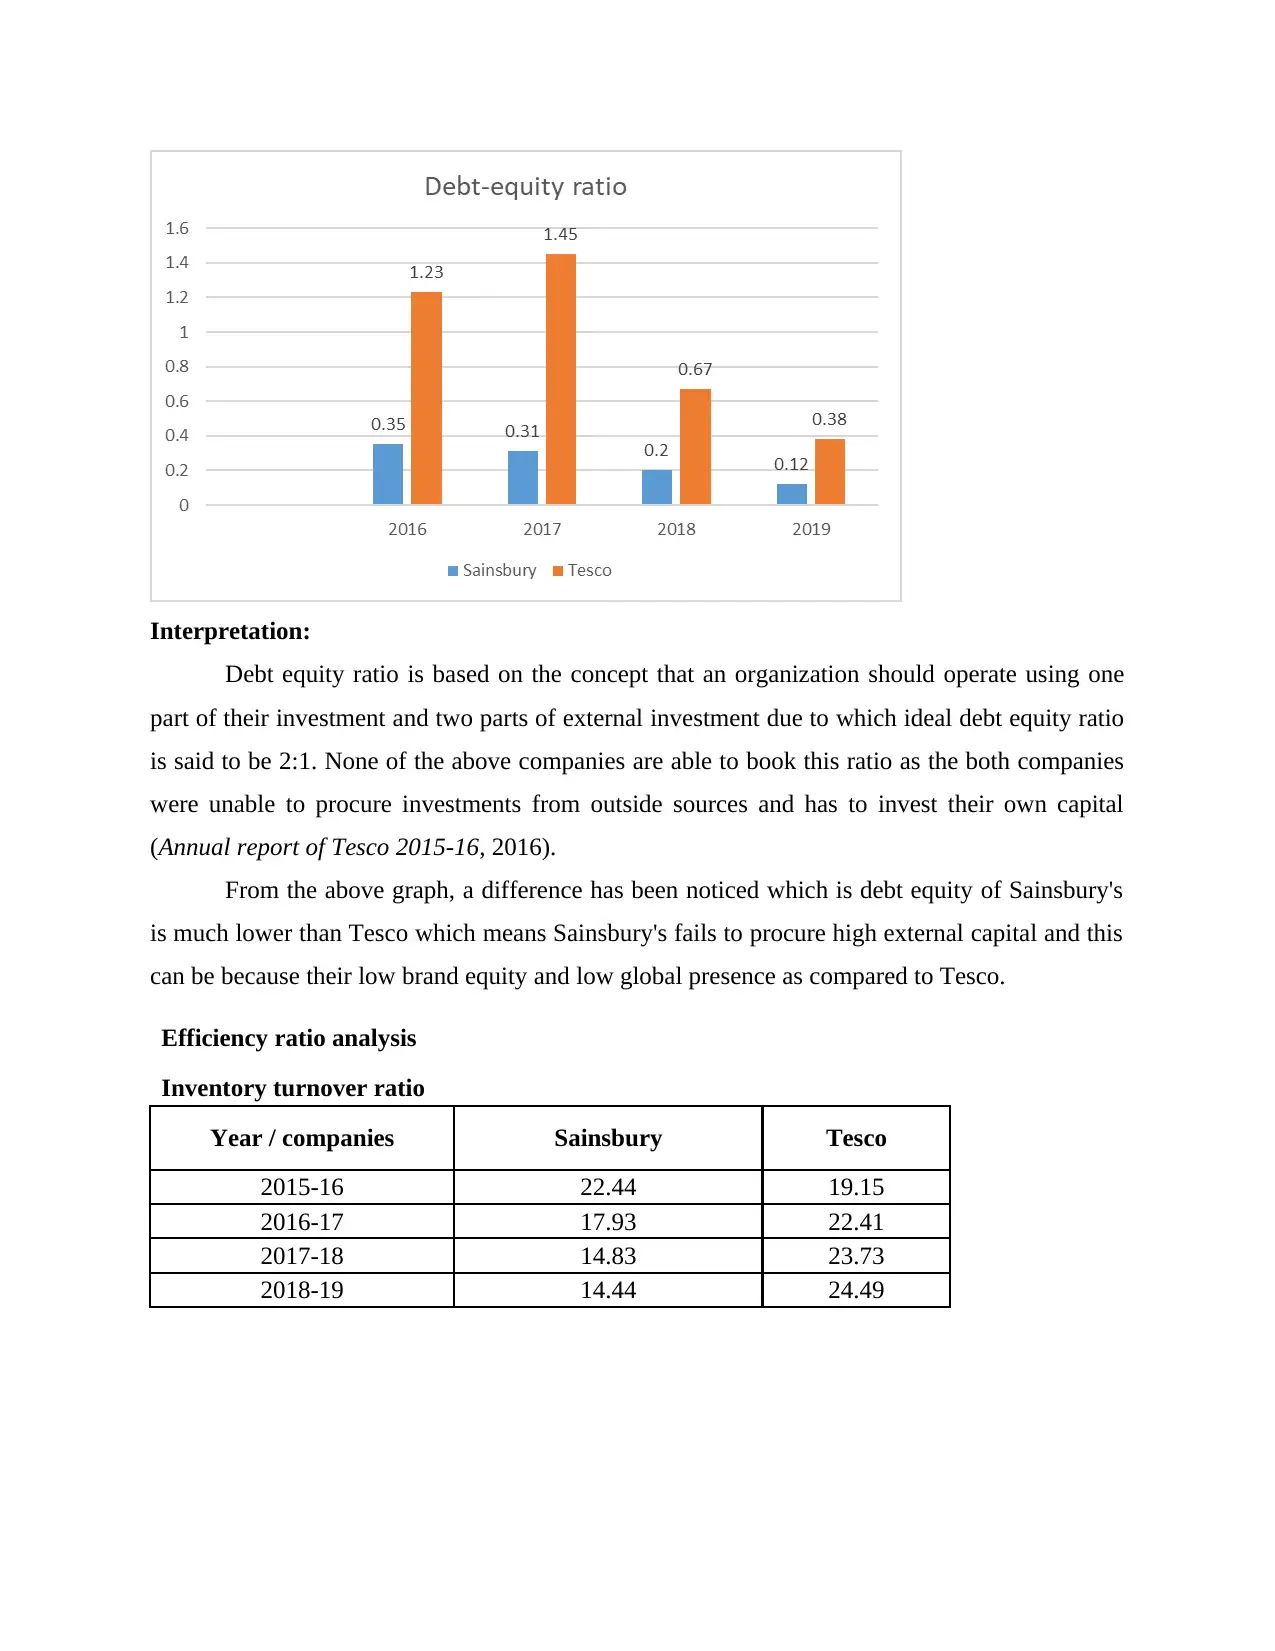
This report presents a comprehensive financial analysis of two major UK supermarket chains, Sainsbury's and Tesco, to aid an Asian food manufacturer in making export decisions. The analysis employs various financial techniques, including ratio analysis (profitability, liquidity, solvency, and efficiency ratios), horizontal analysis, and vertical analysis, to evaluate their financial performance and position from 2015-2019. The report also examines the working capital and cash flow of both companies. The findings highlight key differences in market share, expense management, liquidity, and debt-equity ratios, providing a detailed comparison to determine the most suitable company for exporting food products. The analysis reveals that Tesco has a larger market share and higher sales revenue but struggles with profitability and liquidity compared to Sainsbury's. The report concludes with a comparative assessment of both companies based on the financial indicators analyzed.

Financial Analysis and
management Enterprise
Paraphrase This Document
Need a fresh take? Get an instant paraphrase of this document with our AI Paraphraser

Contents
INTRODUCTION...........................................................................................................................1
MAIN BODY..................................................................................................................................1
Evaluation of the financial performance and financial position of Sainsbury’s and Tesco........1
Evaluation of the Working Capital............................................................................................19
Evaluation of the Cash Flow......................................................................................................20
CONCLUSION..............................................................................................................................20
REFERENCES..............................................................................................................................21
APPENDIX......................................................................................................................................2

INTRODUCTION
Financial analysis is a process of analysing financial statements of an organisation in order
to ascertain the financial performance of that company. This process helps stakeholders of that
organisation such as investors, debtors etc. to ascertain true performance of that company which
helps in their decision making process (Christensen, Cottrell and Baker, 2013). The main aim of
this report is help a large Asian food manufacturer to decide in which company they should
export their products. Two UK based organisations dealing in food products selected for this
report is Tesco and Sainsbury’s.
Tesco is a public limited company which is a general merchandise retailer and deals in
various food products and other household goods. This company is headquartered in United
Kingdom and is one of the largest retailer. Another company selected in this report is
Sainsbury’s which deals in food products, clothing and homecare appliances. This company is
headquartered in London, United Kingdom and has huge share in supermarket sector (Eng, Lea
and Cai, 2014). In this report, both of these companies are analysed in order to evaluate their
financial performance with the help of techniques such as ratio analysis, horizontal analysis and
vertical analysis. Along with evaluation of financial performance and financial position, working
capital and cash flow of both the companies is also analysed.
MAIN BODY
Evaluation of the financial performance and financial position of Sainsbury’s and Tesco
Financial performance and position are the parameters by which a company is judged that
whether it is suitable to be considered for an investment or not (Lee and et.al., 2018). In this
case, a large Asian food manufacturer is considering to export its products in one of the
companies among Tesco and Sainsbury’s due to which these two companies are contrasted and
compared using techniques such as Ratio analysis, Horizontal analysis and Vertical analysis.
RATIO ANALYSIS
This is a tool of evaluating financial statements of an organisation on the basis of few
parameters which are liquidity, solvency, operational efficiency etc. (Najeeb, Bacha and Masih,
2015). Using this fundamental analysis, financial statements like income statement and balance
sheet of both companies are compared and contrasted below:
Profitability ratio analysis
⊘ This is a preview!⊘
Do you want full access?
Subscribe today to unlock all pages.

Trusted by 1+ million students worldwide

GP ratio
Year / companies Sainsbury Tesco
2015-16 6.19% 5.24%
2016-17 6.23% 5.19%
2017-18 6.61% 5.83%
2018-19 6.92% 6.48%
Interpretation:
Gross profit is a temporary income of an organization which does not include any trading
expenses. This profit is used to measure profitability of an organization. From the above graph
and table, it has been interpreted that both Tesco and Sainsbury's has increasing trend in their
gross profit. Besides this similarity, there are few differences in these companies as well which
are mentioned below:
Sales revenue of Tesco is much higher than the sales of Sainsbury's which means Tesco
has large market share.
Expenses of Sainsbury's is much lower than Tesco due to which their Gross profit is high
which means Tesco needs to review their spending strategies.
NP ratio
Year / companies Sainsbury Tesco
2015-16 2% 0.25%
2016-17 1.44% -0.07%
Year / companies Sainsbury Tesco
2015-16 6.19% 5.24%
2016-17 6.23% 5.19%
2017-18 6.61% 5.83%
2018-19 6.92% 6.48%
Interpretation:
Gross profit is a temporary income of an organization which does not include any trading
expenses. This profit is used to measure profitability of an organization. From the above graph
and table, it has been interpreted that both Tesco and Sainsbury's has increasing trend in their
gross profit. Besides this similarity, there are few differences in these companies as well which
are mentioned below:
Sales revenue of Tesco is much higher than the sales of Sainsbury's which means Tesco
has large market share.
Expenses of Sainsbury's is much lower than Tesco due to which their Gross profit is high
which means Tesco needs to review their spending strategies.
NP ratio
Year / companies Sainsbury Tesco
2015-16 2% 0.25%
2016-17 1.44% -0.07%
Paraphrase This Document
Need a fresh take? Get an instant paraphrase of this document with our AI Paraphraser

2017-18 1.09% 2.10%
2018-19 0.75% 2.07%
Interpretation:
Net profit is the ultimate measure by which profit making ability of an organisation and
be evaluated (O'Donnell, Kramar and Dyball, 2013). In this case, both the companies managed to
earn 1-2% of net profit against their overall sales revenue. Along with these similarities,
comparison between these two companies are:
Due to high expenses, Tesco has to face losses in year 2016-17 due to which their overall
brand equity decreases. Whereas, even after earning low sales Sainsbury's managed to
earn profit every year. Another point of difference is that Tesco is highly engaged in their marketing activities
due to which in some year they are unable to book reasonable profit.
Liquidity ratio analysis
Current ratio
Year / companies Sainsbury Tesco
2015-16 0.66 0.75
2016-17 0.74 0.79
2017-18 0.76 0.71
2018-19 0.66 0.61

Interpretation:
Current ratio is the measure by which a company can be judged that whether they are
capable of paying their short term debts or not. The ideal current ratio in supermarket industry is
considered as 2:1, but here none of the above companies managed to book current ratio of 2:1 in
any of the four years. According to the above table and chart, few differences between these two
organizations are also noticed which are:
The reason behind low current ratio of Tesco is their huge number of suppliers which
supply their products to the stores of Tesco and it is difficult for Tesco to pay all of them
within the time period of one year. Whereas, the reason behind low liquidity of
Sainsbury's is their strategies which states that few of suppliers will be paid off after the
period of one year which sometimes create a sense of issue in the minds of their
stakeholders.
Quick ratio
Year / companies Sainsbury Tesco
2015-16 0.52 0.61
2016-17 0.53 0.68
2017-18 0.59 0.6
2018-19 0.5 0.49
⊘ This is a preview!⊘
Do you want full access?
Subscribe today to unlock all pages.

Trusted by 1+ million students worldwide

Interpretation:
Quick ratio is a measure which reflects low term liquidity ability of an organization. In
super market sector, the ideal quick ratio is considered to be 1:1 that means company should
have an amount of cash by themselves so that they can pay off any short term debt in cash
immediately (Phillips, 2012). None of the above companies have ideal quick ratio and both of
them has same pattern of maintaining the liquidity.
Besides these similarities, differences among are mentioned below:
In the year 2017-18, Sainsbury's maintained quick ratio of 0.5 which means that only
0.5% of the time they were able to pay off their expenses by cash.
Another difference is that Tesco was unable to maintain their cash reserves due to their
low profitability but Sainsbury's, even after earning adequate profits their cash flow
position was not sound.
Solvency ratio analysis
Debt-equity ratio
Year / companies Sainsbury Tesco
2015-16 0.35 1.23
2016-17 0.31 1.45
2017-18 0.2 0.67
2018-19 0.12 0.38
Paraphrase This Document
Need a fresh take? Get an instant paraphrase of this document with our AI Paraphraser

Interpretation:
Debt equity ratio is based on the concept that an organization should operate using one
part of their investment and two parts of external investment due to which ideal debt equity ratio
is said to be 2:1. None of the above companies are able to book this ratio as the both companies
were unable to procure investments from outside sources and has to invest their own capital
(Annual report of Tesco 2015-16, 2016).
From the above graph, a difference has been noticed which is debt equity of Sainsbury's
is much lower than Tesco which means Sainsbury's fails to procure high external capital and this
can be because their low brand equity and low global presence as compared to Tesco.
Efficiency ratio analysis
Inventory turnover ratio
Year / companies Sainsbury Tesco
2015-16 22.44 19.15
2016-17 17.93 22.41
2017-18 14.83 23.73
2018-19 14.44 24.49

Interpretation:
Inventory turnover ratio refers to the overall movement in the stock of an organization.
From the above table, it is clearly seen that both of these companies has this ratio near to ideal
inventory turnover ratio which is one fifth of total inventory. Few differences booked from above
graph are:
Sainsbury's has decreasing trend in their inventory turnover ratio but Tesco has
increasing trend.
Tesco re-stock their inventory in every 4-6 days whereas Sainsbury's takes 6-7 days (Annual
report of Sainsbury’s 2015-16, 2016).
Total assets turnover ratio
Year / companies Sainsbury Tesco
2015-16 1.4 1.24
2016-17 1.43 1.25
2017-18 1.36 1.27
2018-19 1.27 1.36
⊘ This is a preview!⊘
Do you want full access?
Subscribe today to unlock all pages.

Trusted by 1+ million students worldwide

Interpretation:
Total assets turnover ratio is the ability of an organization to make sales from their assets.
The similarity between above two organizations is that these both companies are able to use their
assets effectively and record high sales as their ratios are somewhere similar.
From the above table and graph, the difference which is observed is that total
consolidated assets of Tesco are much more valuable than Sainsbury's and this is because huge
operations of Tesco worldwide (Annual report of Sainsbury’s 2016-17, 2017).
Fixed assets turnover ratio
Year / companies Sainsbury Tesco
2015-16 1.91 1.78
2016-17 2.02 1.88
2017-18 2.07 1.87
2018-19 1.93 1.89
Paraphrase This Document
Need a fresh take? Get an instant paraphrase of this document with our AI Paraphraser

Interpretation:
This ratio is similar to total assets ratio but here only fixed assets are considered. It is
seen from above calculations, that Sainsbury's is more capable of earning higher sales from their
fixed assets but fixed assets of Tesco are much more valuable. The similarity which is noted
from above content is the pattern which is fluctuating in both the cases (Annual report of Tesco
2016-17, 2017).
Investment ratios
Earnings per share
Year / companies Sainsbury Tesco
2015-16 0.23 0.05
2016-17 0.17 -0.01
2017-18 0.13 0.44
2018-19 0.08 0.41

Interpretation:
This ratio benefits investors of the companies as by analyzing this ratio, an investor can
ascertain that what is the possibility of them to earn profit from their investment (Portney and
Weyant, 2013). From the above ratio table and graph, it is observed that Sainsbury's per share
earnings is decreasing day by day which means stock value of this company is not reliable.
Whereas, Tesco investors always gets enough returns due to which stock value of this company
is always sound.
Dividends per share
Year / companies Sainsbury Tesco
2015-16 0.12 -
2016-17 0.12 -
2017-18 0.1 0.03
2018-19 0.1 0.11
⊘ This is a preview!⊘
Do you want full access?
Subscribe today to unlock all pages.

Trusted by 1+ million students worldwide
1 out of 31
Related Documents

Your All-in-One AI-Powered Toolkit for Academic Success.
+13062052269
info@desklib.com
Available 24*7 on WhatsApp / Email
Unlock your academic potential
Copyright © 2020–2025 A2Z Services. All Rights Reserved. Developed and managed by ZUCOL.